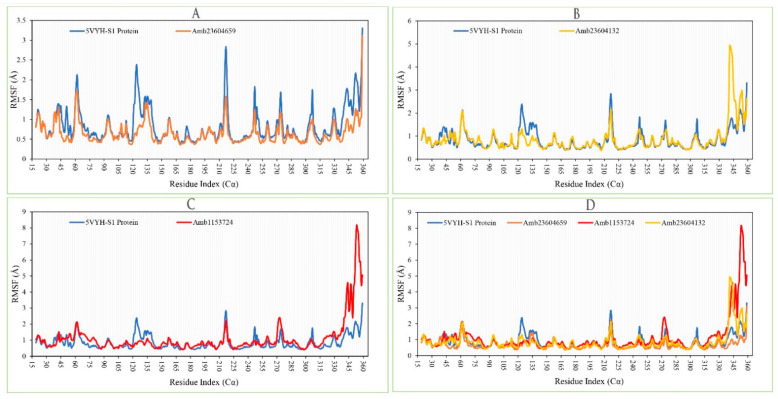
Figure 10.
Showing the RMSF values extracted from the Cα atoms of the selected three complex structures. Herein, showing the RMSF of S1-NTD protein (Blue) in complex with the compounds (A) Amb23604659 (orange), (B) Amb23604132 (Yellow), and (C) Amb1153724 (Red), where (D) representing all the compounds and protein RMSF together.

