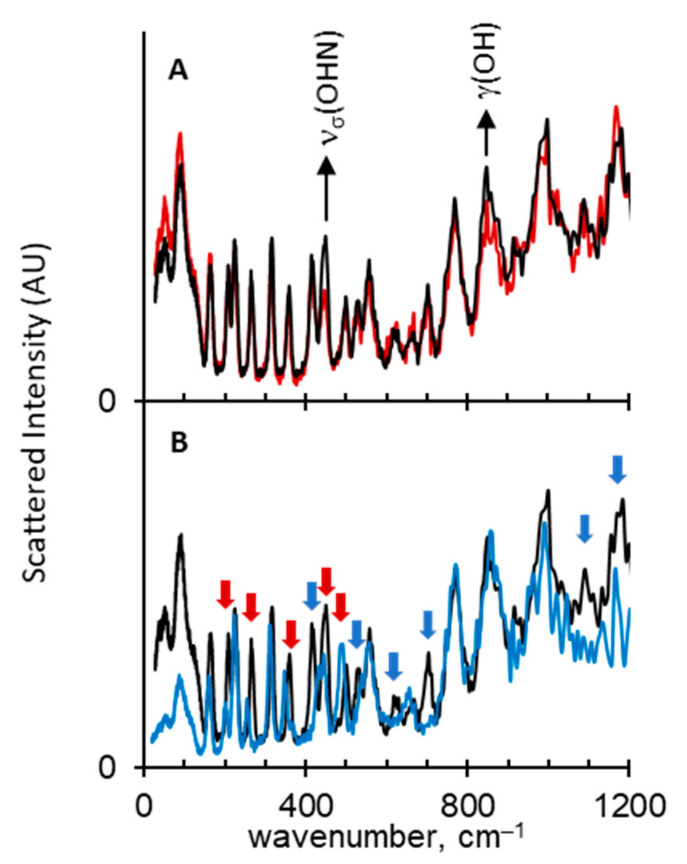
Figure 4.
Normalized IINS spectra of SA (black traces), SA-OD (panel (A), red trace) and SA-C6D5 (panel (B), blue trace). Blue arrows: bands of γ(CH) and τ(CH) vibrations, which disappear after deuteration. Red arrows: bands of various vibrations, which shift after the deuteration. See text for more details.

