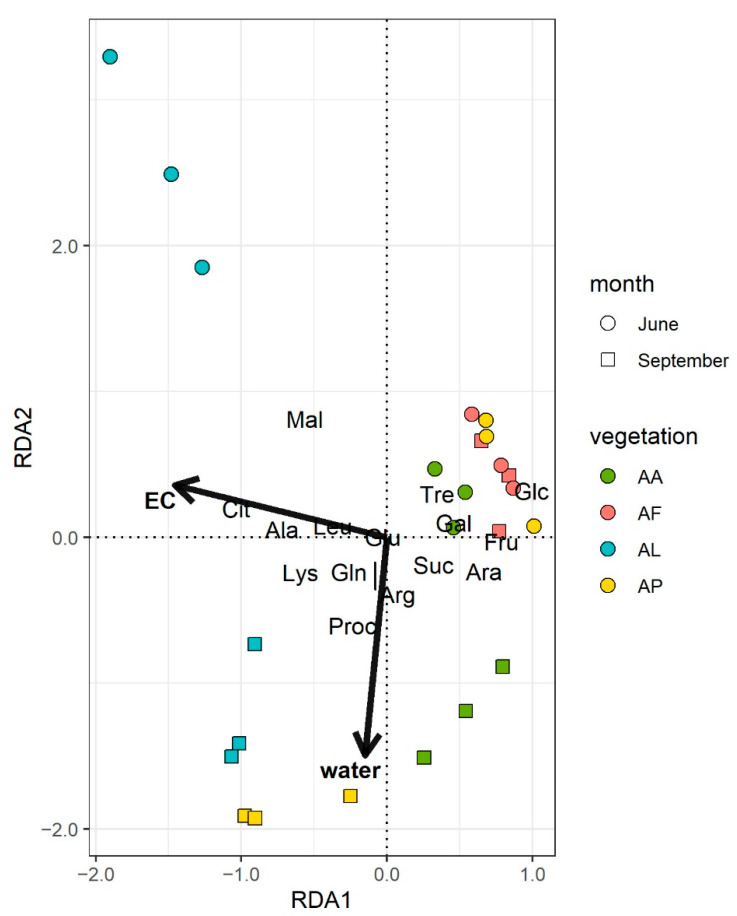
Figure 2.
Redundancy analysis plot of the final model for the catabolic profiles. The lengths of arrows for environmental variables were multiplied by 1.5 for better visibility. (EC: electrical conductivity (µS cm−1), water: soil water content (m/m%). Sample identifiers are presented in Table 1). The meaning of the abbreviated substrate names are in the Materials and Methods in Section 2.4.

