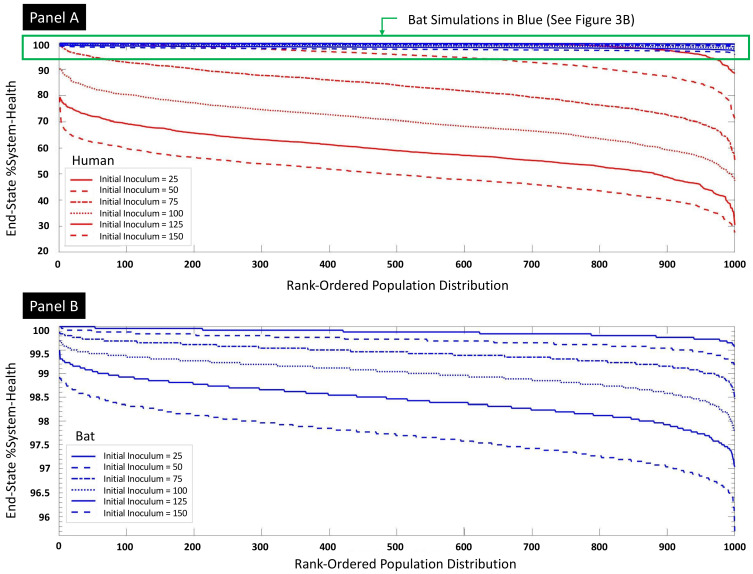
Figure 3.
Sweeps of virus initial inoculum for bat and human parameterizations with 1000 stochastic replicates per condition. Panel (A) shows both bat (blue) and human (red) rank-ordered population distributions at initial inoculums from 25 to 150 in 25 increments. The rank-ordered population distributions reflect the stochastic replicates ranked by their end #System-Health at the end of 14 days simulated time; while these lines are technically 1000 individual columns, for visualization purposes, they are shown as curves. The decreasing curves seen with increasing initial inoculum are consistent with a dose-dependent worsening of outcomes across a population of runs. Note that the bat parameterizations essentially demonstrate no disease severity (in terms of reduced %System-Health) for the corresponding IIs that generate significantly reduced %System-Health in human parameterizations. Panel (B) is a magnification of the results for the bat parameterizations, which shows a similar dose-dependency but with considerably reduced tissue damage (note Y = axis for Panel B starts at 96).

