

Abstract
Circadian alignment is an important element in individual health, and one behavioral marker, rest-activity rhythm, could influence self-management in young adults with type 1 diabetes (T1D). Little is known about the rest-activity rhythms, executive function, and glycemia among young adults with type 1 diabetes (T1D). The purpose of this study was to evaluate parametric and nonparametric circadian characteristics of the rest-activity rhythm and the associations between these variables, sleep-wake behavior, executive function, and glycemia among young adults with T1D. Young adults with T1D, recruited from diabetes clinics, wore wrist actigraphs and a continuous glucose monitor (CGM) concurrently for 6–14 days. Participants completed a 3-minute Trail Making Test on paper and electronic questionnaires – 8-item PROMIS v1.0 Emotional Distress Scale, 17-item Diabetes Distress Scale, including twice-daily Pittsburgh sleep diaries. Cosinor and nonparametric analyses were used to compute the rest-activity rhythm parameters, and linear regression modeling procedures were performed to determine the associations among the study variables. The sample included 46 young adults (mean age 22.3±3.2; 32.6% male; 84.8% non-Hispanic White, HbA1c mean 7.2±1.1%, BMI mean 27.0±4.4 kg/m2). A number of parametric associations were observed between a stronger rhythm, better objective sleep-wake characteristics, and less daytime sleepiness. Nonparametric circadian parameters were significantly associated with several outcomes: a stronger rhythm adherence (higher inter-daily stability) with better objective sleep-wake characteristics, better executive function, lower diabetes distress, less hyperglycemia risk, and more time spent in hypoglycemia/hypoglycemia risk; and a more robust rhythm (higher relative amplitude) with better objective sleep-wake characteristics and more time spent in hypoglycemia/higher hypoglycemia risk. Future work should be directed at designs that test causality, such as interventions directed at the strength and stability of rest-activity rhythms, for the potential to improve glucoregulation and other diabetes outcomes.
Keywords: circadian rest-activity rhythm, sleep, type 1 diabetes, cosinor analysis, actigraphy, diabetes self-management, young adult
Brief Summary
Current Knowledge/Study Rationale:
Short sleep duration contributes to impaired glucoregulation in people with type 1 diabetes (T1D) across the lifespan. Alterations in circadian rhythmicity of rest-activity may also be associated with impaired glucoregulation; however, little is known about the associations between characteristics of the rest-activity rhythm and glucose patterns in young adults with T1D.
Study Impact:
This is the first study to detect associations between rest-activity rhythms and glucose fluctuations over 7–14 days among young adults with type 1 diabetes. These associations suggest that interventions targeted at improving the circadian stability and strength of rest-activity rhythms may improve glucocoregulation and other diabetes outcomes in young adults with T1D.
Introduction
Type 1 diabetes (T1D), an autoimmune disorder arising from the destruction of insulin-producing beta cells, affects over 45 million people globally, with an increase of 3% annually (Saeedi et al., 2019). Achieving glycemic targets (hemoglobin A1c [HbA1c] < 7% or <4.34 mmol/L) is the cornerstone of diabetes care to prevent or delay micro- and macrovascular complications, but fewer than one-third of young adults ages 18–30 years achieve these targets (Foster et al., 2019). Young adults with T1D experience a high symptom burden, executive dysfunction, and excessive healthcare costs as they transition into college or their careers (e.g., cost of insulin increased by 686% since 2001) (Saeedi et al., 2019).
Short sleep and the subsequent circadian misalignment leads to insulin resistance and hyperglycemia in adults without chronic conditions (Baron & Reid, 2014; Eckel et al., 2015; Laposky, Bass, Kohsaka, & Turek, 2008) and reduced insulin sensitivity in adults with T1D (Donga et al., 2010). Therefore, there is a critical need to address such modifiable factors contributing to these T1D outcomes, ways to precisely monitor and capture them, and interventions to improve them. Sleep disruptions and poor sleep quality are common in young adults with T1D and contribute to poor executive function, emotional distress, and glycemic control (Borel et al., 2013; Larcher et al., 2016; Reutrakul et al., 2016). Although sleep characteristics are both circadian and homeostatic processes (Bass & Takahashi, 2010), little is known about the associations between characteristics of the rest-activity rhythm and glucose patterns in young adults with T1D.
People with type 2 diabetes (T2D) have been the focus in some previous circadian rhythmicity studies (Cavalcanti-Ferreira et al., 2018; Kadono et al., 2016). In middle and older adults with T2D, changes in circadian variables occur along with associations between actigraphic variables and diabetes complications were observed (Cavalcanti-Ferreira et al., 2018; Kadono et al., 2016). Specifically, a higher intradaily variability (IV) and lower interdaily stability (IS) were associated with proliferative diabetic retinopathy; advanced phase tendencies were associated with cardiovascular disease; and a delayed phase tendency was associated with painful neuropathy in adults (mean age 68.7 ± 8.2 years) with T2D (Kadono et al., 2016). Middle and older adults with T2D (mean age 59.0 ± 8.6 years) demonstrated lower IS, higher IV, and lower rhythm amplitude than same-age adults without chronic conditions (Cavalcanti-Ferreira et al., 2018). In regard to adolescent health in T1D, a more robust (strong and enduring) and stable rhythm (higher mesor and amplitude) was associated with fewer trait anxiety symptoms in 40 individuals, but the associations between the rest-activity rhythm and glycemia variables were not significant (only parametric was measured) (Rechenberg et al., 2020). Similarly, it was self-reported sleep quality and sleep duration, not circadian parameters (social jetlag and chronotype), that were associated with decreased insulin sensitivity in 109 young and middle-aged adults with T1D (mean age 37.4 ± 14.6) (Rusu, Bala, Ciobanu, Cerghizan, & Roman, 2019). Substantial coupling was observed between physical activity and glucose variations, with rapid glucose variations consistently leading to changes in activity during sleep but not during wake in 23 young adults aged 18–30 years with T1D in a coherence analysis (Farabi, Carley, & Quinn, 2017).
The rest-activity rhythm is captured using actigraphy. The parameters that describe the circadian characteristics include mesor (midline estimating statistic of rhythm; 24 h times series mean), amplitude (magnitude of 24 h variation explained by the rhythm), acrophase (the time of peak activity), and circadian quotient (normalized amplitude). The adjustment of a cosine function to actigraphic data has been used in circadian rhythmicity studies (parametric). More robust rhythms (higher mesor and amplitude) are associated with less fatigue, anxiety, depression, better physical and cognitive performance, and better health outcomes in people with various chronic conditions (e.g., cancer, graft vs. host disease, and T2D) (Cavalcanti-Ferreira et al., 2018; Costanzo et al., 2017; Kadono et al., 2016; Rechenberg et al., 2020).
The rest-activity rhythm may not be captured with a cosine function, and the true average levels measured during the typically shorter sleep/rest period may be overestimated (Dowling et al., 2005); therefore, other variables have been studied, and new methodologies have been developed (Cavalcanti-Ferreira et al., 2018; Mitchell et al., 2017; Murray et al., 2019). These variables are not associated with parameters of a known function and are referred to as nonparametric. The nonparametric measures, therefore, add valuable insight beyond the circadian rhythmicity as they do not make assumptions about the robustness of the rhythms, which may be less pronounced in young adults with T1D.
Circadian and metabolic systems are reciprocally related (Bass & Takahashi, 2010). Therefore, understanding the specific parameters of this rhythm that may influence sleep and glucose fluctuations in young adults with T1D, a group at high risk for poor sleep and poor glycemic control, may help us identify approaches to address improvement the rest-activity rhythm in this population. HbA1c is the gold standard, but does not account for glycemic variability or hypoglycemia in those with T1D. Glucose variability (fluctuations outside of range) is also associated with premature micro- and macrovascular complications (Wilmot, Choudhary, Leelarathna, & Baxter, 2019). The primary purpose of this study, a secondary analysis, was to evaluate the parametric and nonparametric circadian characteristics of the rest-activity rhythm and glycemia (glycemic control and glucose fluctuations) over 14 days and to explore associations among these circadian characteristics, sleep-wake characteristics, executive function, and glycemia among young adults age 18–30 years with T1D.
Methods
Design.
We conducted a secondary analysis of a primary study on sleep-wake characteristics (objective and self-report), neurocognitive function, diabetes self-management, and glycemia collected from young adults with T1D using a between-persons descriptive design with variables averaged across all days of monitoring (6–14 days) (Griggs, Redeker, Crawford, & Grey, 2020; Griggs et al., forthcoming). Full details of the study procedure have been reported previously (Griggs et al., 2020) and details pertinent to this report are summarized below:
Participants.
Forty-six young adults with T1D were recruited from diabetes clinics through MyChart™ and in-person in the Northeastern United States between 2018 and 2020. The choice of this age was to capture post-pubertal persons entering adulthood who might be reasonably free of other developed non-diabetes co-morbidity and who had emerged into adult-like activities and habits, including a personal routine of sleep behavior. Included participants were (1) between the ages of 18–30 years; (2) diagnosed with T1D for at least 6 months; (3) with no other major health problems (e.g., chronic medical conditions or major psychiatric illness); (4) not participating in any intervention studies; and (5) read/spoke English. Those with a previous obstructive sleep apnea (OSA) diagnosis, night shift workers, and current pregnancy were not eligible to participate.
Procedures.
The study followed the World Medical Association Declaration of Helsinki for research involving human subjects and was approved by the Case Western Reserve University Institutional Review Board. Participants completed a 3-minute Trail Making Test on paper, questionnaires including twice-daily Pittsburgh sleep diaries in Research Electronic Data Capture (REDCap) and were instructed to wear an actigraph and continuous glucose monitor (CGM) concurrently for the study period. Young adults received a small incentive for their time to complete questionnaires. They received an additional incentive for returning the actigraph and CGM (if applicable) at the end of the monitoring period and participating in the exit interview (up to a total of $100). The 9-item Berlin Questionnaire (BQ) (Cronbach’s α = 0.86–0.92) (Netzer, Stoohs, Netzer, Clark, & Strohl, 1999) was used to screen participants at risk for sleep apnea. Participants were referred for treatment and not included in the study if they were deemed high risk for sleep apnea.
Demographic and clinical characteristics.
The Electronic Medical Record (EMR) was used to collect clinical and demographic data: Age, BMI (kg/m2), duration of diabetes, most recent HbA1c, and medical history (diabetes, sleep, and other). Other data were collected via a self-report survey: ethnicity, education, primary caregiver, employment status, military status, full-time student status, work hours, marital status, residence, household count, income, cigarette smoking, alcohol or other substance use, insulin therapy regimen (e.g., insulin injections or pump therapy), CGM pump brand (if applicable). Self-report data were validated through the EMR.
Self-report sleep-wake characteristics.
Self-report sleep quality was obtained with the 19-item Pittsburgh Sleep Quality Index (PSQI) (Cronbach’s α = 0.87; diagnostic sensitivity 89.6%; specificity 86.5%) (Backhaus, Junghanns, Broocks, Riemann, & Hohagen, 2002) and daytime sleepiness with the 8-item Epworth Sleepiness Scale (ESS) (Cronbach’s α = 0.88) (Johns, 1992). Participants recorded sleep in the Pittsburgh Sleep Diary (Monk et al., 1994) (PghSD) twice daily for 14 days while wearing the wrist actigraph. Participants logged timing and frequency of awakenings and bed/rise times in the PghSD.
Objective sleep-wake characteristics.
A total of 6–14 days of wrist actigraphy data on each participant with the Spectrum Plus (Philips Respironics™) was collected in 30-second epochs. The Spectrum Plus collects activity data with a standard spectrum of light and off wrist detection. Actigraph recordings are valid for identifying circadian disorders, sleep disturbance, and circadian, and other temporal rhythms are discernable in the time series data available through actigraphy (Sack et al., 2007). Participants were instructed to continuously wear the actigraph on their non-dominant wrist for 7–14 days and depress the event marker at “lights out” and “lights on” times to demarcate time in bed. They were asked to record bedtimes and wake times in an electronic diary in Research Electronic Data Capture (REDCap). The following sleep characteristics were computed for each night, and the average scores were used in the analysis: total sleep time, sleep efficiency (%), wake after sleep onset, sleep onset latency, sleep fragmentation index (movement index + fragmentation index), and bed/rise times.
Circadian rest-activity rhythm characteristics.
The raw time series activity data from the wrist actigraphy were exported for this analysis. Four circadian rhythm parametric parameters (mesor, amplitude, acrophase, and circadian quotient) (Cornelissen, 2014) and five nonparametric parameters (interdaily stability (IS) and intradaily variability (IV), least active 5-hour period (L5), most active 10-hour period (M10), and relative amplitude) were derived from the wrist actigraph recordings.
The circadian rest-activity rhythm for each participant was estimated using the regression model for a single-component cosinor model as
where Mi, Ai, and φi are the mesor (midline estimating statistic of rhythm: rhythm-adjusted average activity count), the amplitude (a measure of the half range of the predicted variation of a cycle), and the acrophase (time of the high peak of the cycle) for participant i respectively. Mesor is a 24-hour rhythm-adjusted mean of activity movements with higher values representing more robust movement. A robust rhythm is one that is strong and enduring (Gonze, Halloy, & Goldbeter, 2002; Refinetti, Cornélissen, & Halberg, 2007). Amplitude is a measure of the extent of rhythmic change or a range of activity and rest values over 24-hours. Acrophase is the peak alertness time (actual clock time of the peak amplitude) (Ancoli-Israel, Clopton, Klauber, Fell, & Mason, 1997; Ancoli-Israel, Klauber, et al., 1997; Grutsch et al., 2011; Levin et al., 2005). For the 24-hour cycle of the rhythm, the period (τ) is 1,440 mins (60 minutes/hours × 24 hours). Those parameters were estimated with a least-squares approach (Cornelissen, 2014).
The timing of the peak activity (∅) was calculated with the equation, . The circadian quotient was calculated as the ratio of the amplitude to the mesor. The circadian quotient provides a normalized amplitude compared to the individual average activity level (mesor) that accounts for daytime as well as nighttime activity; thus, it allows the comparison of the strength of circadian rhythm between people with different activity levels.
Interdaily stability (IS), intradaily variability (IV), least active 5-hour period (L5), most active 10-hour period (M10), and relative amplitude. The raw activity counts using hourly total activity counts (24 data points per day) (Cavalcanti-Ferreira et al., 2018) were extracted and analyzed using a nonparametric approach. IS shows the relationship between the zeitgeber (external time signaling stimuli), and IV represents the transitions between rest and activity. IS is described as the ratio between the variance of the average 24-hour pattern around the mean and the overall variance. IS ranges from 0 to 1 and is closer to 1 for stronger adherence to a circadian rhythm over consecutive days with consistent daily rest-activity rhythms. IS values have been reported in the range of 0.6 in young adults without chronic conditions (Calogiuri, Weydahl, & Carandente, 2013; Huang et al., 2002).
The IV quantifies fragmentation of the circadian rhythm within a 24-hour cycle and transitions between rest and activity (Zuurbier et al., 2015). It ranges from 0 to 2 with previously reported scores < 1 in adults without chronic conditions (Calogiuri et al., 2013; Huang et al., 2002). Higher IV represents a weaker rest-activity rhythm and is close to two for Gaussian noise (Zuurbier et al., 2015). The IV is close to zero for a strong rest-activity rhythm (Zuurbier et al., 2015).
The L5 reflects movement-activity during sleep plus nighttime arousals (Mitchell et al., 2017; Witting, Kwa, Eikelenboom, Mirmiran, & Swaab, 1990). On the other hand, M10 reflects how active the wake periods are, and this measure may be influenced by daytime napping (Mitchell et al., 2017; Witting et al., 1990). The relative amplitude is the difference between the M10 and the L5 in the average 24-hour pattern, normalized by their sum; higher relative amplitude indicates a more robust 24-hour rest-activity rhythm, reflecting both lower activity during the night and higher activity when awake (Mitchell et al., 2017).
Executive Function.
The principal investigator (PI, SG) administered the TMT, a 3 – 5 minute test on paper consisting of two parts (A & B) (Gaudino, Geisler, & Squires, 1995). The TMT provides information on visual search, scanning, speed of processing, mental flexibility, and executive functions. For the TMT-A, an individual must connect lines sequentially for 25 encircled numbers, and TMT-B, an individual must alternate between numbers and letters (e.g., 1, A, 2, B, 3, C, etc.). Seventy-five seconds is the adult average for the TMT-B, with deficiencies noted > 273 seconds (Gaudino et al., 1995). The TMT has high reliability and has been validated in young adults with test-retest reliability of TMT A and B of 0.76 and 0.89 and 0.86 and 0.94 respectively (S. Wagner, Helmreich, Dahmen, Lieb, & Tadić, 2011). Both parts were used in this study. This measure was scored by subtracting the score of part A from part B. Higher scores reflect poorer executive function, and the score represents the amount of time required to complete the task. The Cronbach’s alpha for the TMT in the current study was 0.71.
Glycemia.
Glycemic control data were collected from the Glycosylated HbA1c (HbA1c) levels in the electronic health record. HbA1c is routinely measured at quarterly clinic visits using the Siemens Vantage Glucose Analyzer® (range = 2.5–14%) (Arsie et al., 2000).
Glucose fluctuations were determined from the continuous glucose monitor (CGM) data. Young adults wore their own or a provided CGM blinded Dexcom G4™ concurrently with the actigraph. CGM data were downloaded directly to capture glucose patterns. Participants inserted a small sensor wire just under their skin using an automatic inserter during the baseline study visit (Kovatchev, Patek, Ortiz, & Breton, 2015). CGMs are accurate across a wide range of levels and provide dynamic glucose information every five minutes — up to 288 readings in a 24-hour period (J. Wagner, Tennen, & Wolpert, 2012). Glucose fluctuations were calculated from CGM with the following indices: mean±SD, time in range (calculated as % in target range 70–180 mg/dL, % time in hypoglycemia <54 mg/dL), and the glycemic risk assessment diabetes equation (GRADE) score (Suh & Kim, 2015). The GRADE score summarizes the degree of hyper- and hypoglycemia risk associated with a glucose profile.
Statistical analysis.
Data on the REDCap site were exported into the Statistical Package for the Social Sciences (SPSS) version 27 (SPSS for Mac, IBM Corp., Armonk, NY, USA) and SAS 9.4 (SAS Institute, Inc., Cary, NC, USA) for analysis. Actigraphy data were scored with Actiware v. 6.0.9 ™ software. Parametric and nonparametric circadian characteristics were computed using Clock Labs v. 6.0.54 software. CGM data were calculated with Glyculator v. 2.0™ software (Czerwoniuk, Fendler, Walenciak, & Mlynarski, 2011). Descriptive statistics were used to evaluate circadian characteristics of the rest-activity rhythm and glucose fluctuation indices. A series of t-tests and correlations were conducted to determine differences in rest-activity and sleep-wake parameters, executive function, glycemic control, and glucose fluctuations by age, sex, T1D duration, BMI, max and average light exposure in Lux and the differences were tested using both parametric and nonparametric tests.
Bivariate correlations were calculated between the circadian parameters, objective sleep-wake characteristics, self-report sleep-wake characteristics, executive function, and glycemia. The additional contributions of the circadian parameters (IS, IV) to the variance in executive function, daytime sleepiness, and glucose fluctuations were examined. Total sleep time and covariates (T1D duration, BMI, and sex) were controlled for in the multiple variable regression model to examine the unique contributions of the rest-activity rhythm.
Results
We present the descriptive statistics for the circadian characteristics measured by actigraphy in Table 1. The sample included 46 participants mean age = 22.3 ± 3.2 years, 32.6% male, 84.8% Non-Hispanic white, with 93.5% able to cover their monthly expenses. The mean T1D duration was 10.3 ± 6.0 years, mean HbA1c was 7.0 ± 1.0%, mean glucose measured via CGM across the 6–14 days was 163.0 ± 30.2 mg/dL, and most used an insulin pump (80.4%) and CGM (87%) for treatment.
Table 1.
Descriptive Statistics for the Circadian Rhythm Variables Computed from Wrist Actigraphy (mean difference and significance based on independent t test)
| Mean (SD) | ||
|---|---|---|
| Cosinor Model | ||
| MESOR | 186.35 | (50.84) |
| Amplitude | 286.89 | (104.52) |
| Acrophase, hours | 15.08 | (2.51) |
| Circadian Quotient | 1.56 | (0.43) |
| Nonparametric Variables | ||
| IS | 0.46 | (0.14) |
| IV | 0.82 | (0.25) |
| L5 | 30.35 | (37.01) |
| M10 | 294.07 | (80.39) |
| Relative amplitude | 0.82 | (0.25) |
Abbreviations: IS, inter-daily stability; IV, intra-daily variability; L5, least active 5-hour period; M10, most active 10-hour period.
The mean mesor was 186.35 ± 50.84, and the mean acrophase was approximately 15:00 h. The average amplitude was 286.89 ± 104.52 and the circadian quotient was 1.56 ± 0.43 for the total sample (Table 1). The means of the IS and IV were 0.43 ± 0.10 and 0.82 ± 0.25 respectively. The means of L5, M10, and relative amplitude were 30.4 ± 37.0, 294.1 ± 80.4, and 0.82 ± 0.3 respectively.
In Figure 1, four case examples are provided of the parametric (cosinor analysis) and nonparametric (IS, IV, RA) rest-activity rhythm measures and glucose fluctuation indices selected to illustrate the variability in rest-activity rhythms. Case I demonstrated robust rest-activity rhythm throughout the sampling period, yielding a stable rest-activity rhythm, with high IS (0.61) and low IV (0.54). Additionally, this participant had good glycemic control (HbA1C 5.8%). Conversely, Case II demonstrated a weak rest-activity rhythm, defined by frequent and sporadic activity throughout the measurement period, yielding a low IS (0.37), high IV (0.90), and low RA (0.72). Also, in contrast to Case I, this participant had poor glycemic control (HbA1C 9.1%) and was significantly advanced in phase (acrophase 12:00). Case III demonstrated nonparametric rhythm characteristics representative of the sample average (IS 0.42, IV 0.77) though was delayed in phase (acrophase 19:20). Case III had poor glycemic control (HbA1C 8.2%) also. Finally, Case IV, exhibited an average phase (acrophase 16:54) and nonparametric parameters largely representative of the sample (IV 0.86, RA 0.83). Case IV, however, demonstrated irregular activity throughout the sampling period, producing a low IS (0.32). Case IV met targets for glycemic control (HbA1c: 6.3%). These four selected cases are characteristic of the rest-activity rhythm variability in the sample as a whole.
Figure 1.
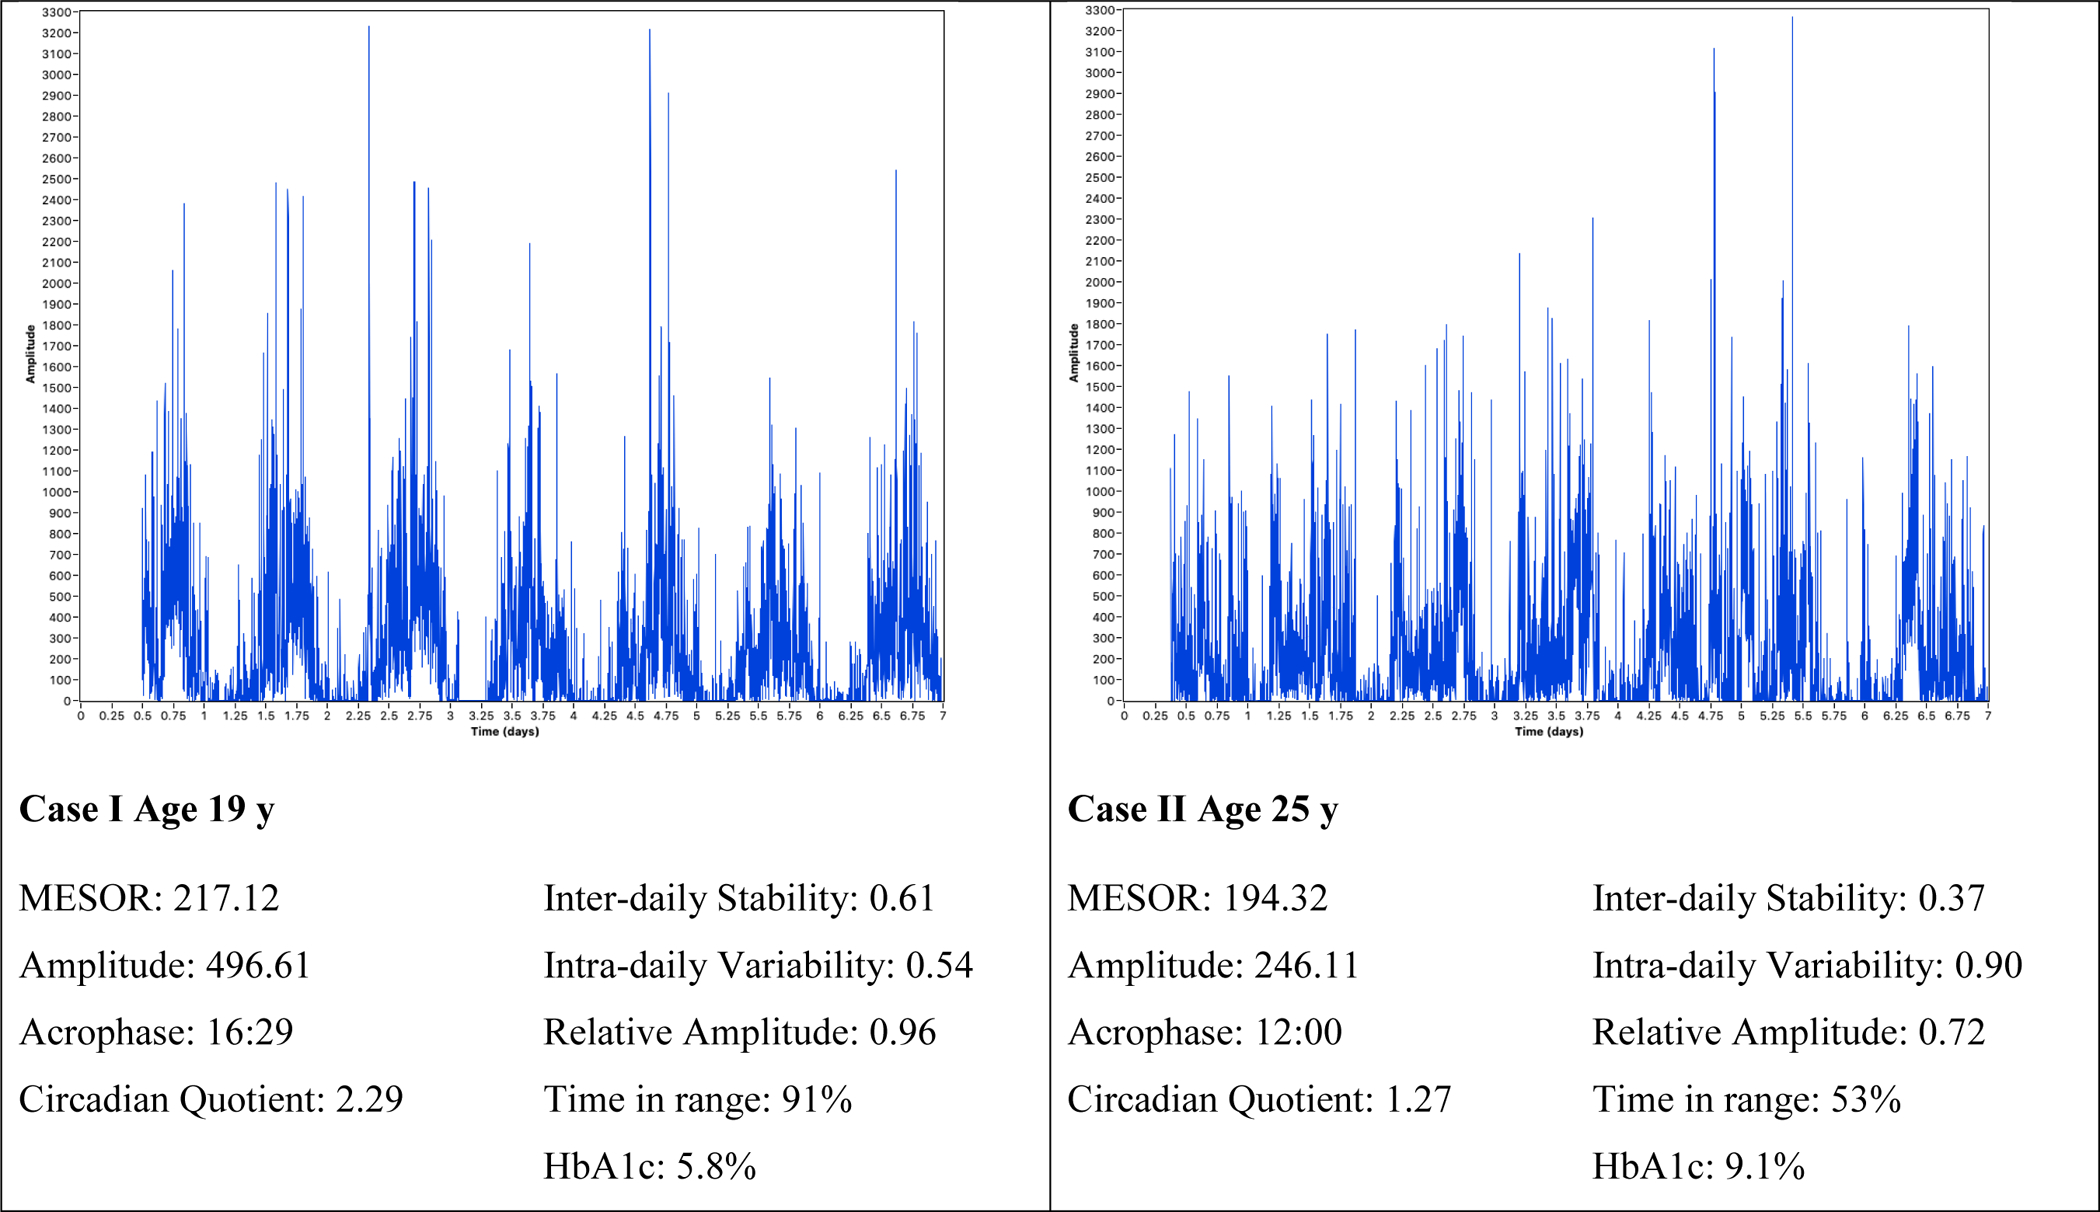
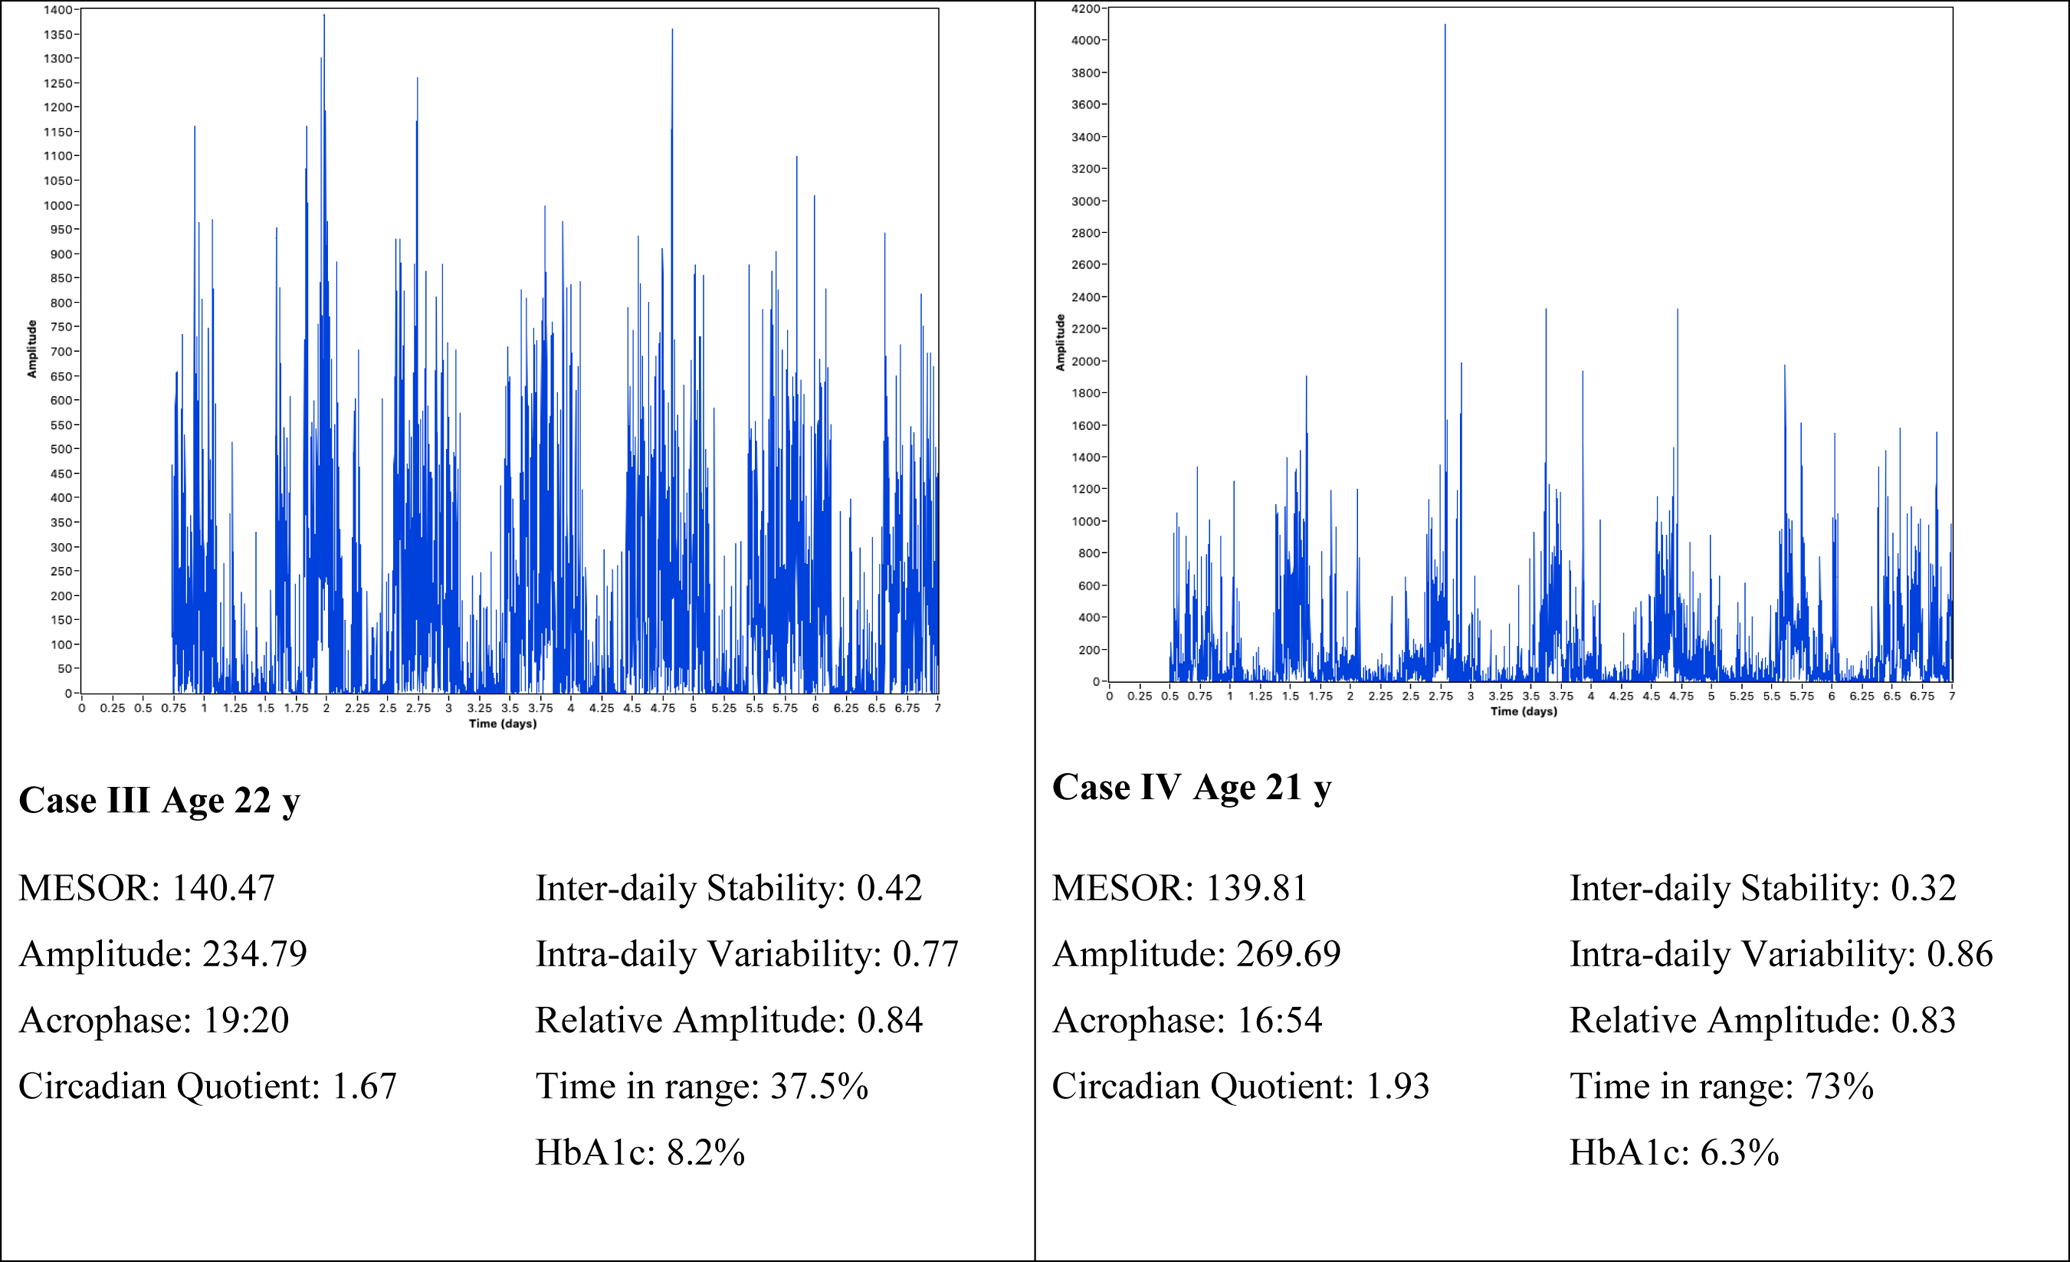
Samples of Rest-activity Patterns with Circadian Rhythm and Glucose Characteristics.
Note: Time in range was 70–180mg/dL measured via continuous glucose monitor
The associations for circadian parameters (interdaily stability, intradaily variability, relative amplitude, and circadian quotient), sleep-wake characteristics (objective and self-report), executive function, and glycemia are presented in Table 2. The association between interdaily stability and GRADE Hyperglycemia is presented in Figure 2. A more robust rhythm (higher circadian quotient) was associated with longer total sleep time (r = 0.64, p = .000) and less daytime sleepiness.
Table 2.
Bivariate Associations between Circadian Characteristics, Sleep-Wake Characteristics, Executive Function, and Glycemia (N = 46)
| Inter-daily Stability r (p-value) |
Intra-daily Variability r (p-value) |
Relative Amplitudea rho (p-value) |
Circadian Quotient r (p-value) |
|
|---|---|---|---|---|
| Objective sleep-wake characteristic | ||||
| Total sleep time | 0.35 (.018) | −0.21 (.170) | 0.41 (.005) | 0.64 (.000) |
| Self-report sleep-wake characteristic | ||||
| Daytime sleepiness | −0.30 (.042) | −0.30 (.842) | −0.28 (.056) | −0.41 (.004) |
| Executive function | ||||
| Trail Making Test | −0.35 (.027) | −0.02 (.910) | −0.22 (.140) | −0.11 (.454) |
| Glycemia | ||||
| GRADE hypoglycemiaa | 0.33 (.033) | −0.23 (.138) | 0.43 (.004) | 0.17 (.272) |
| GRADE hyperglycemia | −0.33 (.032) | −0.15 (.343) | −0.12 (.461) | 0.05 (.758) |
| % Time in range 70–180mg/dL | −0.02 (.918) | −0.27 (.079) | 0.12 (.461) | −0.05 (.755) |
| % Time spent below 54 mg/dLa | 0.32 (.037) | −0.23 (.140) | 0.33 (.028) | −0.12 (.455) |
Note. Bolded values are significant. Abbreviations: GRADE, glycemic risk assessment diabetes equation;
Spearman correlations were used for these variables.
Figure 2.
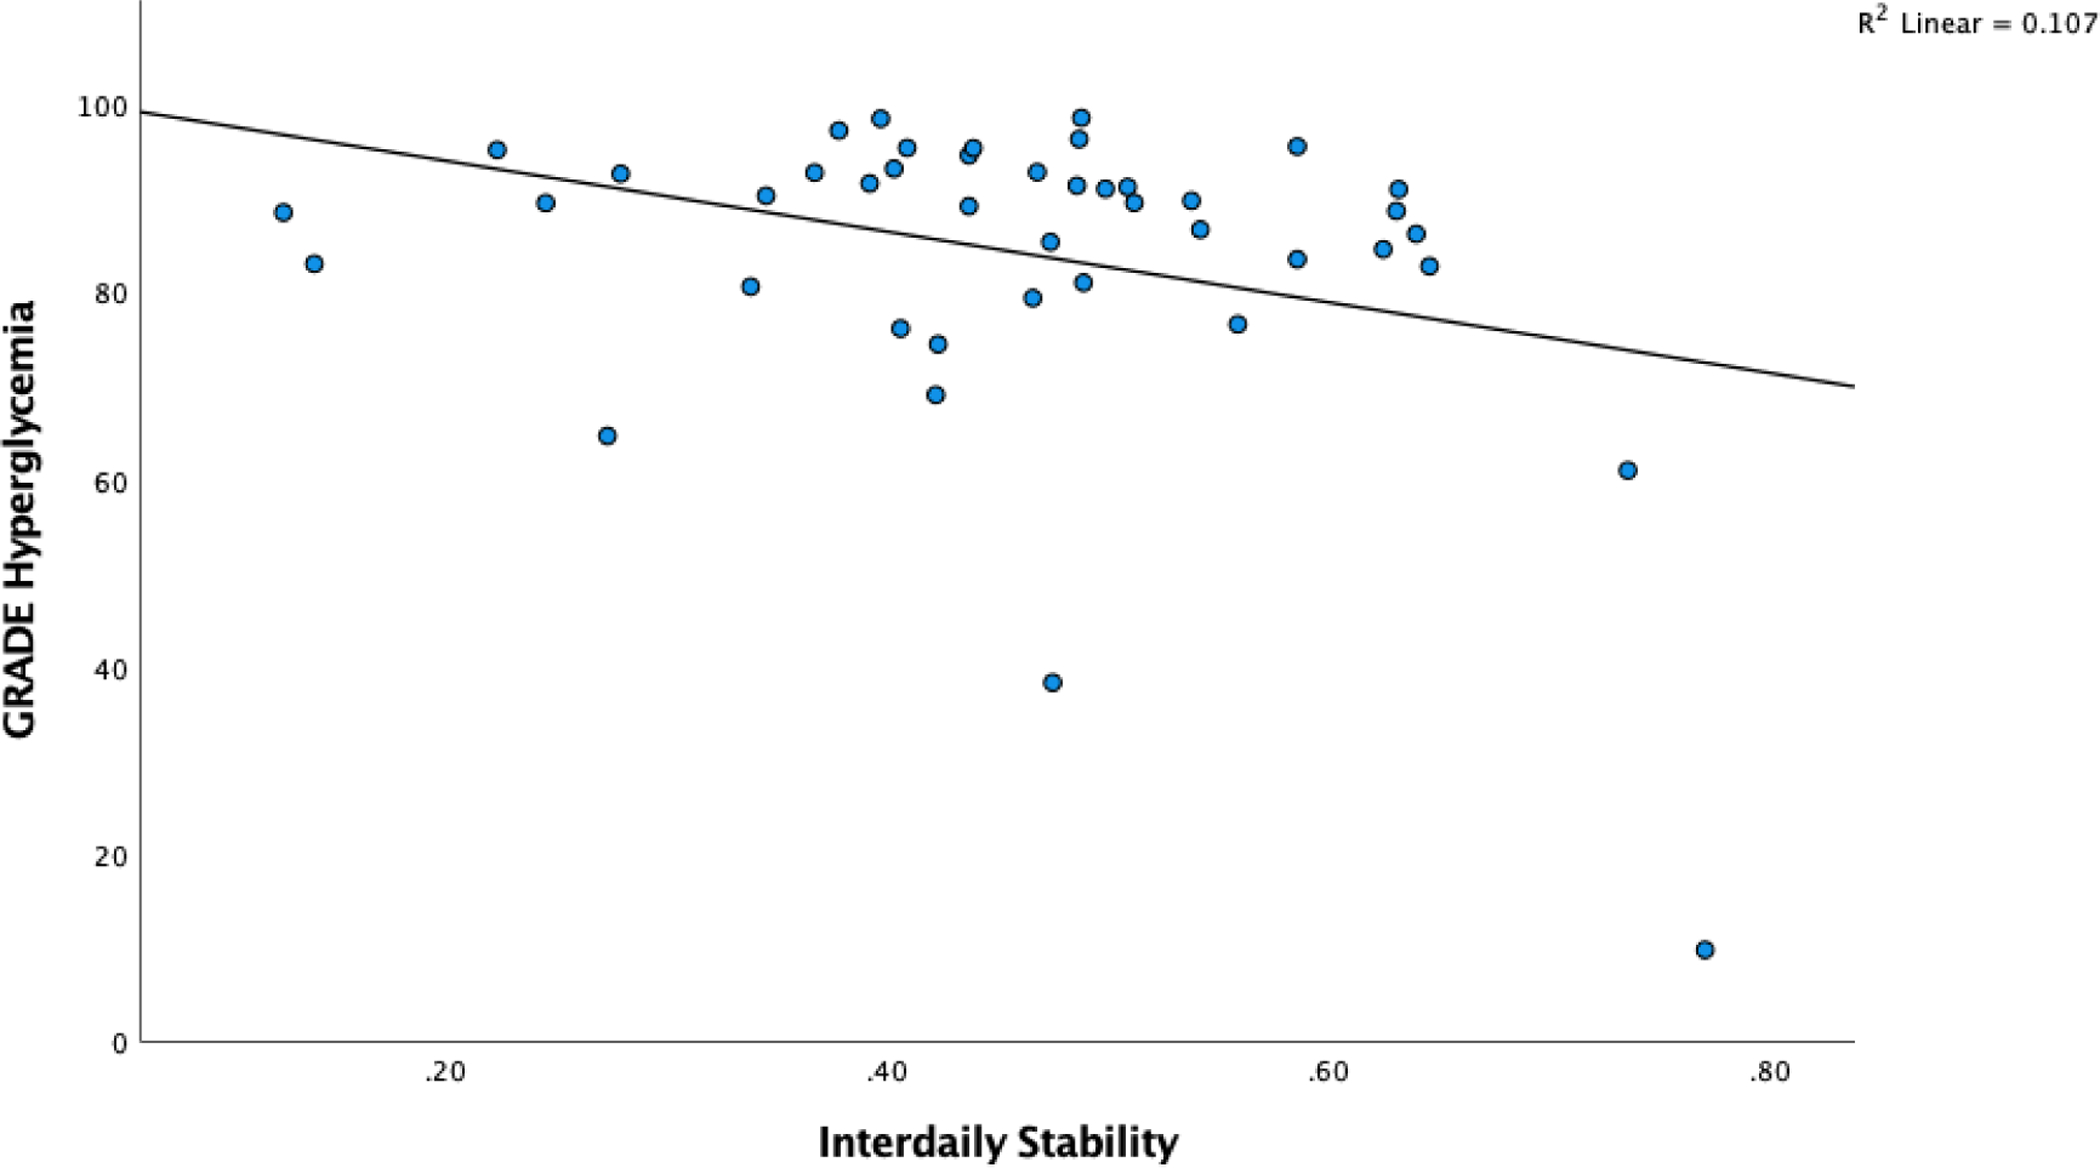
Scatterplot of Interdaily Stability and Glucose Variability (GRADE Hyperglycemia)
Stronger rhythm adherence (higher IS) was associated with longer total sleep time, less self-reported daytime sleepiness, better executive function, less hyperglycemia risk, but more time spent in hypoglycemia and greater hypoglycemia risk (all p < .05) (Table 2). A more robust rest-activity rhythm (higher relative amplitude) was associated with a longer total sleep time and more time spent in hypoglycemia as well as a higher hypoglycemia risk (all p < .05).
The contributions of IS and total sleep time to executive function (trail making test), daytime sleepiness, and glucose fluctuations after controlling for covariates (T1D duration, sex, and BMI) are presented in Table 3. Stronger rhythm adherence (higher IS) was associated with better executive function (p = .035) and explained 19.3% of the variance. Total sleep time and the other covariates (T1D duration, sex, nor BMI) did not explain variance in the executive function model. Shorter total sleep time and sex contributed to 38.8% of the variance in daytime sleepiness and IS was no longer significant when these variables were controlled for. The association between IS and hyperglycemia risk was no longer significant when total sleep time was added to the model and there was a trend though not statistically significant (p = .058) between a longer total sleep time and less hyperglycemia risk contributing to 23.24% of the variance. Longer T1D duration was associated with more hypoglycemia risk contributing to 23% of the variance and IS was no longer significant when this covariate was added to the model. Similarly, IS was no longer significant when T1D duration was added to the model and there was a trend between a longer duration of T1D and time spent in hypoglycemia (<54mg/dL) accounting for 15.29% of the variance.
Table 3.
Contributions of inter-daily stability and total sleep time to executive function, sleepiness and glucose variability (Regression Model)
| Predictors | Outcome Variables | ||||
|---|---|---|---|---|---|
| Executive Function and Sleepiness | Glucose Variability | ||||
| Executive Function | Epworth sleepiness | GRADE Hyperglycemia | GRADE Hypoglycemiaa | Time spent below 54mg/dLa | |
| B±SE (p-value) | B±SE (p-value) | B±SE (p-value) | B±SE (p-value) | B±SE (p-value) | |
| Inter-daily stability | −21.88±10.00 (.035) | −3.87±3.19 (.233) | −19.93±14.08 (.166) | 2.61±2.16 (.234) | 3.92±5.45 (.477) |
| Total sleep time | 0.01±0.02 (.581) | −0.02±0.01 (.001) | 0.06±0.13 (.058) | −0.00±0.01 (.834) | 0.004±0.01 (.759) |
| Covariates | |||||
| T1D Duration | −0.37±0.24 (.128) | −0.03±0.08 (.667) | −0.53±0.32 (.103) | 0.13±0.05 (.014) | 0.26±0.13 (.051) |
| Sex | 0.17±2.89 (.953) | 2.77±0.91 (.004) | 5.53±3.70 (.143) | −0.59±0.60 (.332) | −1.34±1.52 (.384) |
| BMI | 0.06±0.32 (.859) | −0.04±0.10 (.728) | 0.71±0.46 (.126) | −0.10±0.07 (.153) | −0.17±0.18 (.359) |
Note. B is the unstandardized coefficients.
Variable was natural log transformed. Glucose variability indices: GRADE, glycemic risk assessment diabetes equation. Bolded values are significant p < .05.
Discussion
To our knowledge, this is the first study to characterize the rhythmic characteristics, including nonparametric parameters among young adults with T1D, along with executive function, daytime sleepiness, and glucose fluctuations. A number of parametric associations were observed between a stronger rhythm, better objective sleep-wake characteristics, and less daytime sleepiness. Nonparametric circadian parameters were significantly associated with several diabetes outcomes: a stronger rhythm adherence (higher interdaily stability) with better objective sleep-wake characteristics, better executive function, lower diabetes distress, less hyperglycemia risk, and more time spent in hypoglycemia/hypoglycemia risk; and a more robust rhythm (higher relative amplitude) with better objective sleep-wake characteristics and more time spent in hypoglycemia/higher hypoglycemia risk.
The findings from the current study build on previous studies in T1D and in other populations. Findings in the current study were similar to a previous study where strong coupling between rest-activity rhythms and glucose were observed in young adults with T1D (Farabi et al., 2017). It was expected, but novel to find that a stronger rhythm (higher IS) was directly associated with a lower risk of hyperglycemia. However, it was unexpected to observe that a higher IS was associated with more time spent in hypoglycemia and a higher hypoglycemia risk although the relationship was no longer significant when T1D duration was added to the model suggesting that a longer duration of diabetes explains a portion of the variance in this relationship. The importance of achieving glycemic targets to prevent or delay microvascular and macrovascular complications in T1D was demonstrated in The Diabetes Control and Complications Trial, but this does come at a 3-fold increase in the frequency of severe hypoglycemia and has been more difficult to achieve in adolescent and young adult populations with T1D (Nathan & Group, 2014). More fragmented and less robust circadian rhythms were associated with greater depressive symptoms (Murray et al., 2019; Smagula et al., 2015) and stronger rhythms with less fatigue in the general population (Berger & Farr, 1999). Mesor, amplitude, and relative amplitude were similar to adults without chronic conditions (Mitchell et al., 2017); however, the current sample had less interdaily stability, but their intradaily variability numbers on average were better (IS = 0.43, IV = 0.82 vs. IS = 0.59, IV = 0.97 compared to same age peers) (Huang et al., 2002).
Monitoring over a longer period of time is needed to determine the extent to which rest-activity rhythms predict glycemia over times longer than a fortnight, including unanticipated events or activities and capture other important diabetes outcomes (e.g., emotional distress and executive function) and to facilitate the understanding of temporal ordering. Melatonin is an important determinant of circadian rhythmicity, yet synthesis of melatonin was found to be impaired in rat models of diabetes both in vivo and in vitro and adults with T1D during periods of high blood glucose concentrations in a recent study (Amaral et al., 2014). There is growing evidence of a relationship between melatonin, diabetes, and metabolic syndrome whereby variation in gene encoding the melatonin receptor 1b (MTNR1B) appears to be involved in impaired insulin secretion and ineffective glucose metabolism in humans (Bouatia-Naji et al., 2009; Prokopenko et al., 2009). Additionally, melatonin supplementation reduced both hyperglycemia and hyperlipidemia and improved the antioxidant status in rats with diabetes (Montilla et al., 1998; Nishida, Segawa, Murai, & Nakagawa, 2002). The role of variation in melatonin rhythm with glucose fluctuations and exogenous lighting and other zeitgebers as well as the rest activity rhythm should be examined in this population.
The intrinsic circadian period of 24 hours in adults varies requiring a daily adaptation (e.g., phase resetting) to be equal to ~24 hours – a majority require a phase-advance and a few require a phase delay (Chang et al., 2012; Duffy et al., 2011). Interventions focused on manipulating rest-activity rhythms (e.g., timed bright light, timing of meals, increased physical activity, regular bedtimes, and/or melatonin) accounting for phase resetting may improve diabetes outcomes. Rest-activity interventions (timed or natural light exposure and melatonin) have resulted in reduced depressive symptoms and improved sleep in young adults without chronic conditions (Savides, Messin, Senger, & Kripke, 1986); however, these have not been examined among those with T1D.
There are several points for emphasis of strengths and potential weaknesses. First, the sample is well characterized with several days (6–14) of concurrent actigraphic and CGM (to capture weekday and weekend differences) and objective executive function data for the analyses. The use of nonparametric methods used in the current study seemed to better capture rhythm fragmentation and synchronization which is more appropriate for those with chronic conditions allowing for new insights into the rest-activity rhythm-glucose association. Also, while no formal testing was conducted, those with a previous OSA diagnosis and those screened with a high-risk tool which has a high negative predictive value for sleep apnea, were screened out for exclusion, reducing but not eliminating an independent impact of abnormal rates of sleep disordered breathing on glycemia. The availability of 6 days for some participants may have limited the ability to fully assess interdaily stability and intradaily variability over a longer period of time (e.g., two full weeks) to observe a rest-activity and glucose pattern. The study was cross sectional and data on physical activity, including lifestyle, diet, melatonin, insulin, or other hormones (growth hormone, cortisol, etc.) were not collected. Although light exposure data were collected and were not associated with any of the variables of interest it is possible that all light data were not fully captured by the wrist actigraph. Given recently published reports, future studies that include melatonin concentration, clock gene expression data, and melatonin receptor genotype may be warranted. Additionally, controlling for and monitoring hormonal, dietary, and insulin treatment effects over a longer period of time, capturing more than one or two weeks, may provide further insight into the findings presented here.
Important associations between rest-activity rhythms, executive function, and clinically relevant glucose fluctuation indices were present among young adults with T1D. Future approaches may be developed to better investigate which mechanisms are involved in rest-activity rhythms in T1D, also considering the influence of circadian glucose variations throughout the day on the coupling of the rest-activity rhythm to zeitgeber and rhythm fragmentation, i.e. coherence analysis. These data give insight into the design of experimental studies to evaluate causal relationships among circadian profiles and diabetes outcomes among young adults with T1D.
Declarations of financial support:
This material is based upon work partially supported by the American Academy of Sleep Medicine Foundation (AASM), 220-BS-19, and the National Institute for Nursing Research (NINR), K99NR018886. Any opinions, findings, and conclusions, or recommendations expressed in this publication are those of the author(s) and do not necessarily reflect the views of the AASM Foundation or NIH. SG was previously funded by NINR T32NR0008346, and Sigma Theta Tau International provided research support for the study. Dexcom provided continuous glucose monitors (G4) free of charge to be used in the study for participants who did not have a device.
Footnotes
Conflict of interest: The authors report no potential competing interest.
Contributor Information
Stephanie Griggs, Case Western Reserve University, Frances Payne Bolton School of Nursing, Cleveland, OH 44106.
Kingman P. Strohl, Case Western Reserve University, School of Medicine, Cleveland, OH 44106.
Margaret Grey, Yale University, School of Nursing and School of Medicine, West Haven, Connecticut 06477.
Eric Barbato, Case Western Reserve University, Department of Genetics and Genome Sciences, School of Medicine, Cleveland, OH 44106.
Seunghee Margevicius, Case Western Reserve University, Department of Population and Quantitative Health Sciences, Case Comprehensive Cancer Center, School of Medicine, Cleveland, OH 44106.
Ronald L. Hickman, Jr, Case Western Reserve University, Frances Payne Bolton School of Nursing, Cleveland, OH 44106.
References
- Amaral FG, Turati AO, Barone M, Scialfa JH, do Carmo Buonfiglio D, Peres R, … Cipolla-Neto J (2014). Melatonin synthesis impairment as a new deleterious outcome of diabetes-derived hyperglycemia. J Pineal Res, 57(1), 67–79. doi: 10.1111/jpi.12144 [DOI] [PubMed] [Google Scholar]
- Ancoli-Israel S, Clopton P, Klauber MR, Fell R, & Mason W (1997). Use of wrist activity for monitoring sleep/wake in demented nursing-home patients. Sleep, 20(1), 24–27. [DOI] [PMC free article] [PubMed] [Google Scholar]
- Ancoli-Israel S, Klauber MR, Jones DW, Kripke DF, Martin J, Mason W, … Fell R (1997). Variations in circadian rhythms of activity, sleep, and light exposure related to dementia in nursing-home patients. Sleep, 20(1), 18–23. [PubMed] [Google Scholar]
- Arsie MP, Marchioro L, Lapolla A, Giacchetto GF, Bordin MR, Rizzotti P, & Fedele D (2000). Evaluation of diagnostic reliability of DCA 2000 for rapid and simple monitoring of HbA1c. Acta Diabetologica, 37(1), 1–7. [DOI] [PubMed] [Google Scholar]
- Backhaus J, Junghanns K, Broocks A, Riemann D, & Hohagen F (2002). Test–retest reliability and validity of the Pittsburgh Sleep Quality Index in primary insomnia. J Psychosom Res, 53(3), 737–740. [DOI] [PubMed] [Google Scholar]
- Baron KG, & Reid KJ. (2014). Circadian misalignment and health. Int Rev Psychiatry, 26(2), 139–154. doi: 10.3109/09540261.2014.911149 [DOI] [PMC free article] [PubMed] [Google Scholar]
- Bass J, & Takahashi JS. (2010). Circadian integration of metabolism and energetics. Science, 330(6009), 1349–1354. doi: 10.1126/science.1195027 [DOI] [PMC free article] [PubMed] [Google Scholar]
- Berger AM, & Farr L (1999). The influence of daytime inactivity and nighttime restlessness on cancer-related fatigue. Oncol Nurs Forum, 26(10), 1663–1671. [PubMed] [Google Scholar]
- Borel AL, Pepin JL, Nasse L, Baguet JP, Netter S, & Benhamou PY. (2013). Short sleep duration measured by wrist actimetry is associated with deteriorated glycemic control in type 1 diabetes. Diabetes Care, 36(10), 2902–2908. doi: 10.2337/dc12-2038 [doi] [DOI] [PMC free article] [PubMed] [Google Scholar]
- Bouatia-Naji N, Bonnefond A, Cavalcanti-Proença C, Sparsø T, Holmkvist J, Marchand M, … Froguel P (2009). A variant near MTNR1B is associated with increased fasting plasma glucose levels and type 2 diabetes risk. Nat Genet, 41(1), 89–94. doi: 10.1038/ng.277 [DOI] [PubMed] [Google Scholar]
- Calogiuri G, Weydahl A, & Carandente F (2013). Methodological issues for studying the rest-activity cycle and sleep disturbances: a chronobiological approach using actigraphy data. Biol Res Nurs, 15(1), 5–12. doi: 10.1177/1099800411416224 [DOI] [PubMed] [Google Scholar]
- Cavalcanti-Ferreira P, Berk L, Daher N, Campus T, Araujo J, Petrofsky J, & Lohman E (2018). A nonparametric methodological analysis of rest-activity rhythm in type 2 diabetes. Sleep Science, 11(4), 281–289. doi: 10.5935/1984-0063.20180044 [DOI] [PMC free article] [PubMed] [Google Scholar]
- Chang AM, Santhi N, St Hilaire M, Gronfier C, Bradstreet DS, Duffy JF, … Czeisler CA. (2012). Human responses to bright light of different durations. J Physiol, 590(13), 3103–3112. [DOI] [PMC free article] [PubMed] [Google Scholar]
- Cornelissen G (2014). Cosinor-based rhythmometry. Theor Biol Med Model, 11, 16. doi: 10.1186/1742-4682-11-16 [DOI] [PMC free article] [PubMed] [Google Scholar]
- Costanzo E, Juckett M, Coe C, Dickson D, Morris K, Hematti P, & Rumble M (2017). Inflammation, circadian rest-activity rhythms, and behavioral sequelae of chronic graft-versus-host disease. Brain Behav Immun, 66, e1. [Google Scholar]
- Czerwoniuk D, Fendler W, Walenciak L, & Mlynarski W (2011). GlyCulator: a glycemic variability calculation tool for continuous glucose monitoring data. J Diabetes Sci Technol, 5(2), 447–451. [DOI] [PMC free article] [PubMed] [Google Scholar]
- Donga E, van Dijk M, van Dijk JG, Biermasz NR, Lammers GJ, van Kralingen K, … Romijn JA. (2010). Partial sleep restriction decreases insulin sensitivity in type 1 diabetes. Diabetes Care, 33(7), 1573–1577. doi: 10.2337/dc09-2317 [doi] [DOI] [PMC free article] [PubMed] [Google Scholar]
- Dowling GA, Hubbard EM, Mastick J, Luxenberg JS, Burr RL, & Van Someren EJ. (2005). Effect of morning bright light treatment for rest-activity disruption in institutionalized patients with severe Alzheimer’s disease. Int Psychogeriatr, 17(2), 221–236. doi: 10.1017/s1041610205001584 [DOI] [PMC free article] [PubMed] [Google Scholar]
- Duffy JF, Cain SW, Chang AM, Phillips AJ, Münch MY, Gronfier C, … Czeisler CA. (2011). Sex difference in the near-24-hour intrinsic period of the human circadian timing system. Proc Natl Acad Sci U S A, 108 Suppl 3, 15602–15608. doi: 10.1073/pnas.1010666108 [DOI] [PMC free article] [PubMed] [Google Scholar]
- Eckel RH, Depner CM, Perreault L, Markwald RR, Smith MR, McHill AW, … Wright KP Jr. (2015). Morning circadian misalignment during short sleep duration impacts insulin sensitivity. Curr Biol, 25(22), 3004–3010. [DOI] [PubMed] [Google Scholar]
- Farabi SS, Carley DW, & Quinn L (2017). Glucose variations and activity are strongly coupled in sleep and wake in young adults with type 1 diabetes. Biol Res Nurs, 19(3), 249–257. doi: 10.1177/1099800416685177 [DOI] [PMC free article] [PubMed] [Google Scholar]
- Foster NC, Beck RW, Miller KM, Clements MA, Rickels MR, DiMeglio LA, … Smith E (2019). State of type 1 diabetes management and outcomes from the T1D Exchange in 2016–2018. Diabetes Technol Ther, 21(2), 66–72. doi: 10.1089/dia.2018.0384 [DOI] [PMC free article] [PubMed] [Google Scholar]
- Gaudino EA, Geisler MW, & Squires NK. (1995). Construct validity in the Trail Making Test: what makes Part B harder? J Clin Expe Neuropsychol, 17(4), 529–535. [DOI] [PubMed] [Google Scholar]
- Gonze D, Halloy J, & Goldbeter A (2002). Robustness of circadian rhythms with respect to molecular noise. Proc Natl Acad Sci U S A, 99(2), 673–678. doi: 10.1073/pnas.022628299 [DOI] [PMC free article] [PubMed] [Google Scholar]
- Griggs S, Redeker NS, Crawford SL, & Grey M (2020). Sleep, self-management, neurocognitive function, and glycemia in emerging adults with Type 1 diabetes mellitus: A research protocol. Res Nurs Health, 43(4), 317–328. doi: 10.1002/nur.22051 [DOI] [PMC free article] [PubMed] [Google Scholar]
- Griggs S, Hickman RL, Strohl KP, Redeker NS, Crawford SL, & Grey M (Forthcoming). Sleep-wake characteristics, daytime sleepiness, and glycemia in young adults with type 1 diabetes. J Clin Sleep Med. [DOI] [PMC free article] [PubMed] [Google Scholar]
- Grutsch JF, Wood PA, Du-Quiton J, Reynolds JL, Lis CG, Levin RD, … Hrushesky WJ. (2011). Validation of actigraphy to assess circadian organization and sleep quality in patients with advanced lung cancer. J Circadian Rhythms, 9, 4. doi: 10.1186/1740-3391-9-4 [DOI] [PMC free article] [PubMed] [Google Scholar]
- Huang YL, Liu RY, Wang QS, Van Someren EJ, Xu H, & Zhou JN. (2002). Age-associated difference in circadian sleep-wake and rest-activity rhythms. Physiol Behav, 76(4–5), 597–603. doi: 10.1016/s0031-9384(02)00733-3 [DOI] [PubMed] [Google Scholar]
- Johns MW. (1992). Reliability and factor analysis of the Epworth Sleepiness Scale. Sleep, 15(4), 376–381. [DOI] [PubMed] [Google Scholar]
- Kadono M, Nakanishi N, Yamazaki M, Hasegawa G, Nakamura N, & Fukui M (2016). Various patterns of disrupted daily rest-activity rhythmicity associated with diabetes. J Sleep Res, 25(4), 426–437. doi: 10.1111/jsr.12385 [DOI] [PubMed] [Google Scholar]
- Kovatchev BP, Patek SD, Ortiz EA, & Breton MD. (2015). Assessing sensor accuracy for non-adjunct use of continuous glucose monitoring. Diabetes Technol Ther, 17(3), 177–186. [DOI] [PMC free article] [PubMed] [Google Scholar]
- Laposky AD, Bass J, Kohsaka A, & Turek FW. (2008). Sleep and circadian rhythms: key components in the regulation of energy metabolism. FEBS Lett, 582(1), 142–151. doi: 10.1016/j.febslet.2007.06.079 [DOI] [PubMed] [Google Scholar]
- Larcher S, Gauchez AS, Lablanche S, Pepin JL, Benhamou PY, & Borel AL. (2016). Impact of sleep behavior on glycemic control in type 1 diabetes: the role of social jetlag. Eur J Endocrinol, 175(5), 411–419. doi: 10.1530/EJE-16-0188[doi] [DOI] [PubMed] [Google Scholar]
- Levin RD, Daehler MA, Grutsch JF, Quiton J, Lis CG, Peterson C, … Hrushesky WJ. (2005). Circadian function in patients with advanced non-small-cell lung cancer. Br J Cancer, 93(11), 1202–1208. doi: 10.1038/sj.bjc.6602859 [DOI] [PMC free article] [PubMed] [Google Scholar]
- Mitchell JA, Quante M, Godbole S, James P, Hipp JA, Marinac CR, … Kerr J (2017). Variation in actigraphy-estimated rest-activity patterns by demographic factors. Chronobiol Int, 34(8), 1042–1056. doi: 10.1080/07420528.2017.1337032 [DOI] [PMC free article] [PubMed] [Google Scholar]
- Monk TH, Reynolds CF, Kupfer DJ, Buysse DJ, Coble PA, Hayes AJ, … Ritenour AM. (1994). The Pittsburgh sleep diary. J Sleep Res, 3(2), 111–120. [PubMed] [Google Scholar]
- Montilla PL, Vargas JF, Túnez IF, Muñoz de Agueda MC, Valdelvira ME, & Cabrera ES. (1998). Oxidative stress in diabetic rats induced by streptozotocin: protective effects of melatonin. J Pineal Res, 25(2), 94–100. doi: 10.1111/j.1600-079x.1998.tb00545.x [DOI] [PubMed] [Google Scholar]
- Murray JM, Phillips AJ, Magee M, Sletten TL, Gordon C, Lovato N, … & Yu K (2019). Sleep regularity is associated with sleep-wake and circadian timing, and mediates daytime function in Delayed Sleep-Wake Phase Disorder. Sleep Med, 58, 93–101. doi: 10.1016/j.sleep.2019.03.009 [DOI] [PubMed] [Google Scholar]
- Nathan DM, & DCCT/EDIC Research Group. (2014). The diabetes control and complications trial/epidemiology of diabetes interventions and complications study at 30 years: overview. Diabetes Care, 37(1), 9–16. doi: 10.2337/dc13-2112 [DOI] [PMC free article] [PubMed] [Google Scholar]
- Netzer NC, Stoohs RA, Netzer CM, Clark K, & Strohl KP. (1999). Using the Berlin Questionnaire to identify patients at risk for the sleep apnea syndrome. Ann Intern Med, 131(7), 485–491. [DOI] [PubMed] [Google Scholar]
- Nishida S, Segawa T, Murai I, & Nakagawa S (2002). Long-term melatonin administration reduces hyperinsulinemia and improves the altered fatty-acid compositions in type 2 diabetic rats via the restoration of Delta-5 desaturase activity. J Pineal Res, 32(1), 26–33. doi: 10.1034/j.1600-079x.2002.10797.x [DOI] [PubMed] [Google Scholar]
- Prokopenko I, Langenberg C, Florez JC, Saxena R, Soranzo N, Thorleifsson G, … Abecasis GR. (2009). Variants in MTNR1B influence fasting glucose levels. Nat Genet, 41(1), 77–81. doi: 10.1038/ng.290 [DOI] [PMC free article] [PubMed] [Google Scholar]
- Rechenberg K, Griggs S, Jeon S, Redeker N, Yaggi HK, & Grey M (2020). Sleep and glycemia in youth with type 1 diabetes. J Pediatr Health Care. doi: 10.1016/j.pedhc.2019.12.002 [DOI] [PMC free article] [PubMed] [Google Scholar]
- Refinetti R, Cornélissen G, & Halberg F (2007). Procedures for numerical analysis of circadian rhythms. Biol Rhythm Res, 38(4), 275–325. [DOI] [PMC free article] [PubMed] [Google Scholar]
- Reutrakul S, Thakkinstian A, Anothaisintawee T, Chontong S, Borel A-L, Perfect MM, … Knutson KL. (2016). Sleep characteristics in type 1 diabetes and associations with glycemic control: systematic review and meta-analysis. Sleep Med, 23, 26–45. doi: 10.1016/j.sleep.2016.03.019 [DOI] [PMC free article] [PubMed] [Google Scholar]
- Rusu A, Bala C, Ciobanu D, Cerghizan A, & Roman G (2019). Sleep quality and sleep duration, but not circadian parameters are associated with decreased insulin sensitivity in Type 1 diabetes. Chronobiol Int, 36(8), 1148–1155. [DOI] [PubMed] [Google Scholar]
- Sack RL, Auckley D, Auger RR, Carskadon MA, Wright KP Jr., Vitiello MV, … American Academy of Sleep, M. (2007). Circadian rhythm sleep disorders: part I, basic principles, shift work and jet lag disorders. An American Academy of Sleep Medicine review. Sleep, 30(11), 1460–1483. [DOI] [PMC free article] [PubMed] [Google Scholar]
- Saeedi P, Petersohn I, Salpea P, Malanda B, Karuranga S, Unwin N, … & IDF Diabetes Atlas Committee. (2019). Global and regional diabetes prevalence estimates for 2019 and projections for 2030 and 2045: Results from the International Diabetes Federation Diabetes Atlas, 9. Diabetes Res Clin Pract, 157, 107843. doi: 10.1016/j.diabres.2019.107843 [DOI] [PubMed] [Google Scholar]
- Savides TJ, Messin S, Senger C, & Kripke DF. (1986). Natural light exposure of young adults. Physiol Behav, 38(4), 571–574. doi: 10.1016/0031-9384(86)90427-0 [DOI] [PubMed] [Google Scholar]
- Smagula SF, Ancoli-Israel S, Blackwell T, Boudreau R, Stefanick ML, Paudel ML, … Osteoporosis Fractures in Men (MrOS) Research Group. (2015). Circadian rest-activity rhythms predict future increases in depressive symptoms among community-dwelling older men. Am J Geriatr Psychiatry, 23(5), 495–505. doi: 10.1016/j.jagp.2014.06.007 [DOI] [PMC free article] [PubMed] [Google Scholar]
- Suh S, & Kim JH. (2015). Glycemic variability: how do we measure it and why is it important? Diabetes Metab J, 39(4), 273–282. [DOI] [PMC free article] [PubMed] [Google Scholar]
- Wagner J, Tennen H, & Wolpert H (2012). Continuous glucose monitoring: a review for behavioral researchers. Psychosom Med, 74(4), 356–365. doi: 10.1097/PSY.0b013e31825769ac [doi] [DOI] [PMC free article] [PubMed] [Google Scholar]
- Wagner S, Helmreich I, Dahmen N, Lieb K, & Tadić A (2011). Reliability of three alternate forms of the trail making tests a and B. Arch Clin Neuropsychol, 26(4), 314–321. [DOI] [PubMed] [Google Scholar]
- Wilmot EG, Choudhary P, Leelarathna L, & Baxter M (2019). Glycaemic variability: The under-recognized therapeutic target in type 1 diabetes care. Diabetes Obes Metab. doi: 10.1111/dom.13842 [DOI] [PMC free article] [PubMed] [Google Scholar]
- Witting W, Kwa IH, Eikelenboom P, Mirmiran M, & Swaab DF. (1990). Alterations in the circadian rest-activity rhythm in aging and Alzheimer’s disease. Biol Psychiatry, 27(6), 563–572. doi: 10.1016/0006-3223(90)90523-5 [DOI] [PubMed] [Google Scholar]
- Zuurbier LA, Luik AI, Hofman A, Franco OH, Van Someren EJ, & Tiemeier H (2015). Fragmentation and stability of circadian activity rhythms predict mortality: the Rotterdam study. Am J Epidemiol, 181(1), 54–63. doi: 10.1093/aje/kwu245 [DOI] [PubMed] [Google Scholar]