

Abstract
The FOXP3+CD4+ regulatory T (Treg) cells located in non-lymphoid tissues differ in phenotype and function from their lymphoid organ counterparts. Tissue-Treg cells have distinct transcriptomes, T cell receptor repertoires and growth and survival factor dependencies that arm them to survive and operate in their home tissue. Their functions extend beyond immune surveillance to tissue homeostasis, including regulation of local and systemic metabolism, promotion of tissue repair and regeneration, and control of the proliferation, differentiation and fate of non-lymphoid-cell progenitors. Treg cells in diverse tissues share a common FOXP3+CD4+ precursor located within lymphoid organs. This precursor undergoes definitive specialization once in the home tissue, following a multi-layered array of common and tissue-distinct transcriptional programs. Our deepening knowledge of tissue-Treg-cell biology will inform ongoing attempts to harness them for precision immunotherapeutics.
INTRODUCTION
Since their molecular definition in the early 2000s 1–3, the impressive power of FOXP3+CD4+ regulatory T (Treg) cells has been increasingly appreciated. These cells initially garnered attention as regulators of other T cells’ activities but eventually were recognized to control the responses of most innate and adaptive immunocyte types. For a decade, almost all studies on FOXP3+CD4+ T cells focused on those circulating through the blood and peripheral lymphoid organs but, more recently, unique populations of Treg cells have been discovered in a diversity of non-lymphoid tissues, opening our eyes to the true breadth of Treg-cell phenotypic and functional diversity.
This Review focuses on the Treg populations in non-lymphoid tissues, which we term tissue Treg cells. We discuss tissue-Treg-cell phenotypic heterogeneity, highlighting three examples of specific interest; tissue Treg-cell functions, with an emphasis on their roles in tissue homeostasis rather than immunity; the cellular derivation and molecular diversification of tissue Treg cells; and, finally, a set of issues imperative to address.
Tissue-Treg-cell phenotypic heterogeneity
A few reports of Treg populations functioning in non-lymphoid tissues did emerge during the beginning years of Treg-cell research 4. However, the notions that non-lymphoid tissues harbor unique populations of Treg cells adapted to survive and operate in their home tissue and that the purview of these cells extends beyond dealing with infections to assuring tissue homeostasis were not advanced until 2009, with the discovery of visceral adipose tissue (VAT) Treg cells 5. Subsequently, tissue Treg cells with unique phenotypes have been identified at a multiplicity of sites, including the skeletal muscle 6, skin 7, colonic lamina propria 8, cardiac muscle 9, lungs 10, liver 11 and central nervous system (CNS)12. To provide a flavor of the phenotypic heterogeneity exhibited by tissue Treg cells, we begin with vignettes of three particular tissue Treg populations, each chosen to illustrate a specific point of interest.
VAT Treg cells
Adipose tissue is a loose connective tissue made up of adipocytes and a complex stromal vascular fraction that includes pre-adipocytes, diverse stromal cell types, vascular endothelial cells, sympathetic nerves and a multiplicity of immunocyte types 13 (Fig. 1). Fat depots occur throughout the body, for example, surrounding internal organs (VAT); around the neck, especially in neonates (brown adipose tissue (BAT)); beneath the skin (subcutaneous adipose tissue (SAT)); and embedded within certain tissues, such as the bone marrow, liver and skeletal muscle. The three major adipocyte classes — white adipocytes , beige and brown adipocytes — have different developmental origins, distributions within the body and functions. The Treg cells operating in VAT merit special attention because they were the first tissue-distinct Treg population to be identified and are the one we presently know most about.
Figure 1: Visceral adipose tissue biology and regulatory T cells.
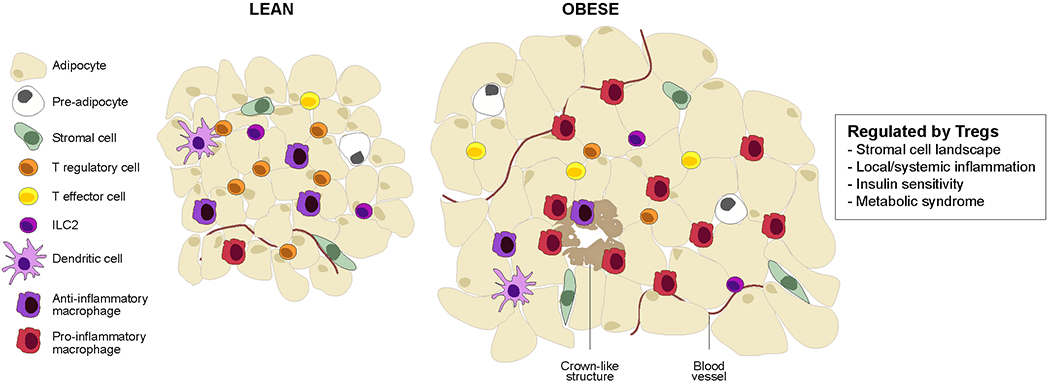
Schematic of the epidydimal fat pad of “middle-aged” lean versus obese mice. This visceral adipose tissue (VAT) depot, mostly composed of white-adipose cells, hosts a panoply of resident and recruited innate and adaptive immunocytes. Genetic or diet-induced obesity is associated with chronic, low-grade inflammation that entails secretion of inflammatory cytokines (notably, tumor necrosis factor (TNF), IL-1, IL-6 and interferons) as well as accumulation of inflammatory leukocytes, especially pro-inflammatory macrophages. Inflammation of VAT depots promotes type-2 diabetes and other features of the metabolic syndrome, including insulin resistance, fatty liver disease and heart disease. ILC, innate lymphocyte cell.
The epididymal VAT depot of lean, “middle-aged” mice harbors a unique population of FOXP3+CD4+ T cells5. These cells begin to accrue at 3-4 months of age and continue to do so until they constitute the large majority of CD4+ T cells by 5-7 months. They do not accumulate in other VAT depots, nor in SAT 5,14. Treg cells reside in the spaces between adipocytes, often where several of them intersect, a site where macrophages, dendritic cells (DCs) and other leukocytes also tend to aggregate 5,15. In genetically or diet-induced models of obesity, VAT-Treg cells are strikingly reduced and are more concentrated in “crown-like” structures at multi-adipocyte junctures 5. Such changes were the first clue that VAT-Treg cells are important regulators of local and systemic metabolism. Their distinct transcriptome, T cell receptor (TCR) repertoire and set of growth and survival factor dependencies arm VAT-Treg cells for this specialized function.
Transcriptome.
The VAT.-.Treg-cell transcriptome is strikingly different from those of its lymphoid organ counterparts 5, with thousands of transcripts being upregulated or downregulated according to recent RNA sequencing (RNA-seq) data 11. Enriched transcripts include those encoding transcription factors (TFs) (such as Pparg, Rora and Gata3), chemokines and their receptors (such as Cxcl2, Cxcr6, Ccr1 and Ccr2), cytokines and their receptors (such as Il10, Il5, Il1rl1 and Il9r), costimulatory molecules (such as Pdcd1, Ctla4 and Cd80) and, most interestingly, a set of molecules associated with lipid metabolism (such as Dgat and Cd36). The VAT Treg cell signature is largely driven by peroxisome proliferator-activated receptor-γ (PPARγ), the “master” transcriptional regulator of adipocyte differentiation 16. Mice lacking expression of PPARγ specifically in FOXP3+ cells have few T reg cells in VAT and the residual cells do not show the characteristic VAT-Treg-cell signature. By contrast, animals treated with a PPARγ agonist have an expanded VAT, but not splenic, Treg-cell compartment.
TCR repertoire.
Like most CD4+ αβ T cells, T reg cells from mouse lymphoid organs are highly polyclonal, repeated TCR usage being very rare except in old mice or in individuals undergoing an immune response. By contrast, the VAT-Treg-cell compartment exhibits a much more constrained TCR repertoire, with each mouse showing multiple private clonal expansions 5,15. Such clones argue that VAT Treg cells are responding to one or more local antigens.
Accumulation of VAT Treg cells within the epididymal fat depot depends on TCR recognition of peptide–MHC class II complexes displayed by local antigen-presenting cells 15,17. The critical importance of TCR specificity is best illustrated by recent findings using a transgenic mouse model wherein the TCR repertoire is highly skewed for a particular VAT-Treg-cell specificity: these mice have an over-abundance of FOXP3+CD4+ T cells in epididymal VAT but not elsewhere; and transfer of splenic FOXP3+CD4+ T cells from these mice into non-transgenic recipients results in accumulation of the transferred cells specifically in epididymal VAT 14. Moreover, potent mimotopes capable of stimulating these TCR-transgenic Treg cells were recently identified and used to improve insulin sensitivity in an adoptive-transfer system 17.
Growth and survival factors.
Unexpectedly, VAT enrichment of the above-mentioned TCR-transgenic Treg cells also requires FOXP3 expression 14, perhaps reflecting a need for chemokine or adhesion receptors, the expression of which is regulated by this TF. Indeed, transcripts encoding many chemokine receptors are differentially transcribed in VAT.Treg cells compared with lymphoid-organ Treg cells 5, a profile that changes with obesity 18.
As is typical of FOXP3+CD4+ T cells, VAT.Treg cells are IL-2 dependent. They express high levels of CD25 and proliferate upon in vitro incubation with IL-2 or in vivo injection of obese mice with IL-2–anti-IL-2 complexes 5,19. However, in contrast to those in lymphoid organs, Treg cells in VAT respond much more strongly to IL-33 15,19,20. Not surprisingly, then, most VAT.Treg cells express high levels of the IL-33 receptor, ST2, gradually increasing to >80% of the population at 30 weeks of age, in comparison with <10% of splenic Treg cells. The importance of IL-33 signaling for VAT-Treg-cell accumulation was solidified by results from lean mice with a constitutive knockout of either IL-33 or ST2 expression, both of which show a strong reduction in VAT T reg cells but not lymphoid-organ Treg cells 15,19. Initially there was disagreement over whether the IL-33 effect on VAT-Treg cells is a direct one because mice engineered to lack ST2 on group 2 innate lymphoid cells (ILC2s) showed a reduction in both FOXP3+CD4+ T cells and ILC2s in VAT21,22. However, studies of both mixed bone marrow chimeras 19 and Treg-cell-specific ST2-deficient mice 14 have demonstrated a Treg-cell-intrinsic effect. IL-33 directly impacts VAT Treg cells by inducing their proliferation and modifying their transcriptional programs 19,23. The current consensus is that Treg cells and ILC2s in VAT collaborate to carry out the functions of IL-33, which is consistent with the substantial transcriptional overlap these two cell types exhibit 22. Collaboration between ILC2s and Treg cells has been reported to operate via ICOSL–ICOS 21 and/or OX40L–OX40 22 interactions and to be inhibited by IFNγ 21.
The importance of IL-33 for VAT-Treg-cell homeostasis has inspired several investigators to identify its major cellular source(s) in the mouse epididymal fat depot 15,23–28. Imaging and single-cell RNA sequencing (scRNA-seq) revealed that cells of phenotype CD45−CD31−PDGFRα/PDPN+SCA1+ are the major IL-33 producers in lean mice. Consistent with this designation, mice lacking IL-33 expression specifically in PDGFRα+ cells have a significantly reduced VAT.Treg population 25. This stromal cell population is heterogeneous in lean mice, composed of three or four IL-33+ subtypes that may be either mesothelial or mesenchymal in nature 25,27. Many of the IL-33+ cells are found within a ring of connective tissue at the circumference of the depot, presumably the mesothelium 29. Others are located in the interior of the depot – often, but not always, in close association with blood vessels and/or neurons. IL-33+ stromal cells, in particular certain subtypes, increase with age 25, in males versus females 23,25 and in response to a long-term challenge with a high-fat diet (HFD) 25.
In humans.
Essentially all of the findings mentioned above pertain to mice. In considering data on the human VAT-Treg-cell compartment — as well as on human Treg populations in other non-lymphoid tissues — it is important to be aware of several differences in the two systems: greater genetic heterogeneity in humans than in the mice studied to date; more extensive and more heterogeneous environmental exposures in humans than in laboratory mice; molecular and cellular variations between the immune systems of the two species. Thus, one must ask to what extent human tissue-Treg cells should mimic their mouse counterparts even if they were to perform the same functions. In the particular case of VAT Treg-cells, differences in the sizes and locations of fat depots in the two species, and divergences in the relative contributions of the three adipocyte types to these depots, further confound the issue.
Nonetheless, Treg cells have been found in the omental fat depot of lean individuals, in fractions of the CD4+ T cell compartment higher than in human blood but lower than in lean mice 30,31. However, so little data are currently available that it is not possible to determine whether this difference reflects true biology or whether the analysis of human VAT has not yet been optimized — as concerns age, depot (for example, no reports on human epididymal VAT) and extraction conditions. As in mice, a negative correlation between body-mass index (BMI) and either FOXP3 transcript level 5,32 or Treg-cell representation 30 in VAT has repeatedly been observed. Some of the transcripts upregulated in mouse VAT Treg cells – such as Pparg, Ccr4, Prdm1 and Cxcl2 – are also augmented in their human counterparts 30. Strikingly different from mice, the IL-33 receptor, ST2, encoded by Il1rl1, was found to be absent from human VAT Treg cells by one group 30,33, although another has reported its expression 19. Again, the difference may be rooted in experimental details such as patient selection, choice of fat depot and/or the precise Treg-cell extraction procedure used. Alternatively, it may reflect true differences in cell surface markers of or functions exerted by VAT-Treg cells in the two species. It may be worth noting that variations in the VAT-Treg-cell compartments of different mouse strains have also recently been described 31.
Skeletal muscle Treg cells
Skeletal muscle, one of the largest vertebrate organs, is frequently injured due to its size, superficial location and vulnerability to mechanical stress. It undergoes regeneration in healthy individuals, in muscular dystrophies and in response to acute injury, for example after administration of the neurotoxin cardiotoxin (CTX). Damage to skeletal muscle initiates a highly orchestrated and stereotyped repair and regeneration program 34 (Fig. 2). The Treg population found in skeletal muscle merits a focused discussion because it highlights the important role local Treg cells can play in tissue repair and regeneration.
Figure 2: Skeletal muscle biology and regulatory T cells.
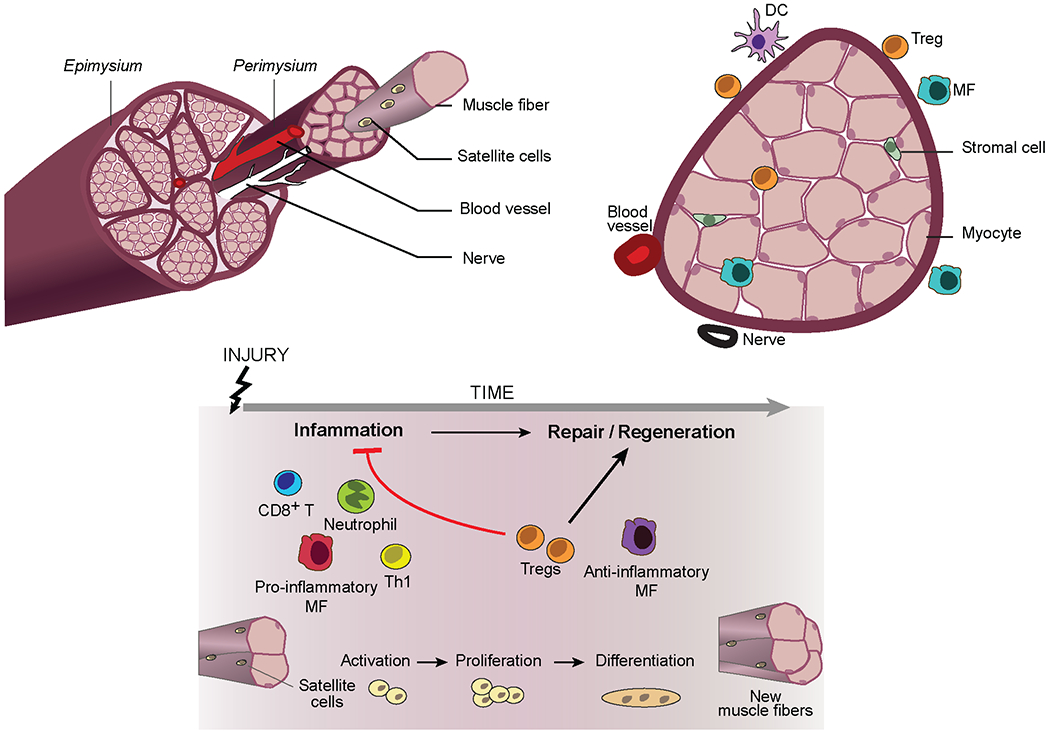
Schematic of hindlimb muscle from a young mouse (top) and its response to acute injury (bottom). Upon injury, mostly quiescent muscle progenitor cells (termed satellite cells) are activated, undergo asymmetric division, and differentiate into post-mitotic precursors, which then fuse to form multi-nucleated myotubes. Myotubes engender new myofibres or fuse to existing ones, followed by a stage of terminal differentiation and growth. This regenerative program is landmarked by a well-defined series of myogenic transcription factor changes. Both innate and adaptive immune-system cells positively or negatively regulate skeletal muscle regeneration. Neutrophils are the earliest of responders, followed by pro-inflammatory macrophagess, CD8+ T cells and T helper 1 (TH1) cells. This initial inflammatory response, which is a requirement for effective regeneration, is followed by a reparative stage dominated by anti-inflammatory macrophages and regulatory T (Treg) cells, both cell types essential for effective regeneration. DC, dendritic cell.
A population of Treg cells located in skeletal muscle was first reported in 2013 6. Uninjured hindlimb muscles of healthy young mice harbor a small Treg population 6,35,36, but it has proven difficult to study because of its small size. Subsequent to acute injury, the muscle Treg population rapidly expands, peaking around day 3 or 4, rapidly declining until about day 14, and tapering off thereafter, but remaining detectably elevated even a month after the injurious event 6,36. No changes are seen in the FOXP3+CD4+ populations of lymphoid organs or of control uninjured muscle in the same mice. In acutely injured muscle, Treg cells are located within the inflammatory lesion as well as between proximal muscle fibers. Increased Treg-cell levels are also a feature of the diaphragm and hindlimb muscles, but not lymphoid organs, of mouse models of Duchenne’s muscular dystrophy (DMD), that is, mdx or Dysf−/− mice 6,35. Muscle Treg cells are important regulators of tissue repair and regeneration after both acute and chronic injury. Their tissue-adapted transcriptome, TCR repertoire and growth and survival factor dependencies render them competent to perform their specialized tasks.
Transcriptome.
Skeletal muscle Treg cells have a distinct transcriptome, with thousands of transcripts increased or decreased in comparison with the transcriptomes of lymphoid-organ Treg cells 6,37,38. The muscle -Treg-cell-upregulated and downregulated gene signatures share many transcripts with the corresponding VAT-Treg-cell signatures, but each tissue-Treg-cell signature also has a private component. The most striking element of the muscle-Treg-cell upregulated gene signature is the preponderance of pathways related to cell cycle proliferation, which is consistent with the elevated proliferation rate of these cells 6,39. Muscle Treg cells are more similar to splenic Treg cells than are their VAT counterparts , a finding that concurs with the observation that the former but not the latter population communicates extensively with the circulating Treg-cell pool 39.
TCR repertoire,
Skeletal muscle Treg cells have a clonally expanded TCR repertoire in both acute and chronic injury settings 6. Almost all of the muscle Treg clones are private; however, one clone (or a conservative variant of it) was found in all 11 individuals examined 2 or 4 days after CTX-induced injury. In TCR-transgenic mice carrying this clone’s rearranged Tcra and Tcrb genes, FOXP3+CD4+, but not FOXP3−CD4+, T cells displaying the transgene-encoded TCR preferentially accumulate in injured hindlimb muscle in a TCR-dependent manner, both in the transgenic model and adoptive-transfer derivatives of it 38. These findings argue that muscle-Treg-cell recognition of a local antigen or antigens drives their specific accumulation within muscle.
Growth and survival factors.
Skeletal muscle Treg cells express a range of CD25 levels 6. Indeed, the muscle-Treg-cell compartment expands or contracts in response to injection of IL-2–anti-IL-2 complexes or anti-CD25, respectively, which improves or worsens, respectively, indices of muscle damage in the mdx model 6,35. But, just like their VAT counterparts, skeletal muscle Treg cells are much more responsive to IL-33 than to IL-2, a preference first discovered in the context of ageing 39. Ageing of skeletal muscle, like that of most mammalian tissues, is accompanied by a steady decline in function and regenerative capacity due at least in part to an age-associated decrease in satellite cell frequency and function 40. The Treg-cell compartment is strikingly diminished in CTX-injured skeletal muscle of old mice, reflecting defects in recruitment, proliferation and retention 39. In injured mice, both young and old, over half of the accumulating muscle, but not splenic, Treg cells express ST2. Treg-cell-specific loss of IL-33 signalling in young mice dampens Treg cell accumulation specifically in muscle but not spleen, likely at the level of local proliferation, and compromises muscle repair. The major IL-33-producers in skeletal muscle are mesenchymal stromal cells 25,39; there are fewer of these cells in aged mice and, consequently, less Il33 expression. Remarkably, co-injection of IL-33 and CTX into old mice augments the expanding muscle-Treg population and reverses the age-associated defect in muscle repair 39.
IL-33-producing muscle stromal cells are often found in close proximity to both large-fiber nerve bundles and small-fiber sensory neurons 39,41. Moreover, these stromal cells transcribe an array of genes encoding neuropeptides, their receptors and other nerve-related factors 41. Of particular interest, one stromal cell subtype expresses both IL-33 and the two subunits of the receptor for the neuropeptide CGRP (calcitonin-gene-related-peptide). Upregulation or downregulation of CGRP signals increases or decreases, respectively, IL-33 production by muscle stromal cells and, eventually, muscle (but not spleen) Treg-cell accumulation.
In humans.
Little information about skeletal muscle Treg cells in humans is currently available. We do know that FOXP3+CD4+ T cells are present at elevated levels in muscle biopsies of patients with DMD compared with healthy controls 35. We also know that IL-33+ stromal and vascular cells in close apposition to nerve fibers are readily detectable in uninjured muscle biopsies from healthy individuals 39.
Skin-Treg cells
Skin forms a physical barrier between the organism and its environment, protecting against chemical, mechanical and microbial insults and guarding against excessive water loss. It is a multi-layered organ, consisting of the epidermis, then dermis above a bed of adipose tissue and fascia (Fig. 3). The population of Treg cells operating in skin is a fascinating example of tissue-Treg cells because of the diversity of functions these cells perform 42. Given their accessible location, skin-Treg cells are also the tissue-Treg population that is best characterized in humans.
Figure 3: Skin biology and regulatory T cells.
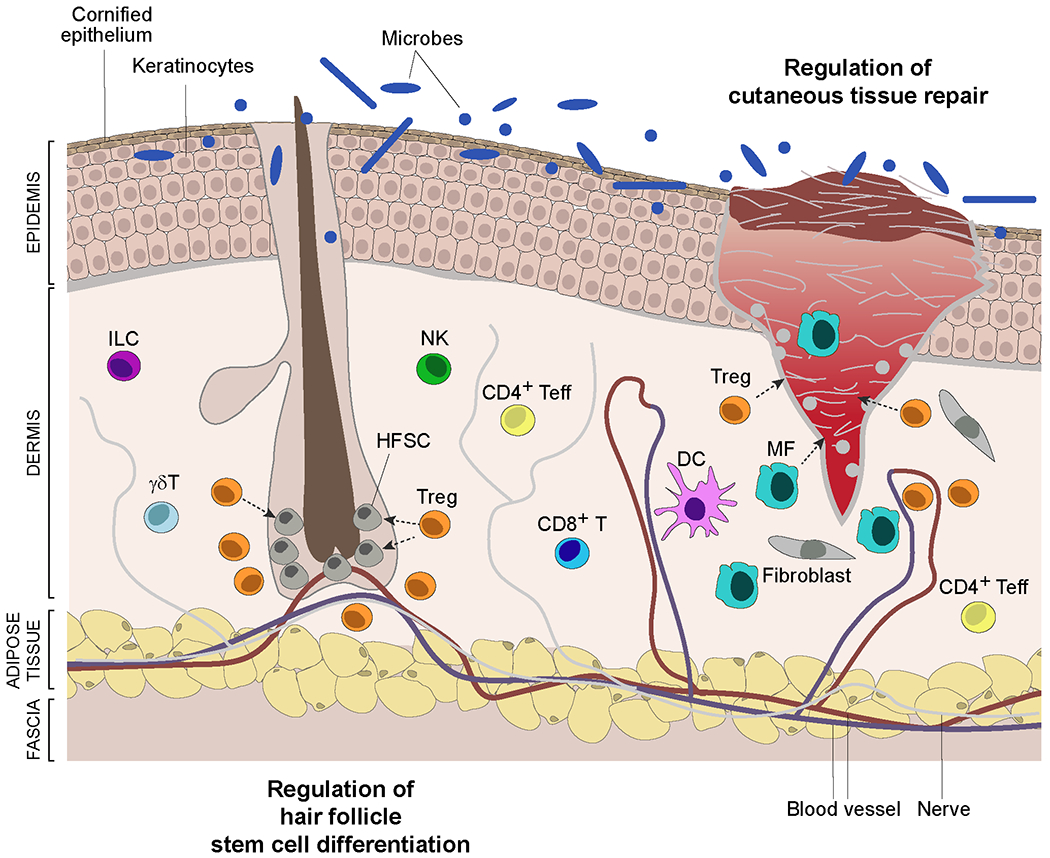
Schematic of skin showing a hair follicle and a full-thickness wound. The skin epidermis is composed primarily of keratinocytes that differentiate from basal-layer stem cells while migrating upwards, culminating in a cornified layer that interfaces with the environment. This layer is permeated by hair follicles that cycle through resting (telogen) and growth (anagen) phases, reflecting the activity of hair follicle stem cells (HFSCs). The collagen-rich dermis hosts a variety of stromal-cell types and innate and adaptive immunocyte populations. The deeper adipocyte layer functions as mechanical support and in thermoregulation. Regulatory T (Treg) cells integrate with skin cells to perform a diversity of functions: maintenance of tolerance to local self-antigens; promotion of tolerance to the skin microbiota; prevention of collateral damage during pathogen infections; optimization of cutaneous tissue repair; control of fibrosis; regulation of hair follicle stem cell proliferation, differentiation and fate. They exert their influences by impacting the activities of local immune, stromal and stem cells. DC, dendritic cell.
The existence and functional importance of skin-Treg cells have been recognized for at least two decades 43; however, their distinct nature and impressive range of activities became evident only relatively recently. There is an abrupt accrual of activated FOXP3+CD4+ T cells in skin of perinatal mice, constituting as much as 90% of local CD4+ cells, an accumulation that both depends on and promotes tolerance to the skin microbiota 44,45. Skin-Treg cells also ensure life-long tolerance to local self-antigens, which is a classical Treg-cell function’ as evidenced by the severe autoinflammatory disease that develops when they are absent or impaired 7,46–49. Their restraint of anti-pathogen responses to minimize collateral tissue damage 43,50 and their control of innate and adaptive allergic reactions 51 are also classical Treg-cell functions. Treg cells remain at elevated levels in skin of healthy adult mice, varying from 20–60% of CD4+ T cells according to the stage of the hair cycle; they concentrate around hair follicles and control the activities of hair follicle stem cells (HFSCs) 52.
Beyond their protective and homeostatic roles in healthy tissue, skin-Treg cells promote tissue repair after a variety of cutaneous insults: such as full-thickness wounding 53, epidermal abrasion by tape stripping 54, bleomycin-induced sclerosis 55 and ultraviolet-B (UVB) light exposure 56. Their activation and accumulation in association with conditions like dermatitis or psoriasis may also reflect, at least in part, their reparative activities 42. After wounding, highly activated Treg cells accumulate in the skin, where they hasten re-epithelialization and wound closure 53,54,56, rein in inflammation 53,56 and dampen fibrosis 55. The skin-Treg-cell transcriptome, TCR repertoire and growth and survival factor dependencies are adapted for effective performance of these diverse functions.
Transcriptome.
The skin-Treg-cell transcriptome has been studied in diverse contexts: in comparison with conventional CD4+ T cells in skin and/or with Treg cells in lymph nodes from healthy or UVB-exposed mice11,50–52,55,56. As anticipated, transcripts encoding activation or memory markers are upregulated in skin-Treg cells. They preferentially express transcripts encoding a skin-specific set of chemokine receptors, including CCR2, CCR6, CCR8, CCR10, CXCR4 and CXCR6. And they upregulate expression of transcripts specifying known effector molecules, such as IL-10, granzyme B, amphiregulin (AREG), Jagged1 and the neuropeptide Penk, which is increased upon UVB irradiation. More generally, UVB exposure induces programs of neuropeptide signaling and wound healing in skin-Treg cells 56.
Amongst the transcriptionally characterized tissue-Treg populations, skin and VAT-Treg cells are the most alike, at least at the population level 11,56. This similarity likely reflects shared dependence on mutually upregulated TFs such as BATF, IRF4, GATA3, MAF, BLIMP1 and RORα 11,51,55. This and other features of the transcriptomes are reminiscent of the T helper 2 (TH2) transcriptional program of effector T cells, and it has been argued that skin-Treg cells are primed to regulate type 2 immune responses such as those that drive fibrosis 55. The skin and VATTreg-cell compartments are overwhelmingly dominated by an ST2-marked subtype that preferentially expresses these TH2-associated molecules 11,15,19, driving their transcriptional concordance. Yet, scRNA-seq has revealed seven skin-Treg-cell subtypes 55, and skin-Treg cells can regulate both TH1 53 and TH17 cell 50,54 responses, so the story does not end there.
TCR repertoire.
The skinTreg population exhibits clonal expansion, a feature that has been noted for the ST2+FOXP3+CD4+ population of healthy skin 57 and the CD25hiCD4+ cell population of UVB-exposed skin 56. The degree of clonal expansion is greater than that of corresponding CD25−CD4+ T cell populations in skin. But it is not as extensive as that observed for ST2+FOXP3+CD4+ T cells in VAT of lean mice, perhaps reflecting the advanced age at which VAT is routinely prepared. While the TCR repertoire of skin Treg cells is largely distinct from those of lymphoid organs and other tissue-Treg populations, sharing of rare clones with VAT and/or colonic lamina propria Treg cells has been documented 57.
Growth and survival factors.
Treg cells seed the skin perinatally and localize near HFSCs in hair follicles 52. Their accumulation at that site depends on development of follicles, more specifically their production of the chemokine CCL20 (a CCR6 ligand), which is further induced by the skin microbiota 45. Once installed, skin-Treg cells interact directly with HFSCs to drive their proliferation and differentiation, dependent on expression of Jagged1 (by Treg cells) and Notch (by HFSCs) 52. It is not yet known whether HFSCs talk back to Treg cells.
Skin-Treg cells show a somewhat perplexing cytokine dependency. Most of them express CD25 and ST2 but their steady-state maintenance does not seem to depend critically on either IL-2 or IL-33 56,58. By contrast, they do require signaling through the IL-7 receptor, which most of them display quite prominently 58. This dependency likely reflects the effector/memory phenotype of adult skin-Treg cells 7, and this is fitting given the relatively high level of IL-7 production by local keratinocytes and relatively low level constitutive IL-2 secretion in skin. However, IL-2 or IL-33 could still play a role in skin-Treg cell phenotypic adaptation to particular stimuli, especially since both of these cytokines are well able to expand the skin-Treg-cell compartment 11.
In humans.
Skin-Treg cells are one of the few human tissue-Treg-cell compartments about which we have more than just a rudimentary knowledge. Healthy adult human skin hosts a substantial population of FOXP3+CD4+ T cells, on average about five times their frequency in the blood 59,60. These cells, highly activated and non-migratory, are preferentially localized near hair follicles, as in mice, and are most abundant in regions of high hair density 60. The corresponding Treg population in fetal skin is less frequent and less activated, suggesting that skin-Treg cells may accumulate over time in response to local antigen(s) 60,61. The functional importance of human skin-Treg cells is suggested by the severe autoinflammatory skin disease manifested in patients with IPEX (immune-dysregulation, polyendocrinopathy, enteropathy, X-linked) 62. In addition, development of alopecia areata, a common autoimmune disease resulting from T cell attack on hair follicles, is positively associated with a FOXP3 promoter polymorphism 63, and augmentation of Treg cells via low-dose IL-2 treatment is an effective alopecia therapy 64.
As in mice, healthy human skin-Treg cells show elevated expression of cell surface, activation and memory markers compared with blood Treg cells 51,60. But differences between human and mouse Treg cells do exist — for example, human but not mouse Treg cells express the mitochondrial enzyme arginase 2 65; and mouse but not human Treg cells display high levels of and depend on CD127, the IL-7 receptor 60.
The skin Treg-cell compartment expands notably in the inflamed lesions of patients with psoriasis and, in contrast to healthy skin Treg cells, they are highly proliferative and produce low levels of IL-17 50,60,66,67. There is a negative correlation between IL-17 and CD27 expression in patients’ skin-Treg cells, perhaps reflecting a role for CD27 in dampening effector T cell cytokine expression, as has been documented in mice 50. Psoriatic skin Treg cells show low-level expression of transcripts encoding arginase 2, an enzyme that has been linked to the high accrual, distinct identity and heightened suppressor activity of healthy skin Treg cells through downregulation of mTOR signaling 65, which is known to be detrimental to Treg-cell accumulation and activities in mice 68.
Tissue-Tregcell functional heterogeneity
Analogous to studies on tissue-resident macrophages 69, explorations of tissue-Treg-cell function have extended their purview beyond the regulation of local immune responses. For example, they have been reported to exert control over tissue and systemic metabolism, repair and regeneration of multiple tissues, and the proliferation, differentiation or fate of non-lymphoid cell progenitors. In part, these activities reflect indirect effects via neighboring immunocytes, often macrophages or ILCs, but they also issue from direct impacts of Treg cells on stromal, parenchymal or progenitor cells. As exemplars, we detail tissue-Treg-cell influences on organismal metabolism and on tissue repair and regeneration.
Control of organismal metabolism
VAT-Tre- cell control of metabolic tenor.
Epididymal VAT-Treg cells regulate local and systemic metabolic indices, including phosphorylation of proteins downstream of insulin signaling, glucose tolerance, insulin tolerance and the HOMA-IR (homeostatic model assessment for insulin resistance). Most studies have demonstrated a positive effect of VAT-Treg cells on the insulin sensitivity (and correlated parameters) of lean male mice 5,14,19,23,70,71; however, one report argued that they have a negative influence 72. The root of this divergence remains unknown but could lie in experimental divergences, such as different age of mice, different housing conditions, different microbiota and dissimilar approaches to manipulate Treg cells. The key VAT-Treg cell-deficient comparator strain in the latter case exhibited substantial reductions in body weight and fat mass, which does not typically occur in the absence of VAT Treg cells and could, in and of itself, account for improved metabolic indices.
By contrast, there is universal consensus that VAT-Treg cells promote metabolic health under obesogenic conditions. They are strikingly reduced in genetically or diet-induced models of obesity, which provokes local and systemic inflammation and insulin resistance5,19,72. This loss does not reflect a dearth of IL-33 — in fact, there is more of this cytokine in the epididymal fat pad of obese than of lean mice 19,25. Rather some inhibitory or toxic factor(s) must be coming into play. Candidates include IFNγ21,73, TNF74 and a soluble ST2 decoy molecule 74, all of which are increased in obese mice, but additional factors are almost certainly involved. Somewhat surprisingly, then, injection of IL-33 into obese mice augments their VAT-Treg-cell compartment and improves organismal metabolism 19–21,23.
Males vs females
Male and female mice have very different gonadal VAT-Treg-cell compartments, leading to differences in their metabolic tenors in response to obesogenic challenges and perhaps under steady-state conditions as well. Mouse ovarian VAT lacks the expanded Treg population characteristic of males of the same age 14,23,25,75. In addition, the gonadal Treg-cell transcriptomes differ by thousands of transcripts in the two sexes 23. These differences in accumulation and transcription are specific to gonadal VAT as Treg cells from other adipose tissues or from lymphoid organs do not diverge in these respects 14,23. Unexpectedly, lean female mice were reported to be more insulin-sensitive and glucose-tolerant and to have less VAT inflammation than their male counterparts 23. However, such metabolic improvements in female mice were not evident in another study 75. It may be relevant that in the former, but not the latter, case lean females also weighed substantially less than males did, confounding interpretation of the metabolic divergences: is the Treg-cell gain or weight loss causal? And, even in this study, experimental reduction of Treg cells in lean females impaired organismal metabolism, as it does in males 23.
Again in contrast with the behavior of their epididymal counterparts, ovarian VAT-Treg cells increase under obesogenic conditions 75,76. Moreover, obese females exhibit reduced VAT inflammation and improved metabolic indices compared with lean females, in opposition to the changes observed in males. This sexual dichotomy reflects the actions of sex hormones, as the increase in ovarian VAT-Treg cells is abolished in ovariectomized mice but is subsequently restored by oestrogen supplementation 76.
IL-33 levels are key to the sex differences observed under steady-state conditions 23,25. Indeed, injection of IL-33 into young females induces levels of Treg cells in ovarian VAT that are similar to those in epididymal VAT of unmanipulated, age-matched males. Lean male mice have more IL-33+ stromal cells in their gonadal VAT depot, and the landscapes of stromal cell subtypes are quite dissimilar in the two sexes, as are the transcriptomes of their gonadal VAT (but not other) Treg-cell compartments. The transcriptional differences include programs responding to the sex hormones oestrogen and androgen. Female mice with a genetically or pharmacologically induced deficit in oestrogen receptor signaling have more gonadal Treg cells and improved metabolic indices, whereas females lacking androgen receptor signaling show the opposite effects. Moreover, oestrogen-treated male mice have reduced gonadal VAT Treg cell levels whereas testosterone-treated females show an increase. The sexual dichotomy in Treg cell compartments is not Treg cell intrinsic, which is consistent with a central role for differential IL-33 production by stromal cells.
SAT-Treg-cell control of thermogenesis.
VAT is composed primarily of white adipocytes, the major function of which is to store excess energy. The inflammation and metabolic dysregulation provoked by nutrient overload are initiated in VAT depots, and we have explored how VAT Treg cells regulate these aberrant processes. However, mammals also host two other major adipocyte types, brown and beige, which do not store energy but rather dissipate it as heat, a process termed adaptive thermogenesis.
In lean, young mice, both BAT and SAT host a readily detectable population of Treg cells 5,25,77–79. Before 3 months of age, SAT-Treg cells constitute a fraction of CD4+ T cells similar to or even greater than that of VAT -Treg cells (i.e. ~10–20%) 5,25,77. However, SAT-Treg cells neither increase with age nor substantially decrease with obesity 5. Their phenotype appears to be different from that of their VAT counterparts, more like that of splenic Treg cells — for example, SAT-Treg cells express low levels of ST2 and KLRG1 and seem not to depend much on IL-33 at steady state 25. Their transcriptome is yet to be characterized. On the other hand, the transcriptome of BAT Treg cells, which makes up a fraction of CD4+ T cells similar to that of their SAT counterparts, has been reported 77,79. Most transcripts upregulated in SAT-Treg cells compared with lymphoid organ Treg cells are elements of the VAT Treg-cell signature, although a small fraction is not, raising the possibility of depot-adapted Treg-cell compartments.
Data from three studies argue that the Treg populations in SAT and/or BAT can respond to environmental cues — such as cold exposure, short-term high-calorie diet or β-3 adrenergic receptor agonism – to promote thermogenesis, whereas their counterpart in VAT cannot or can only minimally do so 77–79. Application of such stimuli expands the local Treg population; induces expression of the mitochondrial protein UCP1 and additional elements of the thermogenic program; promotes beiging of SAT, increases lipolysis, and stifles heat production. The centrality of Treg cells to this process has been demonstrated through in vivo loss- and gain-of-function experiments.
Tissue repair and regeneration
Studies on skeletal -muscle Treg cells advanced the concept that a dedicated population of Treg cells can promote the repair and regeneration of injured tissue through combined effects on immunological and non-immunological processes 6. Such influences are both widespread and evolutionarily conserved. Local Treg-cell impacts on tissue regeneration have been documented subsequent to multiple types of acute or chronic injury of many other mouse tissues, for example the skin 53,54, lungs 10,80,81, heart 9,82,83, CNS 12,84, intestines 85 and peripheral vascular system 86. Zebrafish also have FOXP3+ T cells that infiltrate damaged tissues such as the spinal cord, heart and retina; these cells promote regeneration by secreting tissue-specific regulators of progenitor cell proliferation 87. In essentially all of these contexts, tissue -Treg-cells play the dual roles of dampening inflammation and promoting tissue recovery.
An early inflammatory response is a necessary element of the tissue repair andregeneration process as it serves to sterilize the wound, to remove dead cells and debris, and to enhance proliferation of parenchymal cell precursors. Major contributors from the innate immune system are neutrophils and inflammatory macrophages, which are soon joined by a variety of adaptive immune-system cells – TH1 cells, TH2 cells, TH17 cells, CD8+ T cells, γδ T cells and NK cells, depending on the particular context. On the other hand, an overexuberant or over-long inflammatory response is detrimental to tissue recovery as it can interfere with the eventual change in immunocyte tenor required for effective repair, notably the emergence of pro-reparative macrophages 88. Tissue -Treg cells rein in the early inflammatory response and promote the transition to a tissue milieu that favors regeneration 9,53,54,89. Treg-cell production of IL-10 seems to be a major effector mechanism 90,91, although the importance of this cytokine has too often just been assumed from its augmented expression and too little effort has been devoted to identifying other mechanisms involved, for which transcriptomic analyses have now provided many candidates (such as the proteins GZMB, METRNL, FGL2, Serpin B1a and LTB4R1).
Tissue Treg cells impact non-immunological processes at several points along the regeneration pathway. First, they can promote repair of tissue barriers, as skin Treg cells do by inhibiting a local CXCL5–IL-17 axis of inflammation and thereby diverting HFSC differentiation towards the epidermal cell lineage 54. Second, they foster the proliferation and/or differentiation of non-lymphoid cell precursors in several injured tissues: such as muscle 6, heart 83, skin 54 and the CNS 84 in mice; and heart, CNS and retina in zebrafish 87. Third, they promote healthy tissue remodeling, dampening pathological processes such as fibrosis and astrogliosis 6,9,12,55,83.
The pro-regenerative effects of tissue-Treg cells are multivariate. They can operate directly or indirectly on non-lymphoid cells or their precursors — even within the same tissue. On the one hand, a major influence of local Treg cells early after muscle injury is to restrain IFNγ production by TH1 and CD8+ T cells 89, which could protect quiescent satellite cells from collateral attack by limiting their display of MHC class I molecules, as has been documented in other contexts 92,93. On the other hand, AREG, produced by muscle Treg cells later during the healing process, binds to epidermal growth factor receptor (EGFR) on muscle cell progenitors and enhances their differentiation 6. The pro-regenerative effects of tissue Treg cells can reflect cell–cell contacts — for example, elevated HFSC proliferation and differentiation induced by Jagged1–Notch interactions in skin 52 — or can be mediated by soluble factors. These factors can be general or tissue-specific. AREG exemplifies a general factor with documented regenerative activity in the skeletal muscle 6, lungs 10, skin 53, CNS 12 and neonatal heart in mice 83. There are also many examples of tissue -Treg-cell-produced soluble factors implicated in the regeneration of a particular tissue: the matricellular protein CCN3 in the CNS 84, the pro-angiogenic peptide apelin in the peripheral vascular system 86 and keratinocyte growth factor in the lungs 81 of mice; neurotrophin 3 in the spinal cord, neuregulin 1 in the heart and insulin-like growth factor 1 in the retina of zebrafish.
On a distinct but related note, several examples of tissue -Treg cells promoting the homeostatic proliferation and/or differentiation of non-lymphoid-cell precursors have been reported. Through Jagged1–Notch interactions, skin-Treg cells regulate the hair follicle cycle by driving HFSC division and differentiation 52. Intestinal Treg cells use IL-10 to support intestinal stem cell renewal, restraining their proliferation and aberrant differentiation 91. Bone -marrow-Treg cells are frequently located next to haematopoietic stem cells, assuring their numbers and quiescence by regulating local adenosine production 94,95. And VAT-Treg cells exert control over the numbers and relative representation of adipocyte-generating stromal-cell subtypes in their microenvironment 25.
Tissue Treg cell origin and diversification
Cellular derivation
The distinctiveness of the various tissue Treg populations raises the issue of their origin. When are they made? Do they migrate from the thymus as Treg cells or are they generated through peripheral conversion of conventional CD4+ T cells? Where do their specialized phenotypes emerge?
Ontogeny.
Treg cells generated early and later in a mouse’s life are different 96. FOXP3+CD4+ T cells can be detected in the thymus from as early as two days after birth and in the peripheral lymphoid organs shortly thereafter. Perinatally generated Treg cells are quite stable, persisting for months. Selection of about one third to one half of the perinatal Treg-cell repertoire depends on thymic expression of the transcriptional regulator AIRE and these cells are crucial for avoidance of autoimmune attack of a number of organs. Peptides recognized by several perinatal T cell clones were recently identified, and certain of them are tissue-preferentially expressed 97. Moreover, the transcriptome of perinatally generated Treg cells is more similar to those of various tissue -Treg populations than is the transcriptome of Treg cells generated in adult mice, including upregulation of typical tissue-Treg-cell transcripts such as Il1rl1, Pdcd1, Ccr2, Icos, Fgl2 and Il9r 96. These observations suggest that tissue-Treg cells might be generated perinatally.
Indeed, Treg-cell seeding of several tissues (VAT, skin, lungs, colon and liver) is active during the first two weeks of life 15,44,57,98. The installed skin- and VAT-Treg populations are minimally migratory, and the population in VAT is inadequately replenished if depleted in an adult 5,15. Thus, at least some tissue-Treg-cell compartments are seeded perinatally.
Derivation.
Treg cells can emerge from the thymus as FOXP3+CD4+ cells (thymus-derived Treg cells) or can come from FOXP3−CD4+ cells by peripheral conversion (peripherally derived Treg cells). While not perfect markers, FOXP3+CD4+ cells expressing little or no helios or neuropilin 1 are generally considered to be peripherally derived. Placental Treg cells and a major subtype of Treg cells in the colonic lamina propria are notable examples of peripherally derived Treg cells, and the primary phenotype of mice with a genetically engineered deficiency in peripherally derived Treg cells is intestinal inflammation, at least at steady state 99,100. Given their generally high level expression of helios and/or neuropilin 1, most tissue-Treg cells are probably thymus-derived. And where the issue has been addressed more rigorously via transcriptomics, TCR sequencing and/or adoptive-transfer experiments (for example for VAT and muscle Treg cells 6,15), the same conclusion was reached. It remains possible, however, that peripherally derived Treg cells contribute to the Treg compartments of these tissues as a minor component, for example in response to inflammatory challenges.
Specification.
The emergence of distinct tissue-Treg populations was anticipated to follow one of two scenarios: they exit ready-made from the thymus or they take on their specialized phenotype once installed within their home tissue. However, the actual scenario turns out to be more complex (Fig. 4): future tissue-Treg cells emigrate from the thymus to lymphoid organs without (so far) detectible distinction; there they undergo an activation event of unknown origin, which permits them to leave the circulation and access the tissues; those of them whose TCRs recognize a local antigen are retained and undergo definitive phenotypic adaptation. This scenario was originally established using a TCR-transgenic mouse model harboring the rearranged Tcra and Tcrb genes of a VAT-Treg-cell clone coupled with a Pparg reporter line 14. It has subsequently been generalized to the skin 57,101–102, colon 57,101, liver 57 and lungs 57,102.
Figure 4: The cellular derivation of tissue regulatory T cells.
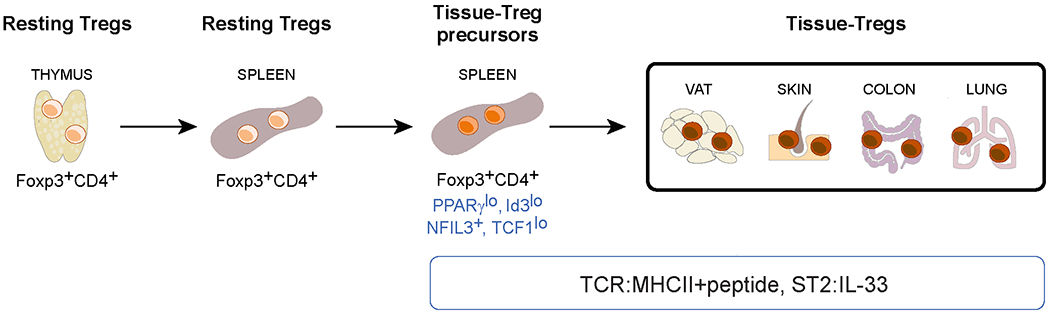
FOXP3+CD4+ T cells exit the thymus and enter the circulation, including lymphoid organs such as the spleen. Less than 10% of resting lymphoid-organ regulatory T (Treg) cells undergo an unknown activation event that allows them to escape the circulation and filter through tissues. Treg cells are retained in a tissue that expresses peptide–MHC class II complexes recognized by their T cell receptors (TCRs) and therein undergo definitive specialization. VAT, visceral adipose tissue. NFIL3, nuclear factor interleukin-3-regulated protein 3; TCF1, T cell factor 1; ST2, IL-33 receptor.
Various markers can be used to distinguish the tissue- Treg-cell precursor residing in lymphoid organs: PPARγlow 14, ID3low 102, NFIL3+ 57 and TCF1low 103. Although the activation event that incites their maturation in the spleen is not yet known, precursor accumulation in vivo depends on TCR–MHC class II interactions, FOXP3 and IL-33 14; and they can be induced in vitro from naive splenic Treg cells by addition of IL-4, IL-6 or IL-33. The transcriptome and BATF dependence of splenic tissue-Treg-cell-precursors are reminiscent of the ST2+ subtype of tissue-Treg cells that is dominant in VAT and skin but present to at least some degree in all tissues so far examined 57. It remains to be determined whether other tissue-Treg-cell subtypes arise from the same precursor population.
Molecular diversification
The transcriptomes of Treg cells located in various non-lymphoid tissues diverge substantially from those of lymphoid-organ Treg cells and are also quite distinct from each other. To illustrate this point, we have compiled a set of robust published RNA-seq datasets from diverse tissue-Treg populations (Fig. 5) and have distilled lists of genes expressed differentially compared with control lymphoid-organ-Treg populations from the same mice. (Note that this approach avoids issues of dissimilar mice, Treg-cell isolation procedures and/or RNA analysis platforms). Principal components analysis (PCA) on the differentially expressed gene sets shows that VAT- and skin Treg cells have the most distinct transcriptomes, whereas brain- and liver-Treg cells are more similar to, yet still distinct from, lymphoid organ Treg cells (Fig. 5a).
Figure 5: Analysis of tissue regulatory T cell transcriptomes.
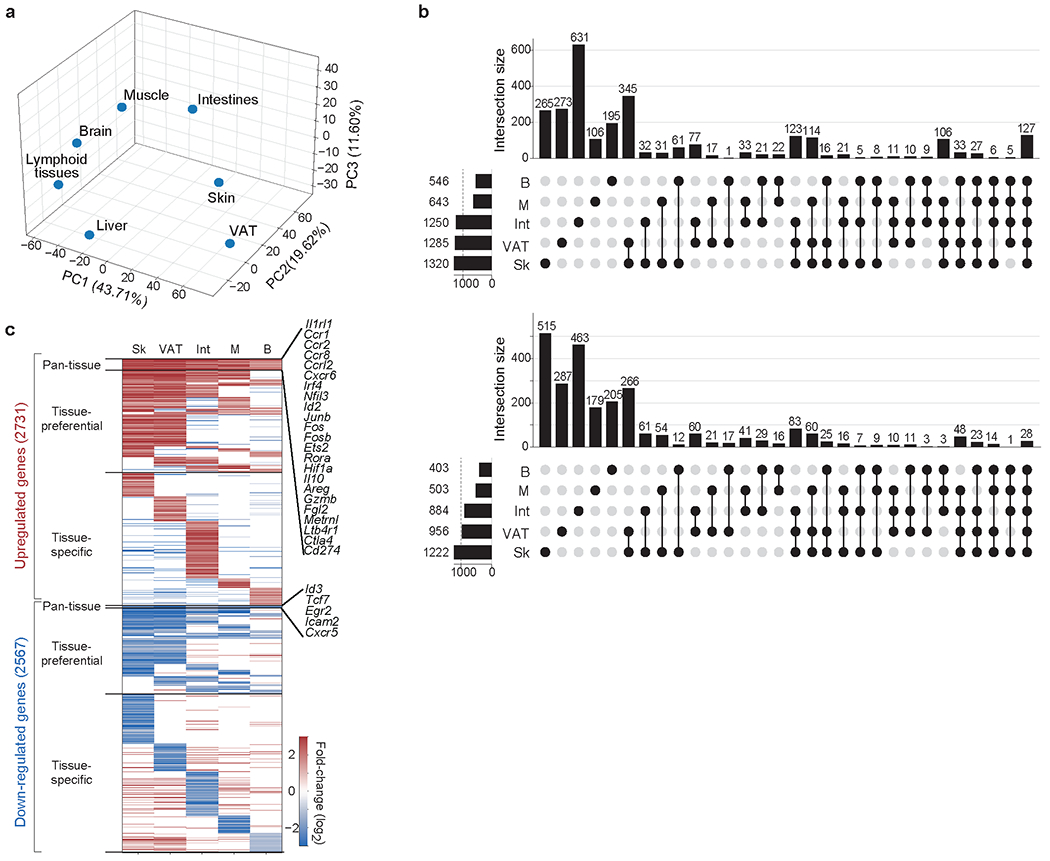
Transcripts differentially expressed between each tissue regulatory T (Treg) cell population and its corresponding lymphoid-tissue control (fold change >2 and FDR <0.10) were calculated using the edgeR package. RNA sequencing datasets for VAT, skin and liver Treg cells are from REF. 11; skeletal-muscle Treg-cell data are from REF. 38; brain Treg cell-data are from REF. 107; and intestinal Treg cell-data are from REF. 111. a. The compiled matrix of log2 (fold-changes) for each of the tissue-Treg-cell populations was scaled and used to perform principal components analysis (PCA). Principal components 1, 2 and 3 with their proportions of explained variance are plotted. b. UpSet plot depicting inter-tissue intersections for upregulated (top) and downregulated (bottom) transcripts from tissue-Treg cells that had more than 500 differentially expressed genes. The horizontal bar graph indicates the total number of upregulated or downregulated transcripts for each tissue-Treg population. The vertical bar graph shows the number of transcripts corresponding to the particular intersection or set of intersections delineated on the dot matrix. c. Heatmap of log2 (fold-changes) for each tissue-Treg population, separated into pan-tissue, tissue-preferential or tissue-specific gene sets. For each tissue Treg population, the log2 (fold-changes) of transcripts not in the signature (for example, fold-change <2 or FDR >0.10) are set to 0 for that tissue. Example transcripts from the upregulated and downregulated pan-tissue signatures are highlighted on the right. The matrix containing all of the tissue-Treg-cell signatures, whether pan-tissue, tissue-preferential or tissue-specific, can be downloaded at: [https://cbdm.hms.harvard.edu/img/resources/SignaturesAndDatasets/Tissue-Treg%20signatures.xlsx].
The establishment and regulation of these distinct tissue-Treg-cell transcriptomes is complex and multi-layered. Differential-transcript analysis reveals gene sets that are upregulated or downregulated in all tissue-Treg-cell compartments (pan-tissue), shared by more than one tissue’s Treg cells (tissue-preferential) and unique to a particular tissue- Treg-cell compartment (tissue-specific) (Fig. 5b and c). The pan-tissue upregulated signature includes transcripts encoding genes that are likely to be involved in the accumulation and functions of tissue-Treg-cells in general: TFs (for example, Irf4, Nfil3, Id2, Rora and Hif1a), ST2 (Il1rl1), several chemokine receptors (Ccr1, Ccr2, Ccr8, Ccrl2 and Cxcr6), effector molecules (Il10, Ebi3, Areg, Gzmb, Fgl2, Metrnl and Ltb4r1) and co-inhibitory molecules (such as Ctla4 and Cd274). Pathway analysis of this signature reveals enrichment of cellular responses to hypoxia, a possible adaptation to the slightly more hypoxic environments inside tissues; cytokine-mediated signalling, consistent with the importance of soluble factors in tissue-Treg-cell recruitment and survival; and the circadian clock. The much smaller pan-tissue downregulated signature includes transcripts encoding TFs (such as Id3 and Tcf7) and molecules implicated in lymphocyte trafficking to lymph nodes (Icam2 and Cxcr5). Key members of these pan-tissue upregulated and downregulated transcript sets are already modulated during the transition of naive Treg cells to tissue-Treg-cell precursors in the lymphoid organs 14,57,101,102,103. On the other hand, tissue-specific signatures are enriched for pathways that are important for Treg-cell accumulation or function in unique tissue environments: for example, regulation of cell matrix adhesion pathways in the skin-specific upregulated signature, which is useful for Treg cells residing in the collagen-rich dermis; or lipid metabolism pathways in the VAT-specific upregulated signature, which is important for survival in the otherwise toxic lipid-rich environment of fat. This multi-layered transcriptional landscape reflects influences both by epigenetic factors and by an interconnected network of positively and negatively acting TFs. However, we are just beginning to identify and integrate the activities of the key factors involved.
Epigenetic factors.
Methylation of CpG residues on DNA is an epigenetic mark that has been correlated with gene expression or silencing. A genome-wide analysis revealed that the DNA methylomes of VAT- and skin Treg cells differ substantially from that of lymph node Treg cells, whereas the liver and lymph-node Treg-cell methylation patterns are much more similar 11. Analogous to their transcription profiles, the DNA methylation landscapes of VAT- and skin Treg cells have both shared and distinct components. Indeed, there is the expected negative correlation between most genes’ methylation and transcription statuses. Whereas tissue-Treg-cell signature genes (both pan-tissue and tissue-specific) are often hypermethylated in the bulk population of lymphoid organ Treg cells, this modification declines in the small population of tissue Treg cell precursors found within lymphoid organs.
Another class of epigenetic marks that shows correlations with the level of gene expression is post-translational histone modification, especially methylation and acetylation. Open-chromatin regions (OCRs), often measured by the assay for transposase-accessible chromatin with high-throughput sequencing (ATAC-seq), represent an integration of positively and negatively associated histone marks. Focusing on the differentially expressed sets of genes, tissue Treg-cell OCRs again fall into three classes 37,57: pan-tissue, tissue-preferential and tissue-specific. Interestingly, more than half of these OCRs — whether pan-tissue or tissue-specific — are already accessible in the bulk Treg population of lymphoid organs, though not in other T cells. Such priming might serve to facilitate rapid changes in gene expression once the Treg cells are installed in their home tissue and/or to create a restrained framework on which tissular cues can act.
Transcription factors.
Along with more classical approaches, ATAC-seq analyses have provided important information on TFs that regulate the tissue-Treg cell differentiation pathway. BACH2, IRF4 and BATF are all key TFs for entry into the tissue-Treg-cell precursor pool in lymphoid organs. BACH2 promotes the expression of transcripts that are downregulated in tissue-Treg cells and their immediate precursors, and restrains their expression of upregulated transcripts 37,104; whereas IRF4 and BATF show the opposite activities 11,57,105. Consequently, populations of tissueTreg cells and their precursors are expanded in BACH2-deficient mice and are absent or contracted in mice lacking IRF4 or BATF. A model has emerged whereby BACH2, induced by TCR engagement, directly enhances the expression of certain tissue-Treg-cell downregulated signature loci, but also competes with BATF/JUN complexes for AP-1 binding sites at upregulated signature loci, thereby blocking recruitment of IRF4 104.
IRF4 and/or BATF induce the expression of additional important TFs — such as BLIMP1, MAF, GATA3 and ID2 — in tissueTreg-cell precursors 57,105,106. BLIMP1, encoded by Prdm1, is crucial for the induction of tissue-Treg-cell effector molecules, notably IL-10 106. It also inhibits the activity of the DNA methyltransferase DNMT3a, resulting in hypermethylation of the Foxp3 locus, amongst others. This effect ensures high level FOXP3 expression and, consequently, maintenance of Treg-cell stability under inflammatory conditions 107. ID3 and ID2 are TFs of the basic helix-loop-helix class that regulate E-protein function. ID3 is highly expressed in resting Treg cells but not tissue-Treg cells or their immediate precursors, and its loss favors tissue-Treg-cell differentiation; whereas ID2 has the opposite distribution and impact 37,57,102,104,108.
TFs with tissue-preferential or tissue-specific effects on Treg-cell pools have also been identified 37. Interestingly, integrated ATAC-seq and RNA-seq analysis has revealed that most of the consequential tissue-specific TFs are members of just a few major families — such as bZIP, ETS, nuclear receptor and RHD — but that different family members are dominant in different tissues. For example, within the nuclear receptor family, PPARγ, RORα and RARα are associated with VAT-Treg-cell transcriptional regulation, whereas RORγ, VDR and others are associated with colon Treg-cell transcriptional regulation. A paradigmatic example of tissue-specific control of Treg-cell expression is PPARγ. This nuclear receptor family member is expressed at low levels in splenic tissue-Treg-cell progenitors but at high levels only after their installation in VAT 14. VAT-Treg cells require PPARγ for normal accumulation and function 16. Given that expression of Pparg is regulated by BATF and IRF4 in VAT 19, its transcription in tissue-Treg-cell progenitors and tissue-Treg populations other than that in VAT 11,37 is not surprising. However, a direct comparison between VAT and skin Treg cells revealed substantially lower DNA methylation and higher Pparg transcription levels in VAT cells 11. Moreover, PPARγ was not found to influence the accumulation of Treg cells in skeletal muscle, the only non-VAT tissue-Treg population functionally examined to date 37.
Lastly, major features of the tissue-Treg-cell diversification pathway are likely conserved between mice and humans. Many of the core skin and colon-Treg-cell identity genes, or their paralogues, are shared between the two species 101. Moreover, an IPEX-associated FOXP3 mutation expands the DNA-recognition profile of FOXP3 when introduced into mice, thereby repressing Batf transcription and impairing tissue-Treg-cell fitness 105.
Summary and perspectives
The tissue-Treg-cell concept has seen tremendous advances over the past decade. We have learned that many non-lymphoid tissues host phenotypically and functionally distinct Treg-cell compartments, and that they have done so through vertebrate evolution. Exploring the distinct Treg populations of diverse tissues has uncovered extensive heterogeneity in their provenance, transcriptomes, TCR repertoires, growth and survival factor dependencies and effector mechanisms. Their impacts on more and more non-immunological processes are becoming evident. Yet, we still have a lot to learn. Some areas that seem particularly ripe for exploration are listed below. Certain of these endeavors will benefit from, or may even require, technological advances (such as those discussed in Box 1).
Box 1: A wish-list of technological advances.
A tissue Treg single-cell atlas
Single-cell RNA sequencing (scRNA-seq) data on tissue Treg populations have begun to emerge 37,55,57,83,101,112. They have reinforced the global distinctiveness of the Treg-cell compartments in different tissues but have also revealed the existence of analogous, though still distinct, subtypes within the Treg-cell compartments of the various tissues. Since the data remain relatively limited and have been generated using different platforms, filtered using different quality-control measures and analyzed via different algorithms, a more comprehensive, stereotypically generated tissueTreg cell atlas stands to provide immense stimulus to the field. Such a compendium should not only encompass the Treg-cell compartment of a diversity of tissues at homeostasis but also include dynamic data on Treg populations subsequent to classical non-immunological challenges. (Note that existing dynamic data on tumor-Treg cells argue the value of such an endeavor 112). Spatial transcriptomics approaches could also be valuable in localizing diverse tissue-Treg-cell subtypes within their host organ. Achieving this ambitious goal would not only demand will and wealth, but also improvements in existing technologies. Lastly, the power of zebrafish as a vertebrate model argues for an ancillary, analogous tissue-Treg cell atlas under steady-state and challenged conditions.
Tissue-specific targeting of Treg cells.
An issue that has often arisen in studying tissue -Treg cells is the inability, with a few exceptions, to either expand or diminish the Treg population specifically in a designated tissue rather than organism-wide. Experimental explorations would greatly benefit from such a targeted approach, while clinical studies may well depend on it. It is imperative, then, to invest efforts in approaches such as: combinatorial conditional knockouts 113,114, bispecific (Treg cells plus tissue) delivery modalities, data mining for targets on designated tissue-Treg populations, and arming of transferred cells or nanoparticles with tissue-relevant T cell receptors.
More sophisticated in vitro models
Classical functional tests like the in vitro suppression assay are largely irrelevant to tissue-Treg-cell biology, so we must rely on in vivo or more complex in vitro systems (reviewed in 115) for meaningful insights. One approach is to use ex vivo tissue slices, which maintain integrity over several days and permit convenient additions and subtractions of cells and molecules. Organoids, whether derived from stem cells or constructed from existing tissue components, are an increasingly used alternative. While complex and not perfect reproductions of the tissue being modeled, such systems permit easier and more punctual manipulation than is possible with living organisms. And they can often be more readily translated to the analogous human tissue.
We cited many examples of Treg cells driving division and/or differentiation of non-lymphoid cell precursors during tissue regeneration. More surprising (and intriguing) are the observations of Tre- cell homeostatic impacts on progenitor cells of diverse organs in healthy animals. To what extent are these direct effects? What soluble mediators and cell-surface ligands are involved? Are these molecular pathways the same as those mobilized subsequent to acute or chronic injury? Do Treg-cell–progenitor-cell interactions play any roles during postnatal organogenesis?
The identification of antigens recognized by tissue-Treg cells would render several aspects of experimental work easier or more precise and could open new avenues of preclinical exploration. Currently, the best-characterized examples are two prostate Treg-cell clones that recognize distinct peptides from the prostatic protein TCAF3 109. The identification of other tissue-Treg-cell targets has proven challenging so far, as is true for most CD4+ T cell self-antigens.
Understanding the true capabilities of tissue-Treg cells requires “capturing” them within their microenvironment: their definitive phenotype is set therein, they respond to signals from neighboring cells, and they influence the behavior of cells in their vicinity. Thus, we must no longer confine explorations of molecular and cellular interaction partners to the realm of immunocytes. We have already seen that tissue-Treg cells receive key signals from nerve and stromal cells 12,15,39,41,56,110 and provide signals to stem 6,52,91 and vascular 86 cells.
Information on human tissue-Treg-cell compartments is woefully scant, with the relative exceptions of the skin and colon Treg populations. This dearth of information reflects the poor accessibility of most human non-lymphoid tissues and, more recently, the artefactually poor representation of tissue-Treg cells (and other T cells) achieved with whole-tissue scRNA-seq platforms or single-nuclear variants thereof. Precision targeting of designated tissue-Treg-cell compartments stands to be both more effective and less risky.
Acknowledgements
Our laboratory’s work in this area is supported by the JPB Foundation; US National Institutes of Health (NIH) R01 grants DK092541 and AR070334; and NIH RC2DK116691. We thank present and past lab members for their contributions to these studies. We also thank G. Garg and T. Korn for providing the RNA-seq data for central nervous system Treg cells. Thanks also to C. Laplace, L. Kozinn and M. Chen for help in preparing the manuscript.
GLOSSARY
- Immunocyte
A cell, such as a lymphocyte, that has an immunologic function
- White adipocytes
Type of fat cell that stores lipids as triglycerides. They are mostly found in visceral adipose tissue, which has functions beyond lipid storage, including cushioning and insulating the body; serving as an endocrine organ through secretion of adipokines, cytokines and other mediators; and in anti-pathogen responses.
- Beige adipocytes
A type of thermogenic adipocyte that can be induced in white adipose tissue – in particular, subcutaneous depots – in response to environmental cues such as cold or short-term nutrient excess.
- Brown adipocytes
Lipid storage cells that play a crucial role in non-shivering thermogenesis. They are confined to brown adipose tissue. Like beige adipocytes, they have an elevated mitochondrial content and transcribe a thermogenic program dependent on expression of UCP1. They are activated by release of β-adrenoreceptor agonists from sympathetic neurons and the adrenal gland.
Footnotes
Competing interests
The authors declare no competing interests. DM is a co-founder of TRex Bio and a consultant for Third Rock Ventures and Pandion Therapeutics.
Peer review information
Nature Reviews Immunology thanks M. Rosenblum, S. Sakaguchi and other anonymous reviewers for their contribution to the peer review of this work.
REFERENCES
- 1.Fontenot JD, Gavin MA, & Rudensky AY Foxp3 programs the development and function of CD4+CD25+ regulatory T cells. Nat. Immunol 4, 330–336 (2003). [DOI] [PubMed] [Google Scholar]
- 2.Hori S, Nomura T, & Sakaguchi S Control of regulatory T cell development by the transcription factor Foxp3. Science 299, 1057–1061 (2003). [DOI] [PubMed] [Google Scholar]
- 3.Khattri R, Cox T, Yasayko SA, & Ramsdell F An essential role for Scurfin in CD4+CD25+ T regulatory cells. Nat. Immunol 4, 337–342 (2003). [DOI] [PubMed] [Google Scholar]
- 4.Ait-Oufella H et al. Natural regulatory T cells control the development of atherosclerosis in mice. Nat. Med 12, 178–180 (2006). [DOI] [PubMed] [Google Scholar]
- 5.Feuerer M et al. Lean, but not obese, fat is enriched for a unique population of regulatory T cells that affect metabolic parameters. Nat Med 15, 930–939 (2009). [DOI] [PMC free article] [PubMed] [Google Scholar]
- 6.Burzyn D et al. A special population of regulatory T cells potentiates muscle repair. Cell 155, 1282–1295 (2013). [DOI] [PMC free article] [PubMed] [Google Scholar]
- 7.Rosenblum MD et al. Response to self antigen imprints regulatory memory in tissues. Nature 480, 538–542 (2011). [DOI] [PMC free article] [PubMed] [Google Scholar]
- 8.Schiering C et al. The alarmin IL-33 promotes regulatory T-cell function in the intestine. Nature 513, 564–568 (2014). [DOI] [PMC free article] [PubMed] [Google Scholar]
- 9.Saxena A et al. Regulatory T cells are recruited in the infarcted mouse myocardium and may modulate fibroblast phenotype and function. Am. J. Physiol Heart Circ. Physiol 307, H1233–H1242 (2014). [DOI] [PMC free article] [PubMed] [Google Scholar]
- 10.Arpaia N et al. A distinct function of regulatory T cells in tissue protection. Cell 162, 1078–1079 (2015). [DOI] [PMC free article] [PubMed] [Google Scholar]
- 11.Delacher M et al. Genome-wide DNA-methylation landscape defines specialization of regulatory T cells in tissues. Nat Immunol 18, 1160–1172 (2017). [DOI] [PMC free article] [PubMed] [Google Scholar]
- 12.Ito M et al. Brain regulatory T cells suppress astrogliosis and potentiate neurological recovery. Nature 565, 246–250 (2019). [DOI] [PubMed] [Google Scholar]
- 13.Cohen P & Spiegelman BM Cell biology of fat storage. Mol. Biol. Cell 27, 2523–2527 (2016). [DOI] [PMC free article] [PubMed] [Google Scholar]
- 14.Li C et al. TCR transgenic mice reveal stepwise, multi-site acquisition of the distinctive fat-Treg phenotype. Cell 174, 285–299 (2018). [DOI] [PMC free article] [PubMed] [Google Scholar]
- 15.Kolodin D et al. Antigen- and cytokine-driven accumulation of regulatory T cells in visceral adipose tissue of lean mice. Cell Metab 21, 543–557 (2015). [DOI] [PMC free article] [PubMed] [Google Scholar]
- 16.Cipolletta D et al. PPAR-γ is a major driver of the accumulation and phenotype of adipose tissue Treg cells. Nature 486, 549–553 (2012). [DOI] [PMC free article] [PubMed] [Google Scholar]
- 17.Fernandes RA et al. Discovery of surrogate agonists for visceral fat Treg cells that modulate metabolic indices in vivo. eLife 9, e58463 (2020). [DOI] [PMC free article] [PubMed] [Google Scholar]
- 18.Cipolletta D et al. Appearance and disappearance of the mRNA signature characteristic of Treg cells in visceral adipose tissue: age, diet, and PPARγ effects. Proc Natl Acad Sci U S A 112, 482–487 (2015). [DOI] [PMC free article] [PubMed] [Google Scholar]
- 19.Vasanthakumar A et al. The transcriptional regulators IRF4, BATF and IL-33 orchestrate development and maintenance of adipose tissue-resident regulatory T cells. Nat. Immunol 16, 276–285 (2015). [DOI] [PubMed] [Google Scholar]
- 20.Han JM et al. IL-33 reverses an obesity-induced deficit in visceral adipose tissue ST2+ T regulatory cells and ameliorates adipose tissue inflammation and insulin resistance. J. Immunol 194, 4777–4783 (2015). [DOI] [PubMed] [Google Scholar]
- 21.Molofsky AB et al. Interleukin-33 and interferon-γ counter-regulate group 2 innate lymphoid cell activation during immune perturbation. Immunity. 43, 161–174 (2015). [DOI] [PMC free article] [PubMed] [Google Scholar]
- 22.Halim TYF et al. Tissue-restricted adaptive type 2 immunity is orchestrated by expression of the costimulatory molecule OX40L on group 2 innate lymphoid cells. Immunity 48, 1195–1207 (2018). [DOI] [PMC free article] [PubMed] [Google Scholar]
- 23.Vasanthakumar A et al. Sex-specific adipose tissue imprinting of regulatory T cells. Nature 579, 581–585 (2020). [DOI] [PMC free article] [PubMed] [Google Scholar]
- 24.Chang SK et al. Stromal cell cadherin-11 regulates adipose tissue inflammation and diabetes. J Clin. Invest 127, 3300–3312 (2017). [DOI] [PMC free article] [PubMed] [Google Scholar]
- 25.Spallanzani RG et al. Distinct immunocyte-promoting and adipocyte-generating stromal components coordinate adipose tissue immune and metabolic tenors. Sci Immunol 4, eaaw3658 (2019). [DOI] [PMC free article] [PubMed] [Google Scholar]
- 26.Mahlakõiv T et al. Stromal cells maintain immune cell homeostasis in adipose tissue via production of interleukin-33. Sci Immunol 4, eaax0416 (2019). [DOI] [PMC free article] [PubMed] [Google Scholar]
- 27.Dahlgren MW et al. Adventitial stromal cells define group 2 innate lymphoid cell tissue niches. Immunity 50, 707–722 (2019). [DOI] [PMC free article] [PubMed] [Google Scholar]
- 28.Rana BMJ et al. A stromal cell niche sustains ILC2-mediated type-2 conditioning in adipose tissue. J. Exp. Med 216, 1999–2009 (2019). [DOI] [PMC free article] [PubMed] [Google Scholar]
- 29.Gupta OT & Gupta RK Visceral adipose tissue mesothelial cells: living on the edge or just taking up space? Trends Endocrinol Metab 26, 515–523 (2015). [DOI] [PubMed] [Google Scholar]
- 30.Wu D et al. Characterization of regulatory T cells in obese omental adipose tissue in humans. Eur. J. Immunol 49, 336–347 (2019). [DOI] [PubMed] [Google Scholar]
- 31.Laparra A et al. The frequencies of immunosuppressive cells in adipose tissue differ in human, non-human primate, and mouse models. Front Immunol. 10, 117 (2019). [DOI] [PMC free article] [PubMed] [Google Scholar]
- 32.Deiuliis J et al. Visceral adipose inflammation in obesity is associated with critical alterations in T regulatory cell numbers. PLoS. ONE. 6, e16376 (2011). [DOI] [PMC free article] [PubMed] [Google Scholar]
- 33.Lam AJ et al. Innate control of tissue-reparative human regulatory T cells. J. Immunol 202, 2195–2209 (2019). [DOI] [PubMed] [Google Scholar]
- 34.Tidball JG & Villalta SA Regulatory interactions between muscle and the immune system during muscle regeneration. Am. J Physiol Regul. Integr. Comp Physiol 298, R1173–R1187 (2010). [DOI] [PMC free article] [PubMed] [Google Scholar]
- 35.Villalta SA et al. Regulatory T cells suppress muscle inflammation and injury in muscular dystrophy. Sci Transl. Med 6, 258ra142 (2014). [DOI] [PMC free article] [PubMed] [Google Scholar]
- 36.Castiglioni A et al. FOXP3+ T cells recruited to sites of sterile skeletal muscle injury regulate the fate of satellite cells and guide effective tissue regeneration. PLoS. ONE. 10, e0128094 (2015). [DOI] [PMC free article] [PubMed] [Google Scholar]
- 37.Dispirito JR et al. Molecular diversification of regulatory T cells in nonlymphoid tissues. Sci Immunol 3, eaat5861 (2018). [DOI] [PMC free article] [PubMed] [Google Scholar]
- 38.Cho J, Kuswanto W, Benoist C, & Mathis D T cell receptor specificity drives accumulation of a reparative population of regulatory T cells within acutely injured skeletal muscle. Proc Natl Acad Sci U S A 116, 26727–26733 (2019). [DOI] [PMC free article] [PubMed] [Google Scholar]
- 39.Kuswanto W et al. Poor repair of skeletal muscle in aging mice reflects a defect in local, interleukin-33-dependent accumulation of regulatory T cells. Immunity 44, 355–367 (2016). [DOI] [PMC free article] [PubMed] [Google Scholar]
- 40.Jang YC et al. Skeletal muscle stem cells: effects of aging and metabolism on muscle regenerative function. Cold Spring Harb. Symp. Quant. Biol 76, 101–111 (2011). [DOI] [PubMed] [Google Scholar]
- 41.Wang K et al. Neuronal, stromal, and T-regulatory cell crosstalk in murine skeletal muscle. Proc. Natl. Acad. Sci. U. S. A 117, 5402–5408 (2020). [DOI] [PMC free article] [PubMed] [Google Scholar]
- 42.Boothby IC, Cohen JN, & Rosenblum MD Regulatory T cells in skin injury: At the crossroads of tolerance and tissue repair. Sci. Immunol 5, eaaz9631 (2020). [DOI] [PMC free article] [PubMed] [Google Scholar]
- 43.Belkaid Y et al. CD4+CD25+ regulatory T cells control Leishmania major persistence and immunity. Nature 420, 502–507 (2002). [DOI] [PubMed] [Google Scholar]
- 44.Scharschmidt TC et al. A wave of regulatory T cells into neonatal skin mediates tolerance to commensal microbes. Immunity 43, 1011–1021 (2015). [DOI] [PMC free article] [PubMed] [Google Scholar]
- 45.Scharschmidt TC et al. Commensal microbes and hair follicle morphogenesis coordinately drive treg migration into neonatal skin. Cell Host Microbe 21, 467–477 (2017). [DOI] [PMC free article] [PubMed] [Google Scholar]
- 46.Sather BD et al. Altering the distribution of Foxp3(+) regulatory T cells results in tissue-specific inflammatory disease. J. Exp. Med 204, 1335–1347 (2007). [DOI] [PMC free article] [PubMed] [Google Scholar]
- 47.Dudda JC, Perdue N, Bachtanian E, & Campbell DJ Foxp3+ regulatory T cells maintain immune homeostasis in the skin. J. Exp. Med 205, 1559–1565 (2008). [DOI] [PMC free article] [PubMed] [Google Scholar]
- 48.Rubtsov YP et al. Regulatory T cell-derived interleukin-10 limits inflammation at environmental interfaces. Immunity 28, 546–558 (2008). [DOI] [PubMed] [Google Scholar]
- 49.Kim JM, Rasmussen JP, & Rudensky AY Regulatory T cells prevent catastrophic autoimmunity throughout the lifespan of mice. Nat. Immunol 8, 191–197 (2007). [DOI] [PubMed] [Google Scholar]
- 50.Remedios KA et al. The TNFRSF members CD27 and OX40 coordinately limit TH17 differentiation in regulatory T cells. Sci. Immunol 3, eaau2042 (2018). [DOI] [PubMed] [Google Scholar]
- 51.Malhotra N et al. RORalpha-expressing T regulatory cells restrain allergic skin inflammation. Sci. Immunol 3, eaao6923 (2018). [DOI] [PMC free article] [PubMed] [Google Scholar]
- 52.Ali N et al. Regulatory T cells in skin facilitate epithelial stem cell differentiation. Cell 169, 1119–1129 (2017). [DOI] [PMC free article] [PubMed] [Google Scholar]
- 53.Nosbaum A et al. Regulatory T cells facilitate cutaneous wound healing. J Immunol 196, 2010–2014 (2016). [DOI] [PMC free article] [PubMed] [Google Scholar]
- 54.Mathur AN et al. Treg-cell control of a CXCL5-IL-17 inflammatory axis promotes hair-follicle-stem-cell differentiation during skin-barrier repair. Immunity. 50, 655–667 (2019). [DOI] [PMC free article] [PubMed] [Google Scholar]
- 55.Kalekar LA et al. Regulatory T cells in skin are uniquely poised to suppress profibrotic immune responses. Sci. Immunol 4, eaaw2910 (2019). [DOI] [PMC free article] [PubMed] [Google Scholar]
- 56.Shime H et al. Proenkephalin+ regulatory T cells expanded by ultraviolet B exposure maintain skin homeostasis with a healing function. Proc. Natl. Acad. Sci. U. S. A 117, 20696–20705 (2020). [DOI] [PMC free article] [PubMed] [Google Scholar]
- 57.Delacher M et al. Precursors for nonlymphoid-tissue Treg cells reside in secondary lymphoid organs and are programmed by the transcription factor BATF. Immunity. 52, 295–312 (2020). [DOI] [PMC free article] [PubMed] [Google Scholar]
- 58.Gratz IK et al. Memory regulatory t cells require IL-7 and not IL-2 for their maintenance in peripheral tissues. J Immunol 190, 4483–4487 (2013). [DOI] [PMC free article] [PubMed] [Google Scholar]
- 59.Clark RA & Kupper TS IL-15 and dermal fibroblasts induce proliferation of natural regulatory T cells isolated from human skin. Blood 109, 194–202 (2007). [DOI] [PMC free article] [PubMed] [Google Scholar]
- 60.Sanchez Rodriguez R et al. Memory regulatory T cells reside in human skin. J. Clin. Invest 124, 1027–1036 (2014). [DOI] [PMC free article] [PubMed] [Google Scholar]
- 61.Dhariwala MO et al. Developing human skin contains lymphocytes demonstrating a memory signature. Cell Rep Med 1, 100132 (2020). [DOI] [PMC free article] [PubMed] [Google Scholar]
- 62.Chatila TA et al. JM2, encoding a fork head-related protein, is mutated in X-linked autoimmunity-allergic disregulation syndrome. J Clin Invest 106, R75–R81 (2000). [DOI] [PMC free article] [PubMed] [Google Scholar]
- 63.Conteduca G et al. Single nucleotide polymorphisms in the promoter regions of Foxp3 and ICOSLG genes are associated with Alopecia areata. Clin. Exp. Med 14, 91–97 (2014). [DOI] [PubMed] [Google Scholar]
- 64.Castela E et al. Effects of low-dose recombinant interleukin 2 to promote T-regulatory cells in alopecia areata. JAMA Dermatol. 150, 748–751 (2014). [DOI] [PubMed] [Google Scholar]
- 65.Lowe MM et al. Regulatory T cells use arginase 2 to enhance their metabolic fitness in tissues. JCI. Insight. 4, e129756 (2019). [DOI] [PMC free article] [PubMed] [Google Scholar]
- 66.Bovenschen HJ et al. Foxp3+ regulatory T cells of psoriasis patients easily differentiate into IL-17A-producing cells and are found in lesional skin. J. Invest Dermatol 131, 1853–1860 (2011). [DOI] [PubMed] [Google Scholar]
- 67.Ahn R et al. RNA-seq and flow-cytometry of conventional, scalp, and palmoplantar psoriasis reveal shared and distinct molecular pathways. Sci. Rep 8, 11368 (2018). [DOI] [PMC free article] [PubMed] [Google Scholar]
- 68.Haxhinasto S, Mathis D, & Benoist C The AKT-mTOR axis regulates de novo differentiation of CD4+Foxp3+ cells. J Exp Med 205, 565–574 (2008). [DOI] [PMC free article] [PubMed] [Google Scholar]
- 69.Davies LC, Jenkins SJ, Allen JE, & Taylor PR Tissue-resident macrophages. Nat Immunol 14, 986–995 (2013). [DOI] [PMC free article] [PubMed] [Google Scholar]
- 70.Zhong J et al. T-cell costimulation protects obesity-induced adipose inflammation and insulin resistance. Diabetes 63, 1289–1302 (2014). [DOI] [PMC free article] [PubMed] [Google Scholar]
- 71.Schmidleithner L et al. Enzymatic activity of HPGD in Treg cells suppresses Tconv cells to maintain adipose tissue homeostasis and prevent metabolic dysfunction. Immunity 50, 1232–1248 (2019). [DOI] [PubMed] [Google Scholar]
- 72.Bapat SP et al. Depletion of fat-resident Treg cells prevents age-associated insulin resistance. Nature 528, 137–141 (2015). [DOI] [PMC free article] [PubMed] [Google Scholar]
- 73.Deng T et al. Adipocyte adaptive immunity mediates diet-induced adipose inflammation and insulin resistance by decreasing adipose Treg cells. Nature Comm. 8, 15725 (2017). [Google Scholar]
- 74.Zhao X-Y et al. The obesity-induced adipokine sST2 exacerbates adipose Treg and ILC2 depletion and promotes insulin resistance. Science Adv. 6, eaay6191 (2020). [DOI] [PMC free article] [PubMed] [Google Scholar]
- 75.Pettersson US et al. Female mice are protected against high-fat diet induced metabolic syndrome and increase the regulatory T cell population in adipose tissue. PLoS. ONE. 7, e46057 (2012). [DOI] [PMC free article] [PubMed] [Google Scholar]
- 76.Ishikawa A et al. Estrogen regulates sex-specific localization of regulatory T cells in adipose tissue of obese female mice. PLoS One 15, e0230885 (2020). [DOI] [PMC free article] [PubMed] [Google Scholar]
- 77.Kälin S et al. A Stat6/Pten axis links regulatory T cells with adipose tissue function. Cell Metab 26, 475–492 (2017). [DOI] [PMC free article] [PubMed] [Google Scholar]
- 78.Fang W et al. Regulatory T cells promote adipocyte beiging in subcutaneous adipose tissue. FASEB J. 34, 9755–9770 (2020). [DOI] [PubMed] [Google Scholar]
- 79.Medrikova D et al. Brown adipose tissue harbors a distinct sub-population of regulatory T cells. PLoS. ONE. 10, e0118534 (2015). [DOI] [PMC free article] [PubMed] [Google Scholar]
- 80.Mock JR et al. Foxp3+ regulatory T cells promote lung epithelial proliferation. Mucosal. Immunol 7, 1440–1451 (2014). [DOI] [PMC free article] [PubMed] [Google Scholar]
- 81.Dial CF, Tune MK, Doerschuk CM, & Mock JR Foxp3+ regulatory T cell expression of keratinocyte growth factor enhances lung epithelial proliferation. Am. J. Respir. Cell Mol. Biol 57, 162–173 (2017). [DOI] [PMC free article] [PubMed] [Google Scholar]
- 82.Weirather J et al. Foxp3+ CD4+ T cells improve healing after myocardial infarction by modulating monocyte/macrophage differentiation. Circ. Res 115, 55–67 (2014). [DOI] [PubMed] [Google Scholar]
- 83.Li J et al. Regulatory T-cells regulate neonatal heart regeneration by potentiating cardiomyocyte proliferation in a paracrine manner. Theranostics. 9, 4324–4341 (2019). [DOI] [PMC free article] [PubMed] [Google Scholar]
- 84.Dombrowski Y et al. Regulatory T cells promote myelin regeneration in the central nervous system. Nat Neurosci. 20, 674–680 (2017). [DOI] [PMC free article] [PubMed] [Google Scholar]
- 85.Whibley N, Tucci A, & Powrie F Regulatory T cell adaptation in the intestine and skin. Nat Immunol 20, 386–396 (2019). [DOI] [PubMed] [Google Scholar]
- 86.Leung OM et al. Regulatory T cells promote apelin-mediated sprouting angiogenesis in type 2 diabetes. Cell Rep. 24, 1610–1626 (2018). [DOI] [PubMed] [Google Scholar]
- 87.Hui SP et al. Zebrafish regulatory T cells mediate organ-specific regenerative programs. Dev. Cell 43, 659–672 (2017). [DOI] [PubMed] [Google Scholar]
- 88.Arnold L et al. Inflammatory monocytes recruited after skeletal muscle injury switch into antiinflammatory macrophages to support myogenesis. J Exp. Med 204, 1057–1069 (2007). [DOI] [PMC free article] [PubMed] [Google Scholar]
- 89.Panduro M, Benoist C, & Mathis D Treg cells limit IFN-gamma production to control macrophage accrual and phenotype during skeletal muscle regeneration. Proc Natl Acad Sci U S A 115, E2585–E2593 (2018). [DOI] [PMC free article] [PubMed] [Google Scholar]
- 90.Liesz A et al. Regulatory T cells are key cerebroprotective immunomodulators in acute experimental stroke. Nat Med 15, 192–199 (2009). [DOI] [PubMed] [Google Scholar]
- 91.Biton M et al. T helper cell cytokines modulate intestinal stem cell renewal and differentiation. Cell 175, 1307–1320 (2018). [DOI] [PMC free article] [PubMed] [Google Scholar]
- 92.Agudo J et al. Quiescent tissue stem cells evade immune surveillance. Immunity. 48, 271–285 (2018). [DOI] [PMC free article] [PubMed] [Google Scholar]
- 93.Sato T et al. Regulated IFN signalling preserves the stemness of intestinal stem cells by restricting differentiation into secretory-cell lineages. Nat. Cell Biol 22, 919–926 (2020). [DOI] [PubMed] [Google Scholar]
- 94.Fujisaki J et al. In vivo imaging of Treg cells providing immune privilege to the haematopoietic stem-cell niche. Nature 474, 216–219 (2011). [DOI] [PMC free article] [PubMed] [Google Scholar]
- 95.Hirata Y et al. CD150high bone marrow Tregs maintain hematopoietic stem cell quiescence and immune privilege via adenosine. Cell Stem Cell 22, 445–453 (2018). [DOI] [PMC free article] [PubMed] [Google Scholar]
- 96.Yang S et al. Regulatory T cells generated early in life play a distinct role in maintaining self-tolerance. Science 348, 589–594 (2015). [DOI] [PMC free article] [PubMed] [Google Scholar]
- 97.Stadinski BD et al. A temporal thymic selection switch and ligand binding kinetics constrain neonatal Foxp3+ Treg cell development. Nat. Immunol 20, 1046–1058 (2019). [DOI] [PMC free article] [PubMed] [Google Scholar]
- 98.Sefik E et al. Individual intestinal symbionts induce a distinct population of RORγ+ regulatory T cells. Science 349, 993–997 (2015). [DOI] [PMC free article] [PubMed] [Google Scholar]
- 99.Samstein RM et al. Extrathymic generation of regulatory T cells in placental mammals mitigates maternal-fetal conflict. Cell 150, 29–38 (2012). [DOI] [PMC free article] [PubMed] [Google Scholar]
- 100.Zheng Y et al. Role of conserved non-coding DNA elements in the Foxp3 gene in regulatory T-cell fate. Nature 463, 808–812 (2010). [DOI] [PMC free article] [PubMed] [Google Scholar]
- 101.Miragaia RJ et al. Single-cell transcriptomics of regulatory T cells reveals trajectories of tissue adaptation. Immunity 50, 493–504 (2019). [DOI] [PMC free article] [PubMed] [Google Scholar]
- 102.Sullivan JM, Höllbacher B, & Campbell DJ Dynamic expression of Id3 defines the stepwise differentiation of tissue-resident regulatory T cells. J Immunol 202, 31–36 (2019). [DOI] [PMC free article] [PubMed] [Google Scholar]
- 103.Yang B-H et al. TCF1 and LEF1 control Treg competitive survival and Tfr development to prevent autoimmune diseases. Cell Rep 27, 3629–3645 (2019). [DOI] [PMC free article] [PubMed] [Google Scholar]
- 104.Sidwell T et al. Attenuation of TCR-induced transcription by Bach2 controls regulatory T cell differentiation and homeostasis. Nat. Commun 11, 252 (2020). [DOI] [PMC free article] [PubMed] [Google Scholar]
- 105.Hayatsu N et al. Analyses of a mutant Foxp3 allele reveal BATF as a critical transcription factor in the differentiation and accumulation of tissue regulatory T cells. Immunity 47, 268–283 (2017). [DOI] [PubMed] [Google Scholar]
- 106.Cretney E et al. The transcription factors Blimp-1 and IRF4 jointly control the differentiation and function of effector regulatory T cells. Nat Immunol. 12, 304–311 (2011). [DOI] [PubMed] [Google Scholar]
- 107.Garg G et al. Blimp1 prevents methylation of Foxp3 and loss of regulatory T cell identity at sites of inflammation. Cell Rep. 26, 1854–1868 (2019). [DOI] [PMC free article] [PubMed] [Google Scholar]
- 108.Frias AB Jr. et al. The transcriptional regulator Id2 is critical for adipose-resident regulatory T cell differentiation, survival, and function. J Immunol 203, 658–664 (2019). [DOI] [PMC free article] [PubMed] [Google Scholar]
- 109.Leonard JD et al. Identification of natural regulatory T cell epitopes reveals convergence on a dominant autoantigen. Immunity. 47, 107–117 (2017). [DOI] [PMC free article] [PubMed] [Google Scholar]
- 110.Yissachar N et al. An intestinal organ culture system uncovers a role for the nervous system in microbe-immune crosstalk. Cell 168, 1135–1148 (2017). [DOI] [PMC free article] [PubMed] [Google Scholar]
- 111.Neumann C et al. c-Maf-dependent Treg cell control of intestinal TH17 cells and IgA establishes host-microbiota homeostasis. Nat Immunol 20, 471–481 (2019). [DOI] [PubMed] [Google Scholar]
- 112.Li A et al. IL-33 signaling alters regulatory T cell diversity in support of tumor development. Cell Rep. 29, 2998–3008 (2019). [DOI] [PMC free article] [PubMed] [Google Scholar]
- 113.Hirrlinger J et al. Split-cre complementation indicates coincident activity of different genes in vivo. PLoS. ONE. 4, e4286 (2009). [DOI] [PMC free article] [PubMed] [Google Scholar]
- 114.Hirrlinger J et al. Split-CreERT2: temporal control of DNA recombination mediated by split-Cre protein fragment complementation. PLoS. ONE. 4, e8354 (2009). [DOI] [PMC free article] [PubMed] [Google Scholar]
- 115.Klinghammer K, Walther W, & Hoffmann J Choosing wisely - Preclinical test models in the era of precision medicine. Cancer Treat. Rev 55, 36–45 (2017). [DOI] [PubMed] [Google Scholar]