

Abstract
Background
Inhibitors of the sodium‐glucose linked transporter 2 improve cardiovascular outcomes in patients with or without type 2 diabetes mellitus, but the effects on cardiac energetics and mitochondrial function are unknown. We assessed the effects of sodium‐glucose linked transporter 2 inhibition on mitochondrial function, high‐energy phosphates, and genes encoding mitochondrial proteins in hearts of mice with and without diet‐induced diabetic cardiomyopathy.
Methods and Results
Mice fed a control diet or a high‐fat, high‐sucrose diet received ertugliflozin mixed with the diet (0.5 mg/g of diet) for 4 months. Isolated mitochondria were assessed for functional capacity. High‐energy phosphates were assessed by 31P nuclear magnetic resonance spectroscopy concurrently with contractile performance in isolated beating hearts. The high‐fat, high‐sucrose diet caused myocardial hypertrophy, diastolic dysfunction, mitochondrial dysfunction, and impaired energetic response, all of which were prevented by ertugliflozin. With both diets, ertugliflozin caused supernormalization of contractile reserve, as measured by rate×pressure product at high work demand. Likewise, the myocardial gene sets most enriched by ertugliflozin were for oxidative phosphorylation and fatty acid metabolism, both of which were enriched independent of diet.
Conclusions
Ertugliflozin not only prevented high‐fat, high‐sucrose–induced pathological cardiac remodeling, but improved contractile reserve and induced the expression of oxidative phosphorylation and fatty acid metabolism gene sets independent of diabetic status. These effects of sodium‐glucose linked transporter 2 inhibition on cardiac energetics and metabolism may contribute to improved structure and function in cardiac diseases associated with mitochondrial dysfunction, such as heart failure.
Keywords: cardiac metabolism, diabetic cardiomyopathy, energetics, mitochondria, sodium‐glucose linked transporter 2 inhibitor
Subject Categories: Heart Failure, Metabolic Syndrome, Metabolism, Cellular Reprogramming
Nonstandard Abbreviations and Acronyms
- CD
control diet
- DCMP
diabetic cardiomyopathy
- FAM
fatty acid metabolism
- FAO
fatty acid oxidation
- GO
Gene Ontology
- GSEA
Gene Set Enrichment Analysis
- HFHS
high fat, high sucrose
- NES
normalized enrichment score
- OXPHOS
oxidative phosphorylation
- ROS
reactive oxygen species
- RPP
rate pressure product
- SGLT2
sodium‐glucose linked transporter 2
Clinical Perspective
What Is New?
In mice with diet‐induced diabetic cardiomyopathy, the sodium‐glucose linked transporter 2 inhibitor ertugliflozin prevented myocardial hypertrophy, fibrosis, and diastolic dysfunction.
In diabetic mice, ertugliflozin preserved isolated mitochondrial function and improved myocardial energetics measured by 31P nuclear magnetic resonance spectroscopy in the beating heart.
In both diabetic and nondiabetic (control) hearts, ertugliflozin increased the contractile reserve elicited by increased work demand to supernormal levels, and in both diabetic and control hearts, ertugliflozin induced coordinated expression of genes expected to increase oxidative phosphorylation and the use of fatty acids as fuel.
What Are the Clinical Implications?
The effect of ertugliflozin to cause a broad reprogramming of myocardial metabolism and improve energetics, independent of diabetes mellitus, may contribute to the mechanism responsible for the beneficial effects of sodium‐glucose linked transporter 2 inhibitors in patients with heart failure with or without diabetes mellitus.
These effects on myocardial metabolism and function suggest that sodium‐glucose linked transporter 2 inhibition may be valuable in the treatment of myocardial diseases, in addition to heart failure, that are associated with mitochondrial dysfunction, independent of diabetes mellitus.
Patients with obesity‐related type 2 diabetes mellitus develop diabetic cardiomyopathy (DCMP), a phenotype that is characterized by left ventricular (LV) hypertrophy and diastolic dysfunction.1, 2, 3, 4 A key pathophysiologic feature of DCMP is mitochondrial dysfunction that leads to decreased production of ATP and excessive release of reactive oxygen species (ROS).5, 6 Decreased ATP production limits the heart's ability to perform hemodynamic work, thereby restricting cardiac contractile reserve, and impairs other ATP‐dependent enzymes involved in sodium and calcium homeostasis. Another characteristic of mitochondrial dysfunction is excessive release of ROS that play a central role in driving pathologic remodeling in DCMP.5
Inhibition of the sodium‐glucose linked transporter 2 (SGLT2), a treatment for type 2 diabetes mellitus, has been shown to decrease heart failure hospitalization and cardiovascular mortality in patients with7, 8, 9, 10 and without11, 12 diabetes mellitus. These provocative results have ignited a search for the mechanism by which SGLT2 inhibitors act. Several mechanisms have been suggested, including glycemic control, sodium diuresis, inhibition of the myocyte sodium/hydrogen exchanger, increased ketones serving as a “super fuel,” increased glucagon secretion, and modulation of myocyte calcium homeostasis.13 In addition, there is evidence that SGLT2 inhibition improves mitochondrial function in diabetes mellitus: in db/db mice, SGLT2 inhibition corrected the cardiac energetic deficit, as assessed by measurement of substrate use.14 Surprisingly, SGLT2 inhibition also appears to improve cardiac metabolic function in the absence of diabetes mellitus: in normoglycemic pigs with heart failure post‐myocardial infarction, SGLT2 inhibition preserved myocardial ATP content.15 Likewise, in nondiabetic mice with heart failure attributable to pressure overload, SGLT2 inhibition improved cardiac function in working hearts.16 Of note, none of the aforementioned studies included controls treated with SGLT2 inhibitors.
Mice fed a high‐fat, high‐sucrose (HFHS) “Western” diet become obese and develop type 2 diabetes mellitus.4 We have shown that these mice exhibit a cardiac phenotype similar to patients with obesity‐related type 2 diabetes mellitus with LV hypertrophy, diastolic dysfunction, decreased mitochondrial ATP production, excessive mitochondrial ROS release, and an impaired cardiac energetic response to increased work demand.5, 17, 18 In mice fed a HFHS diet, transgenic overexpression of catalase targeted to mitochondria corrects cardiac energetics and prevents several features of the cardiac phenotype, including diastolic dysfunction, myocyte hypertrophy, and interstitial fibrosis,5, 18suggesting that mitochondrial dysfunction with excessive ROS production plays a pivotal role in mediating the cardiac phenotype. The primary goals of this study were to (1) test whether SGLT2 inhibition by long‐term administration of ertugliflozin to mice with obesity‐related diabetes mellitus would prevent mitochondrial dysfunction, as reflected by ROS release, ATP production, and myocardial energetics; and (2) determine if the effects of SGLT2 inhibition on mitochondrial function were dependent on the presence of diabetes mellitus, which was assessed in ertugliflozin‐treated control mice.
Methods
The authors declare that all supporting data are available within the article and its supplemental materials.
Experimental Animals
Eight‐week‐old male C57BL/6J mice (Jackson Laboratory) were randomized by body weight to 1 of 4 experimental groups: (1) control diet (CD; 10% kcal lard, 0% sucrose; D09071703; Research Diets), (2) CD formulated with ertugliflozin (0.5 mg/g of diet; Merck), (3) HFHS diet (58% kcal lard, 28% sucrose; D09071702; Research Diets), or (4) HFHS formulated with ertugliflozin (0.5 mg/g of diet; Merck). The ertugliflozin dose used (0.5 mg/g of diet) is the dose identified in preclinical rodent studies, which were based on urinary glucose excretion and formed the basis for selection of the dose used in humans.19 All diets were formulated at Research Diets, and all animals were fed their respective diet for 4 months. Body weight and food consumption were measured weekly. Weekly caloric consumption per mouse was calculated as grams of diet consumed×4.05 kcal/g for CD‐based diets or as grams of diet consumed×5.54 kcal/g for HFHS‐based diets.5 The protocol was approved by the Institutional Animal Care and Use Committee at Boston University School of Medicine.
Fasting Blood Measurements
Blood was collected from the tail vein of mice fasted overnight. Whole blood was used to measure blood glucose by a ContourNext glucometer (Bayer) and hemoglobin A1c (Crystal Chem) per manufacturer's instructions. Remaining blood samples were centrifuged to separate the plasma, and plasma insulin levels were measured by UltraSensitive Mouse Insulin ELISA kit (Crystal Chem), according to manufacturer's instructions. The homeostasis model assessment of insulin resistance index was calculated using the formula: (fasting blood glucose [mg/dL]×fasting plasma insulin [μU/mL])÷405.
Echocardiography
Two‐dimensional, M‐mode, and Doppler echocardiography was used to measure LV dimensions and function, as previously described.4 A VisualSonics Vevo 2100 high‐resolution imaging system equipped with a 22‐ to 55‐mHz MS550D transducer was used for data capture and analysis.
Organ Weight and Histology
Mice were euthanized at the end of the study. Hearts were weighed, atria and right ventricle were removed, and left ventricles with septum were weighed. Tissue was divided into 3 pieces: (1) flash frozen in liquid nitrogen, (2) fixed in 10% buffered formalin, and (3) processed to isolate mitochondria (see next section). A leg from each animal was removed to obtain tibia length for heart weight normalization. Formalin‐fixed tissues were embedded in paraffin, sectioned, and stained.
Myocyte cross‐sectional area, fibrosis (Picrosirius Red), and 4‐hydroxynonenal were measured and analyzed, as previously described.4, 18 To assess myocyte cross‐sectional area, sections were stained with hematoxylin and eosin and examined under a light microscope (BX40; Olympus). Five random fields from each of 2 sections per animal were analyzed so that 60 myocytes per animal were quantified. Myocyte cross‐sectional area was calculated using NIH ImageJ software. To assess fibrosis, sections were stained with Picrosirius Red Stain Kit (Polysciences) and examined under a light microscope (BX40; Olympus). Mean percentage of fibrosis was determined from 10 random fields per heart and quantified using NIH ImageJ software. For 4‐hydroxynonenal immunohistochemical staining, sections were blocked in 10% goat serum in PBS, incubated with mouse anti–4‐hydroxynonenal monoclonal antibody (Percipio Biosciences), and then incubated with goat biotin‐conjugated anti‐mouse IgG (Vector Laboratories). The sections were incubated with avidin and biotinylated horseradish peroxidase macromolecular complex (Vector Laboratories) and stained with 3‐amino‐9‐ethylcarbazole (Vector Laboratories) and hematoxylin (Vector Laboratories). For a negative control, the primary antibody was omitted for normal mouse IgG. The samples were examined under a light microscope (BX40; Olympus). Ten color images of 4‐hydroxynonenal staining were randomly selected from 2 sections of the heart and photographed at a magnification of ×40. The area and intensity of staining were scored in a blinded manner for quantification as follows: 0, no visible staining; 1, faint staining; 2, moderate staining; and 3, strong staining.20
Isolated Mitochondria Studies
Ventricular tissue was homogenized, subjected to 2‐step centrifugation to isolate a crude extract of intact mitochondria, and mitochondrial H2O2 production and ATP synthesis were measured, as we have previously described.5 Briefly, mitochondria H2O2 production was measured via Amplex Ultra Red horseradish peroxidase fluorescence method (Invitrogen), using succinate (5 mmol/L) and rotenone (2 μmol/L) to drive catalase‐inhibited H2O2 production. H2O2 production was determined by measuring the slope of the increase in fluorescence (excitation wavelength of 545 nm and emission wavelength of 590 nm) over a 20‐minute period (measuring at 30‐second intervals) with 10 μg of mitochondrial protein per well.
ATP synthesis was determined via a luciferin/luciferase‐based ATP bioluminescence assay kit (Roche) also using succinate and rotenone to drive oligomycin‐sensitive ATP synthesis. ATP production was measured using the initial slope of the increase in ATP‐supported luciferase chemiluminescence (≈40–60 seconds, measuring at 6‐second intervals) after subtracting background and nonmitochondrial ATP values, with 10 μg of mitochondrial protein per well. Both assays were read on a Tecan M1000 Pro multimode plate reader at room temperature. Each run included one mouse from each experimental group (CD, ertugliflozin CD, HFHS, and ertugliflozin HFHS). The results for both assays are reported as the percentage change relative to the CD animal included in each run to account for day‐to‐day assay variability.
LV Contractile Function and High‐Energy Phosphates Assessed by 31P Nuclear Magnetic Resonance Spectroscopy
LV contractile function was assessed in a Langendorff heart preparation, as previously described.17, 18, 21 Hearts were perfused with Krebs‐Henseleit buffer containing 10 mmol/L glucose and 0.5 mmol/L pyruvate. A water‐filled balloon was inserted into the LV to measure LV pressure and adjust LV volume. LV developed pressure was calculated as: developed pressure=systolic pressure−end diastolic pressure. Perfused hearts were placed in a 10‐mm glass tube in a 9.4‐T vertical bore magnet and maintained at 37°C throughout the protocol. [ATP], [phosphocreatine], [inorganic phosphate], and intracellular pH (pH) were measured using a 31P nuclear magnetic resonance Varian spectrometer at 161.4 MHz. Each 31P nuclear magnetic resonance spectrum resulted from the average of 208 free induction decay signals over 8 minutes.
After initial stabilization for 30 minutes, balloon volume was adjusted to achieve an end diastolic pressure of 8 to 9 mm Hg, and held constant during the rest of the protocol. LV work demand was changed by increasing the concentration of CaCl2 in the Krebs‐Henseleit buffer from 2 to 4 mmol/L and increasing the pacing rate from 450 to 600 beats per minute. Hearts were perfused at baseline workload (450 beats per minute, 2 mmol/L CaCl2) for 2 measurements (8 minutes each measurement) and at high workload (600 beats per minute, 4 mmol/L CaCl2) for another 2 measurements. The measurements were averaged for each condition. Work performed was estimated as the rate pressure product (RPP)=developed pressure×heart rate.17
RNA Isolation, RNA Sequencing, and Sequencing Analysis
Frozen LV tissue from 4 representative hearts per group (based on LV wall thickness and velocity of tissue relaxation (Em) measured by tissue Doppler echocardiography) was homogenized, and mRNA was extracted with the RNeasy Universal Mini Kit (Qiagen) according to manufacturer's instructions. The Boston University Microarray and Sequencing Resource Core Facility performed RNA quantity and quality measurements, library preparations, RNA sequencing, and analyses. Sequencing libraries were generated using the NEBNext Ultra II RNA kit with poly(A) selection and run on an Illumina NextSeq 500 platform with 75‐bp paired‐end reads.
FASTQ files were aligned to mouse genome build mm10 using STAR22 (version 2.6.0c), and assessed for quality using FastQC (version 0.11.7) and RSeQC (version 3.0.0). Ensembl‐Gene–level counts for nonmitochondrial genes were generated using featureCounts (Subread package, version 1.6.2) and Ensembl annotation build 92 (uniquely aligned proper pairs, same strand). Separately, SAMtools (version 1.9) was used to count reads aligning in proper pairs at least once to either strand of the mitochondrial chromosome or to the sense or antisense strands of Ensembl loci of gene biotype "rRNA" or of nonmitochondrial RepeatMasker loci of class "rRNA" (as defined in the RepeatMasker track retrieved from the University of California, Santa Cruz, Table Browser). This resulted in uniquely aligned non–mitochondrial chromosome coverage averaging 19.5 million reads per sample and >90% aligned to a single gene, with identification of roughly 28 000 individual genes. Differential expression was assessed using the Wald test implemented in the DESeq2 R package (version 1.22.1).23 Correction for multiple hypothesis testing was accomplished using the Benjamini‐Hochberg false discovery rate. Human homologs of mouse genes were identified using HomoloGene (version 68). The full data set has been deposited in the National Center for Biotechnology Information Gene Expression Omnibus repository (Gene Expression Omnibus Series Identifier GSE161827).
Gene Set Enrichment Analysis (GSEA) (version 2.2.1)24 was used to identify biological terms, pathways, and processes that are coordinately upregulated or downregulated within each pairwise comparison. The Entrez Gene identifiers of the human homologs of all genes in the Ensembl Gene annotation were ranked by the Wald statistic computed for each effect in the 2‐factor model, as well as for each pairwise comparison. Ensembl Genes matching multiple mouse Entrez Gene identifiers, and mouse genes with multiple human homologs (or vice versa), were excluded before ranking, so that the ranked list represents only those human Entrez Gene Identifiers that match exactly one mouse Ensembl Gene. Each ranked list was then used to perform preranked GSEAs (default parameters with random seed 1234) using gene sets obtained from the Molecular Signatures Database, version 6.0,25 including Gene Ontology (GO) and Hallmark gene sets.
Gene set size is the number of genes in the gene set that overlap with the genes in the ranked list. Enrichment scores, a measure of skewness of each gene set (positive or negative), correspond to a trend for predominately upregulated or downregulated genes with respect to the reference group. Enrichment scores are normalized as the ratio of the observed enrichment score/the mean enrichment score computed across 1000 random distributions of the members of the gene set across the ranked list. Because this is a permutation calculation, the finding of “zero” occurrences yields nominal P values and false discovery rate–corrected P values <0.001 (ie, 1/number of permutations). To aid in interpretation of GSEA results, enrichment plots and coordinating leading‐edge heat maps were generated from each ranked list. The colors for each matrix were assigned as z‐scores normalized to a mean of 0 and SD of 1 across all samples in each row, based on the regularized logarithm transformed expression values for each gene across all samples. These z‐scores were then trimmed to the range −2 (blue) to 2 (red). All RNA sequencing–related analyses were performed using the R environment for statistical computing (version 3.5.1).
Statistical Analysis
All data are presented as mean±SEM. Normality was determined using the Shapiro‐Wilk test. For normally distributed data, 1‐ or 2‐way ANOVA with Bonferroni correction for multiple comparisons was performed. Kruskal‐Wallis with Dunn correction for multiple comparisons was used for not normally distributed data. Specific statistical tests are indicated in figure legends. GraphPad Prism 9 software was used for calculations. A P<0.05 was considered statistically significant.
Results
Ertugliflozin Decreases Weight Gain and Prevents Insulin Resistance in HFHS‐Fed Mice
Mice on the HFHS diet consumed more calories and gained more weight than mice on the CD (Figure S1). The difference in weight was evident by 1 month on diet and persisted for the duration of the study. Ertugliflozin‐treated mice on either diet gained less weight over time than their respective control groups, despite no sustained difference in diet‐specific caloric intake. In HFHS‐fed mice, glycated hemoglobin percentage (Figure 1A), fasting blood glucose (Figure 1B), fasting insulin (Figure 1C), and the homeostasis model assessment of insulin resistance index (Figure 1D) were increased compared with CD‐fed mice, and all were normalized by treatment with ertugliflozin. Thus, ertugliflozin ameliorated the major systemic hallmarks of diabetes mellitus.
Figure 1. Antidiabetic effects of ertugliflozin (ERTU).
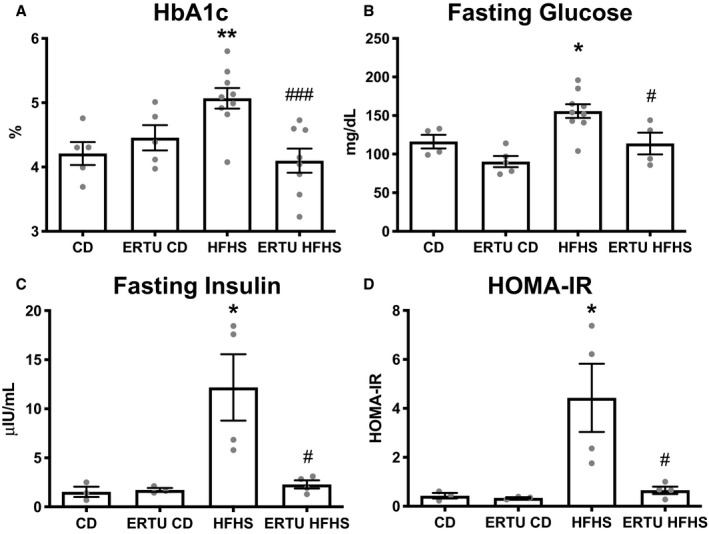
Mice fed a high‐fat, high‐sucrose (HFHS) diet for 4 months developed type 2 diabetes mellitus with elevation of hemoglobin A1c (HbA1c) (A), fasting glucose (B), fasting insulin (C), and homeostasis model assessment of insulin resistance (HOMA‐IR) (D), all of which were prevented by concomitant treatment with ERTU added to the diet (*P<0.05, **P<0.01 vs control diet [CD]; # P<0.05, ### P<0.001 vs HFHS; 1‐way ANOVA with Bonferroni correction for all; data presented as mean±SEM). The n per group for CD, ERTU/CD, HFHS, ERTU/HFHS is as follows: A, 5/5/9/8; B, 4/5/9/4; C and D, 3/3/4/4.
Ertugliflozin Prevents Cardiac Hypertrophy in HFHS‐Fed Mice
As expected,4 LV weight, wall thickness, and LV mass were increased in HFHS‐fed mice (Figure 2A through 2C), and were prevented by ertugliflozin treatment. LV end‐diastolic dimension, end‐systolic dimension, and fractional shortening were not affected by HFHS feeding or ertugliflozin treatment (Figure S2). In HFHS‐fed mice, the transmitral flow velocity Doppler‐measured E/A ratio and the tissue Doppler‐measured myocardial relaxation rate Em were decreased (Figure 2D and 2E), indicative of diastolic dysfunction. Likewise, the ratio of the transmitral Doppler E wave to the tissue Doppler relaxation rate (E/Em) was elevated (Figure 2F), indicative of left atrial pressure elevation. E/A, Em, and E/Em were all normalized by ertugliflozin treatment.
Figure 2. Ertugliflozin (ERTU) prevents left ventricular (LV) hypertrophy and diastolic dysfunction in high‐fat, high‐sucrose (HFHS)–fed mice.
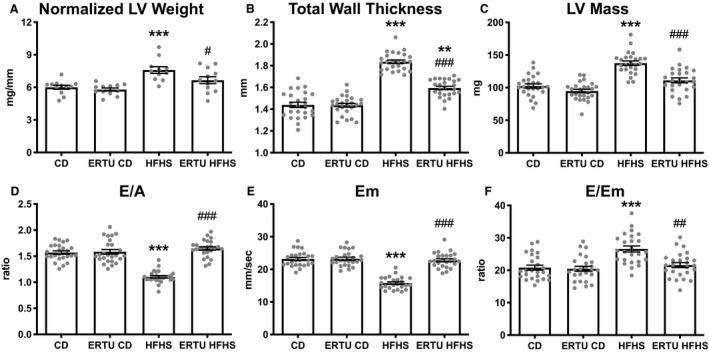
Mice fed an HFHS diet for 4 months developed LV hypertrophy and diastolic dysfunction, both of which were prevented by concomitant ERTU treatment. Shown are LV wet weight relative to tibia length (A), total LV wall thickness measured by echocardiography (B), LV mass derived from echocardiographic measurements (C), transmitral flow velocity E/A ratio measured by Doppler echocardiography (D), velocity of tissue relaxation (Em) measured by tissue Doppler echocardiography (E), and the ratio of E/Em, an index of left atrial pressure (F) (**P<0.01, ***P<0.001 vs control diet [CD]; # P<0.05, ## P<0.01, ### P<0.001 vs HFHS; 1‐way ANOVA with Bonferroni correction for all, except D and F, in which Kruskal‐Wallis with Dunn correction was performed; data presented as mean±SEM). For A, n=12/group; for B through F, n=25/group.
Cardiac myocyte size, assessed as cross‐sectional area, was markedly increased in HFHS‐fed mice, and the increase was prevented by ertugliflozin treatment (Figure S3A and S3B). Interstitial fibrosis, assessed by Picrosirius staining, was increased in HFHS‐fed mice, and the increase was prevented by ertugliflozin (Figure S3C and S3D).
Ertugliflozin Prevents Cardiac Mitochondrial Dysfunction and Attenuates Oxidative Stress in HFHS‐Fed Mice
As we have previously reported,5, 26 HFHS feeding led to an increase in the rate of hydrogen peroxide released from freshly isolated cardiac mitochondria (Figure 3A) and a decrease in the maximal rate of ATP synthesis (Figure 3B). Ertugliflozin treatment both prevented the increase in hydrogen peroxide release and preserved maximal ATP production. Histological staining was performed to assess the level of 4‐hydroxynonenal adducts, which are reflective of myocardial oxidative stress. HFHS feeding increased the level of 4‐hydroxynonenal adducts, and the increase was inhibited by ertugliflozin treatment (Figure 3C and 3D).
Figure 3. Ertugliflozin (ERTU) prevents mitochondrial dysfunction and myocardial oxidative stress in high‐fat, high‐sucrose (HFHS)–fed mice.
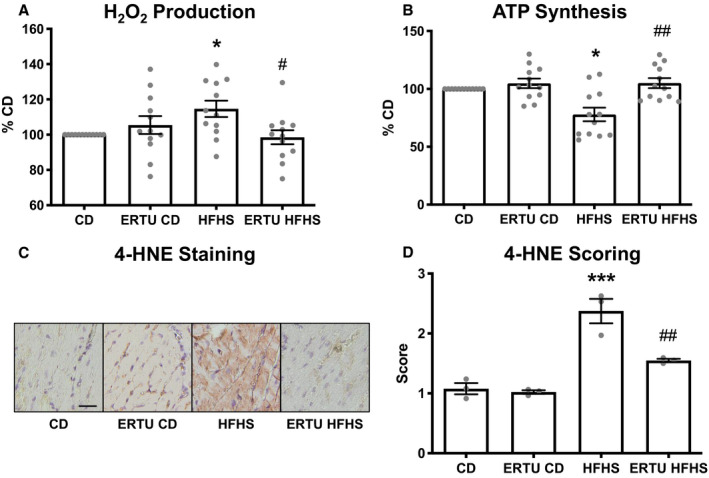
H2O2 release was increased (A) and ATP production was decreased (B) in cardiac mitochondria isolated from mice fed HFHS or control (CD) diet for 4 months, and both were prevented by ERTU treatment. Myocardial oxidative stress was assessed by immunohistochemical staining for 4‐hydroxynonenal (4‐HNE). C, Representative images of 4‐HNE staining. D, Mean scoring for 4‐HNE staining, 10 random fields per heart, bar=20 μm (*P<0.05, ***P<0.001 vs CD; # P<0.05, ## P<0.01; Kruskal‐Wallis with Dunn correction for A and B and 1‐way ANOVA with Bonferroni correction for D; data presented as mean±SEM). For A and B, n=12/group; for D, n=3/group.
Ertugliflozin Improves Contractile and Energetic Function in CD‐ and HFHS‐Fed Mice
Contractile function and high‐energy phosphates were measured simultaneously in beating hearts at baseline and with increased work demand. With high work demand (Peak), LV end‐diastolic pressure increased more in HFHS (versus CD) hearts, and the increase was prevented in hearts from ertugliflozin‐treated mice (Table 1).
Table 1.
Isolated Beating Heart Function and Energetics
| Variable | CD (n=6) | Ertugliflozin CD (n=6) | HFHS (n=9) | Ertugliflozin HFHS (n=9) | ||||
|---|---|---|---|---|---|---|---|---|
| Baseline | Peak | Baseline | Peak | Baseline | Peak | Baseline | Peak | |
| EDP, mm Hg | 9.1±0.4 | 9.5±0.3 | 9.2±0.5 | 10.5±0.7 | 9.6±0.3 | 15.1±1.7‡ | 9.6±0.3 | 11.9±0.9§ |
| Systolic pressure, mm Hg | 104±6 | 116±5 | 128±9 | 144±8 | 93±3 | 89±7 | 110±4 | 144±11¶ |
| Developed pressure, mm Hg | 95±6 | 107±5 | 119±9 | 133±8* | 84±3 | 74±7* | 101±4 | 132±11¶ |
| RPP (103 mm Hg/min) | 42.7±2.6 | 63.9±3.1 | 53.5±4.1 | 79.8±4.8* | 37.6±1.4 | 44.2±4.0* | 45.2±1.6 | 78.9±6.5¶ |
| Phosphocreatine/ATP | 2.07±0.16 | 1.57±0.11 | 1.78±0.21 | 1.50±0.07 | 1.37±0.09‡ | 1.21±0.1* | 1.66±0.06§ | 1.47±0.05§ |
Contractile function and high‐energy phosphates (31P nuclear magnetic resonance spectroscopy) were measured simultaneously in isolated retrograde‐perfused Langendorff hearts. At baseline, hearts were paced at 450 beats per minute and perfused with 2 mmol/L CaCl2. At high workload (Peak), hearts were paced at 600 beats per minute and perfused with 4 mmol/L CaCl2 (2‐way ANOVA with Bonferroni correction; data presented as mean±SEM). CD indicates control diet; EDP, end‐diastolic pressure; HFHS, high fat, high sucrose; and RPP, rate pressure product.
*P<0.05, ‡ P<0.001 vs CD at corresponding workload.
§P<0.05, ¶P<0.001 vs HFHS at corresponding workload.
The RPP, which reflects cardiac contractile reserve, increased with high work demand in CD hearts, but failed to increase in HFHS hearts (Table 1 and Figure 4), indicating lower contractile reserve. Ertugliflozin increased contractile reserve in both CD and HFHS hearts to an RPP exceeding that in control CD hearts by 25±1.9% and 24±2.3%, respectively.
Figure 4. Effect of ertugliflozin (ERTU) on myocardial high‐energy phosphates relative to cardiac reserve.
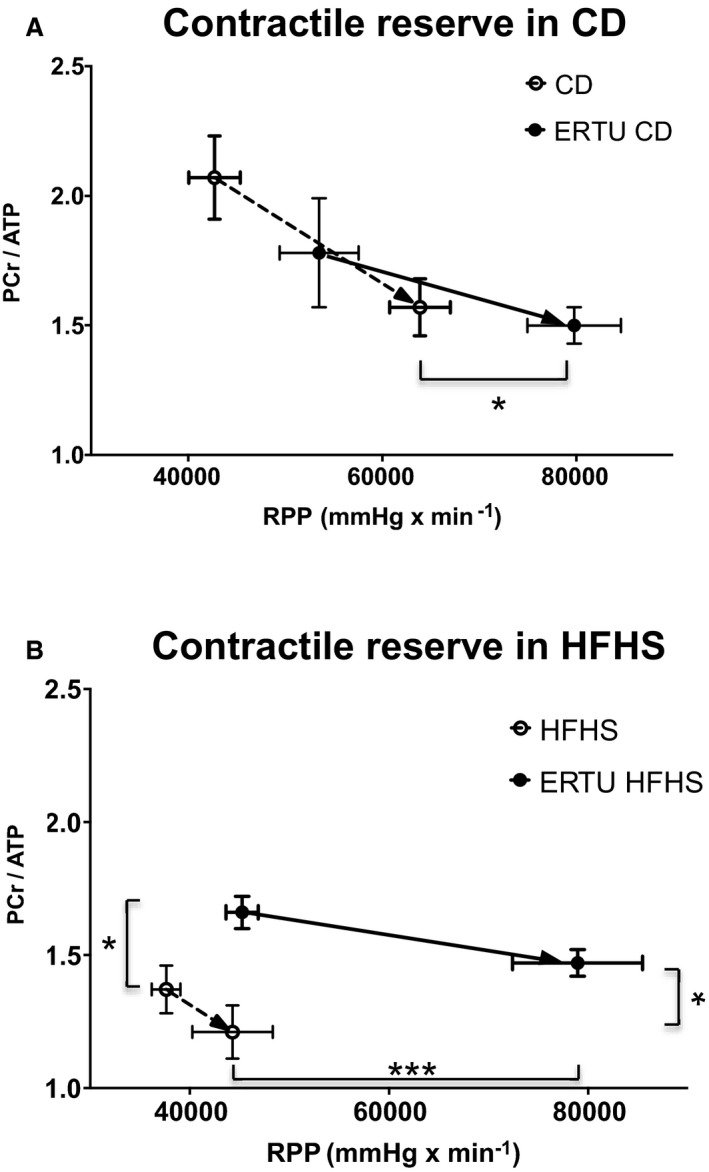
Phosphocreatine (PCr) and ATP were measured by 31P nuclear magnetic resonance simultaneously with contractile function in isolated beating hearts while increasing work demand by raising the pacing rate and the concentration of calcium in the perfusate. Contractile reserve was assessed as the change in rate×pressure product (RPP) with increased work demand. A, With increased work demand, hearts from control diet (CD)–fed mice treated with ERTU for 4 months (solid line) achieved a higher RPP without a decrease in PCr/ATP, compared with hearts from mice not treated with ERTU (dashed line). B, Hearts from high‐fat, high‐sucrose (HFHS)–fed mice (dashed line) had a lower PCr/ATP at baseline and were unable to increase RPP with increased work demand. In hearts from mice treated with ERTU for 4 months (solid line), RPP and PCr/ATP were increased with high work demand (*P<0.05, ***P<0.001 vs untreated at corresponding workload; 2‐way ANOVA with Bonferroni correction, see also Table 1; data presented as mean±SEM). In A, n=6/group for CD and ERTU/CD; in B, n=9/group for HFHS and ERTU/HFHS.
As expected, the concentration of phosphocreatine/ATP was decreased in HFHS versus CD hearts both at baseline and with high work demand (Table 1 and Figure 4). In HFHS hearts, ertugliflozin treatment increased phosphocreatine/ATP at both low and high work demand (Figure 4B). In contrast, although ertugliflozin increased contractile reserve in CD hearts, this increase was not accompanied by an increase in phosphocreatine/ATP at low or high work demand (Figure 4A).
Myocardial ATP concentration was not affected by HFHS diet or ertugliflozin treatment, and remained stable throughout the protocol (Table S1). Intracellular inorganic phosphate was higher in HFHS hearts, and was corrected by ertugliflozin treatment (Table S1). Intracellular pH trended lower in HFHS hearts at high workload (P=0.10) and was normalized by ertugliflozin treatment (Table S1).
Effects of HFHS Diet and Ertugliflozin Treatment on Myocardial Gene Expression
Myocardial mRNA was subjected to next‐generation sequencing and analyzed initially using the GO platform to identify sets of genes related to well‐defined biologic processes. There was significant (false discovery rate–corrected P value <0.25) positive or negative enrichment of 1418 GO gene sets. Of these, the 20 gene sets most enriched by ertugliflozin based on normalized enrichment scores (NESs), all were positively enriched and related to mitochondrial structure and/or function (eg, cellular respiration, oxidative phosphorylation [OXPHOS], electron transport chain, and fatty acid β oxidation) (Table 2).
Table 2.
GO Terms Most Enriched by Ertugliflozin Treatment
| Gene Set Name | Gene Set Size | Effect of Ertugliflozin Treatment | ||
|---|---|---|---|---|
| NES | P Value | FDRq | ||
| GO inner mitochondria membrane protein complex | 95 | 3.29 | <0.001 | <0.001 |
| GO mitochondrial protein complex | 124 | 3.27 | <0.001 | <0.001 |
| GO cellular respiration | 130 | 3.25 | <0.001 | <0.001 |
| GO organelle inner membrane | 479 | 3.24 | <0.001 | <0.001 |
| GO mitochondrial membrane part | 154 | 3.23 | <0.001 | <0.001 |
| GO oxidative phosphorylation | 73 | 3.22 | <0.001 | <0.001 |
| GO respiratory chain | 70 | 3.15 | <0.001 | <0.001 |
| GO electron transport chain | 83 | 3.11 | <0.001 | <0.001 |
| GO mitochondrial matrix | 392 | 3.09 | <0.001 | <0.001 |
| GO mitochondrial respiratory chain complex assembly | 71 | 3.05 | <0.001 | <0.001 |
| GO mitochondrial respiratory chain complex I biogenesis | 51 | 3.02 | <0.001 | <0.001 |
| GO oxidoreductase complex | 87 | 3.02 | <0.001 | <0.001 |
| GO energy derivation by oxidation of organic compounds | 193 | 2.978 | <0.001 | <0.001 |
| GO NADH dehydrogenase complex | 38 | 2.93 | <0.001 | <0.001 |
| GO aerobic respiration | 50 | 2.91 | <0.001 | <0.001 |
| GO generation of precursor metabolites and energy | 261 | 2.89 | <0.001 | <0.001 |
| GO fatty acid β oxidation | 51 | 2.88 | <0.001 | <0.001 |
| GO lipid oxidation | 70 | 2.83 | <0.001 | <0.001 |
| GO oxidoreductase activity acting on NADP H quinone or similar compound as acceptor | 44 | 2.83 | <0.001 | <0.001 |
| GO fatty acid catabolic process | 73 | 2.80 | <0.001 | <0.001 |
Of the 20 most enriched GO terms by ertugliflozin while controlling for diet, all were upregulated and related to mitochondrial structure and/or function. Gene set size represents the number of genes within a gene set that coincide with the ranked list. Nominal P values and FDRq are computed from the NES based on 1000 random permutations, and therefore are presented as <0.001. For details of statistical analysis, please refer to “RNA Isolation, RNA Sequencing, and Sequencing Analysis” in Methods section. FDRq indicates false discovery rate–corrected P value; GO, Gene Ontology; and NES, normalized enrichment score.
The next level of analysis was performed using Hallmark GSEA, a distilled collection of genes from multiple subcollections of the Molecular Signatures Database that streamlines specific biological states or processes.25 When analyzed by diet effect while controlling for ertugliflozin treatment, the highest‐ranking Hallmark gene set (Table S2) was for OXPHOS, which was negatively enriched by HFHS diet, with an NES of −2.42 (Figure 5A); for corresponding enrichment plot, see Figure S4A; for full‐size image, see Figure S5. When analyzed by ertugliflozin treatment while controlling for diet, the OXPHOS gene set was also the highest‐ranking gene set (3.71 NES), but was positively enriched (Figure 5B and Figures S4B and S6). When analyzed only in HFHS‐fed mice, ertugliflozin enriched the OXPHOS gene set by 3.32 NES (Figure 5C and Figures S4C and S7), indicating that ertugliflozin prevented the negative effect of diet on OXPHOS. Of note, when analyzed only in CD‐fed hearts, the effect of ertugliflozin treatment on the OXPHOS gene set was equivalent to that observed in HFHS hearts (3.34 NES) (Figure 5D and Figures S4D and S8), further indicating that the effect of ertugliflozin is not dependent on diet.
Figure 5. Ertugliflozin (ERTU) treatment upregulates myocardial genes for oxidative phosphorylation (OXPHOS).
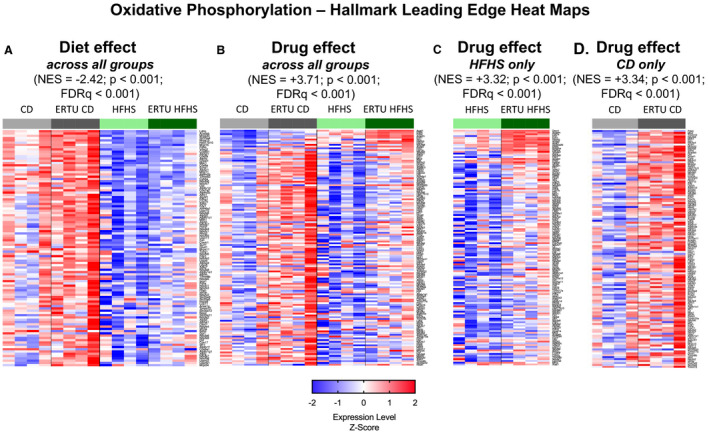
Myocardial gene expression was assessed by mRNA sequencing with Gene Set Enrichment Analysis (GSEA). Of the 20 most enriched Gene Ontogeny gene sets, all were positively enriched and related to mitochondrial structure and/or function (Table 2). By Hallmark GSEA, the most enriched gene set for ERTU treatment effect was for OXPHOS (Table S2). A, The OXPHOS gene set was downregulated in high‐fat, high‐sucrose (HFHS)–fed hearts. B, When analyzed for ERTU effect across all treatment groups, OXPHOS was markedly positively enriched. Likewise, OXPHOS was highly positively enriched and to a similar degree when analyzed only in HFHS hearts (C) or control diet (CD) hearts (D). For full‐size images of each panel, please see Figures S6 through S9. The scale bar represents the z‐scores of the expression values (ie, the number of SDs from the mean of each row), with the maximum and minimum z‐scores set to 2 (red) and −2 (blue), respectively (n=4/group). For statistical analysis, please refer to “RNA Isolation, RNA Sequencing, and Sequencing Analysis” in Methods section. FDRq indicates false discovery rate–corrected P value; and NES, normalized enrichment score.
The second highest‐ranking Hallmark GSEA enriched by ertugliflozin treatment was for fatty acid metabolism (FAM). As expected, HFHS diet (while controlling for ertugliflozin treatment) led to an induction of genes related to FAM with an NES of 1.97 (Figure 6A; for corresponding enrichment plot, see Figure S9A; for full‐size image, see Figure S10). Of note, ertugliflozin treatment led to positive enrichment of FAM genes across all treatment groups while correcting for diet (2.82 NES) (Figure 6B and Figures S9B and S11), in HFHS‐fed mice alone (2.57 NES) (Figure 6C and Figures S9C and S12), and in CD‐fed mice alone (2.42 NES) (Figure 6D and Figures S9D and S13). Thus, as for OXPHOS genes, upregulation of the FAM gene set by ertugliflozin is not dependent on diet.
Figure 6. Ertugliflozin (ERTU) treatment upregulates myocardial genes for fatty acid metabolism (FAM).
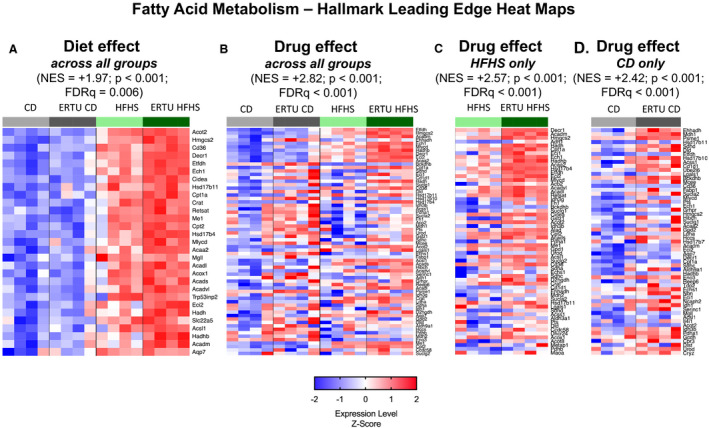
The second highest Hallmark gene for ERTU effect was for FAM (Table S2). A, The FAM gene set was upregulated in high‐fat, high‐sucrose (HFHS) hearts. As with oxidative phosphorylation, the FAM gene set was upregulated by ERTU when analyzed across all groups (B), or only in HFHS hearts (C) or control diet (CD) hearts (D). For full‐size images of each panel, please see Figures S10 through S13. The scale bar represents the z‐scores of the expression values (ie, the number of SDs from the mean of each row), with the maximum and minimum z‐scores set to 2 (red) and −2 (blue), respectively (n=4/group; statistical analysis as per Figure 5). FDRq indicates false discovery rate–corrected P value; and NES, normalized enrichment score.
Discussion
The goal of this study was to assess the effects of SGLT2 inhibition on cardiac mitochondrial function, both in mice with obesity‐related diabetes mellitus and in control mice without diabetes mellitus. In diabetic mice, treatment for 4 months normalized systemic glucose and insulin levels, and had beneficial effects on the myocardial hallmarks of DCMP, including LV hypertrophy, myocyte hypertrophy, myocardial interstitial fibrosis, and diastolic dysfunction. These effects of ertugliflozin on cardiac phenotype were associated with prevention of mitochondrial dysfunction, preserved ATP production, and a decrease in ROS generation. Assessment of energetics by simultaneous measurement of contractile performance and high‐energy phosphates in the beating heart showed that ertugliflozin increased contractile reserve at high work demand without decreasing phosphocreatine/ATP, and that this effect was independent of diabetes mellitus. Gene expression profiling confirmed that the most prominent effect of ertugliflozin was positive enrichment of gene sets related to OXPHOS and FAM, and, like the effect on energetics, this effect of ertugliflozin was independent of diabetes mellitus.
Systemic Metabolic Effects of Therapy
Ertugliflozin administration to HFHS‐fed mice prevented the systemic metabolic consequences of diabetes mellitus, as evidenced by normalization of fasting glucose, fasting insulin, homeostasis model assessment of insulin resistance, and hemoglobin A1c. Ertugliflozin therapy had no effect on calorie consumption in HFHS‐ or CD‐fed mice, but led to less weight gain over the study in both, presumably reflecting increased excretion of glucose in the urine. These effects of ertugliflozin in diabetic mice were expected,27, 28, 29, 30 and indicate that the ertugliflozin treatment regimen used in this study achieved effective drug levels.
Ertugliflozin Prevents DCMP
Ertugliflozin corrected the cardiac phenotype in the HFHS‐fed mice. Hallmarks of obesity‐related DCMP in both patients and mice include LV hypertrophy, interstitial fibrosis, and diastolic dysfunction.1, 2, 4, 5, 6, 31 Ertugliflozin treatment prevented the development of LV hypertrophy and interstitial fibrosis, and likewise, prevented diastolic dysfunction both in vivo, as assessed by Doppler echocardiography, and in isolated beating hearts of HFHS‐fed mice. Other studies have shown a comparable beneficial effect of SGLT2 inhibition on cardiac phenotype in models of diabetes mellitus.32, 33, 34 Although we cannot exclude the possibility that the improvements in cardiac structure and function observed in our study are attributable, at least in part, to correction of the metabolic milieu, the magnitude of these effects is larger than would be expected. For example, in patients with type 2 diabetes mellitus, intensive glycemic control has been shown to improve diastolic dysfunction in some,35 but not other,36 studies.
Ertugliflozin Prevents Mitochondrial Dysfunction and Supernormalizes Contractile Function in HFHS‐Fed Mice
Mitochondrial dysfunction is a hallmark of DCMP,37 as reflected by decreased high‐energy phosphate stores in hearts from patients with obesity‐related diabetic cardiomyopathy.6, 38 Likewise, in mice with DCMP attributable to an HFHS diet, we previously demonstrated decreased mitochondrial ATP synthesis and increased ROS production, resulting in decreased high‐energy phosphate stores and contractile reserve in beating hearts.17, 26 In mitochondria isolated from HFHS‐fed mice, ertugliflozin treatment both preserved maximal stimulated ATP production and prevented the increase in mitochondrial ROS release. Congruent with the observed decrease in mitochondrial ROS release, ertugliflozin decreased myocardial 4‐hydroxynonenal content, a marker of lipid peroxidation and oxidative stress.
Increased mitochondrial ROS production is central to the pathophysiological characteristics of myocardial hypertrophy and interstitial fibrosis in DCMP5, 18 and may contribute to further mitochondrial dysfunction by causing maladaptive oxidative modifications of mitochondrial proteins.26 In HFHS‐fed mice, overexpression of the antioxidant catalase selectively in mitochondria led to marked amelioration of the cardiac phenotype, correction of mitochondrial ATP production, and improvement in cardiac energetic performance.5, 18 Although SGLT2 inhibition has been shown to decrease myocardial oxidative stress levels in diabetic models,29, 30, 39, 40 prior studies have not evaluated the effects on mitochondrial ROS and ATP generation.
To determine the physiologic importance of improved mitochondrial function, myocardial contractile performance and high‐energy phosphates were measured simultaneously in isolated beating hearts under conditions of low and high work demand. In HFHS hearts, the ability to increase contractile reserve (ie, RPP) in response to high work demand was markedly impaired, in association with a depression in phosphocreatine/ATP. Ertugliflozin normalized phosphocreatine/ATP at high work demand and supernormalized RPP to a level 25% higher than in untreated mice on control diet (Figure 4B and Table 1). These observations suggest that the improvement in function observed in isolated mitochondria from ertugliflozin‐treated mice is associated with improved energetic performance in the beating heart. This conclusion is consistent with that of Verma et al,14 who showed that SGLT2 inhibition increased myocardial substrate use and the imputed rate of ATP production in db/db mice.
Ertugliflozin Improves Myocardial Performance in Nondiabetic Control Hearts
An unexpected finding in this study was an increase in cardiac performance in ertugliflozin‐treated control mice (ie, CD fed), as reflected by a supernormalization in RPP at high work demand to a level ≈24% higher than in untreated control mice (Figure 4A and Table 1). Despite the increase in peak performance, peak phosphocreatine/ATP was not decreased, suggesting an improvement in energy balance between supply and demand.
SGLT2 inhibition has not previously been shown to improve energetic function in normal hearts, as prior studies that assessed the energetic effects of SGLT2 inhibition did not include drug‐treated control mice.14, 15 Although our methods do not allow conclusions on the mechanism responsible for improved energy balance, the most likely possibilities are an increase in ATP production14 and/or an increase in contractile efficiency.15 As discussed below, we observed that ertugliflozin treatment in both diabetic (HFHS) and nondiabetic (CD) mice was associated with transcriptomic evidence for metabolic remodeling that is reasonably expected to increase both OXPHOS and FAM, and hence, the production of ATP.
Ertugliflozin Upregulates Cardiac OXPHOS and FAM Pathways in Both Diabetic and Nondiabetic Mice
As expected, in HFHS hearts, myocardial gene expression profiling by RNA sequencing–derived GSEA revealed a marked downregulation of genes involved in OXPHOS (Figure 5A). To assess the effect of ertugliflozin treatment, per se, we first analyzed GO gene sets. Of the top 20 GO gene sets that were enriched by ertugliflozin, all were related to mitochondrial structure and/or function, with compelling NES values ranging from 2.71 to 3.25.
The next level of analysis used Hallmark gene sets, which provide a streamlined analysis approach that removes redundancies that tend to befall GO gene sets. The Hallmark GSEA revealed OXPHOS to be the top‐scoring gene set for the effect of ertugliflozin. When the effect of ertugliflozin treatment was determined while controlling for diet across all groups, ertugliflozin had an NES of 3.71 (Figure 5B). Likewise, when the effect of ertugliflozin was assessed only in CD‐fed control mice, a similarly high NES (3.34) was obtained (Figure 5D). This observation indicates that ertugliflozin treatment has a marked positive effect on the expression of genes involved in the regulation of OXPHOS, and that this effect is independent of diabetic status. Notably, the second highest scoring Hallmark gene set for ertugliflozin treatment was FAM, which, like OXPHOS, was independent of diabetic status (Figure 6B and 6D). Taken together, these observations suggest that reprogramming of metabolic genes that favor OXPHOS and FAM may, at least in part, be responsible for the beneficial effects of ertugliflozin on energetics and contractile reserve, regardless of diabetic status.
Ertugliflozin treatment also led to a marked enrichment in the GO gene set for the fatty acid β oxidation gene set (NES, 2.88), which was among the top 20 GO gene sets enriched by ertugliflozin (Table 2). Prior studies have suggested that preserving fatty acid oxidation (FAO) prevents the decline in myocardial function and energetics in response to pressure‐overload hypertrophy,41 and prevents the shift in substrate use to glucose and the associated increase in aspartate‐mediated cardiac hypertrophy.42 Thus, the ability of ertugliflozin to promote FAO may contribute to the beneficial effects on myocardial function, hypertrophy, and energetics that were observed in this study. In the diabetic heart, insulin resistance and an excess of fatty acid abundance are thought to promote increased FAO and excessive mitochondrial generation of ROS,37, 43 which contribute to pathological remodeling. It is therefore noteworthy that in HFHS hearts, ertugliflozin further increased the expression of genes related to FAO, but suppressed mitochondrial ROS generation.
Limitations
This study does not identify the mechanism by which ertugliflozin caused reprogramming of metabolic genes in the heart. In this regard, it is of interest that in liver and fat, SGLT2 inhibition modulates nutrient levels, leading to activation of AMP kinase and nuclear reprogramming that favors FAO.44 Furthermore, sodium has recently been implicated in modulating cardiac metabolic reprogramming45 and in this context it is noteworthy that SGLT2 inhibitors have been shown to lower cardiomyocyte sodium,46, 47 although this remains controversial.48
Our finding that ertugliflozin caused both a supernormalization of cardiac performance and a striking enrichment of gene sets that encode mitochondrial proteins involved in OXPHOS and FAM suggest that the beneficial effects of SGLT2 inhibition are mediated, at least in part, at the transcriptional level. A fundamental question not addressed by our study is how SGLT2 inhibition leads to increased transcription of genes encoding mitochondrial proteins. An intriguing possibility is that ertugliflozin acts directly, or indirectly, on cardiac mitochondria in a way that affects signaling between the mitochondria and the nucleus.44, 49, 50
The absence of fatty acids in the perfusate for the isolated beating heart studies is a potential limitation. However, because most fatty acids cycle through the endogenous triglyceride pool before being oxidized in mitochondria, the endogenous triglyceride pool is able to support stable cardiac function for at least 2 hours in the absence of fatty acids in the perfusate.51 To minimize this potential effect, the duration of the perfusion protocol was limited to 32 minutes.
Conclusions
This study has implications for the use of SGLT2 inhibitors in the treatment of myocardial disease, in the presence or absence of diabetes mellitus. In obesity‐related diabetes mellitus, ertugliflozin prevents mitochondrial dysfunction, leading to both a correction of ATP production and myocardial energetics and a decrease in the generation of pathologic levels of ROS that mediate myocardial structural and functional remodeling. Our findings further suggest that, both in the presence and absence of diabetes mellitus, SGLT2 inhibition leads to improved myocardial energetics and the coordinated expression of genes that would be expected to lead to increases in both OXPHOS and the use of fatty acids as fuel. Taken together, our findings suggest that metabolic reprogramming, leading to increased FAO and improved mitochondrial function, plays a central role in mediating the beneficial effects of SGLT2 inhibition on myocardial performance. Although data on the effects of other SGLT2 inhibitors on cardiac mitochondrial function and metabolic gene expression are limited, beneficial effects of empagliflozin on cardiac metabolism in both diabetic14 and nondiabetic15 animals suggest that the effects observed with ertugliflozin are shared by other SGLT2 inhibitors. These findings further suggest that therapies directed at improving mitochondrial function may be of value in the therapy of heart failure that is associated with mitochondrial dysfunction.50
Sources of Funding
This work was supported by an investigator‐initiated grant (IISP‐57335) from Merck Pharmaceuticals (Dr Colucci); National Institutes of Health grants HL‐064750 (Dr Colucci) and K08‐HL‐123744 (Dr Panagia); and a Fellow‐to‐Faculty Award from the American Heart Association 15FTF25890062 (Dr Luptak).
Disclosures
Dr Colucci is supported by an investigator‐initiated grant (IISP‐57335) from Merck Pharmaceuticals. The remaining authors have no disclosures to report.
Supporting information
Tables S1–S2
Figures S1–S13
Acknowledgments
We would like to acknowledge the Microarray and Sequencing Resource Core and the Analytical Instrumentational Core Facilities at Boston University for providing expertise, instrumentation, and analysis crucial to generation of data in this work.
(J Am Heart Assoc. 2021;10:e019995. DOI: 10.1161/JAHA.120.019995.)
Supplementary Material for this article is available at https://www.ahajournals.org/doi/suppl/10.1161/JAHA.120.019995
For Sources of Funding and Disclosures, see page 13.
See Editorial by Sawicki et al.
References
- 1.Ayalon N, Gopal DM, Mooney DM, Simonetti JS, Grossman JR, Dwivedi A, Donohue C, Perez AJ, Downing J, Gokce N, et al. Preclinical left ventricular diastolic dysfunction in metabolic syndrome. Am J Cardiol. 2014;114:838–842. DOI: 10.1016/j.amjcard.2014.06.013. [DOI] [PMC free article] [PubMed] [Google Scholar]
- 2.Gopal DM, Santhanakrishnan R, Wang Y‐C, Ayalon N, Donohue C, Rahban Y, Perez AJ, Downing J, Liang C‐S, Gokce N, et al. Impaired right ventricular hemodynamics indicate preclinical pulmonary hypertension in patients with metabolic syndrome. J Am Heart Assoc. 2015;4:e001597. DOI: 10.1161/JAHA.114.001597. [DOI] [PMC free article] [PubMed] [Google Scholar]
- 3.Wang Y‐C, Liang C‐S, Gopal DM, Ayalon N, Donohue C, Santhanakrishnan R, Sandhu H, Perez AJ, Downing J, Gokce N, et al. Preclinical systolic and diastolic dysfunctions in metabolically healthy and unhealthy obese individuals. Circ Heart Fail. 2015;8:897–904. DOI: 10.1161/CIRCHEARTFAILURE.114.002026. [DOI] [PMC free article] [PubMed] [Google Scholar]
- 4.Qin F, Siwik DA, Luptak I, Hou X, Wang L, Higuchi A, Weisbrod RM, Ouchi N, Tu VH, Calamaras TD, et al. The polyphenols resveratrol and S17834 prevent the structural and functional sequelae of diet‐induced metabolic heart disease in mice. Circulation. 2012;125:1757–1766. DOI: 10.1161/CIRCULATIONAHA.111.067801. [DOI] [PMC free article] [PubMed] [Google Scholar]
- 5.Sverdlov AL, Elezaby A, Qin F, Behring JB, Luptak I, Calamaras TD, Siwik DA, Miller EJ, Liesa M, Shirihai OS, et al. Mitochondrial reactive oxygen species mediate cardiac structural, functional, and mitochondrial consequences of diet‐Induced metabolic heart disease. J Am Heart Assoc. 2016;5:e002555. DOI: 10.1161/JAHA.115.002555. [DOI] [PMC free article] [PubMed] [Google Scholar]
- 6.Rider OJ, Francis JM, Ali MK, Holloway C, Pegg T, Robson MD, Tyler D, Byrne J, Clarke K, Neubauer S. Effects of catecholamine stress on diastolic function and myocardial energetics in obesity. Circulation. 2012;125:1511–1519. DOI: 10.1161/CIRCULATIONAHA.111.069518. [DOI] [PubMed] [Google Scholar]
- 7.Zinman B, Wanner C, Lachin JM, Fitchett D, Bluhmki E, Hantel S, Mattheus M, Devins T, Johansen OE, Woerle HJ, et al. Empagliflozin, cardiovascular outcomes, and mortality in type 2 diabetes. N Engl J Med. 2015;373:2117–2128. DOI: 10.1056/NEJMoa1504720. [DOI] [PubMed] [Google Scholar]
- 8.Perkovic V, Jardine MJ, Neal B, Bompoint S, Heerspink HJL, Charytan DM, Edwards R, Agarwal R, Bakris G, Bull S, et al. Canagliflozin and renal outcomes in type 2 diabetes and nephropathy. N Engl J Med. 2019;380:2295–2306. DOI: 10.1056/NEJMoa1811744. [DOI] [PubMed] [Google Scholar]
- 9.Wiviott SD, Raz I, Bonaca MP, Mosenzon O, Kato ET, Cahn A, Silverman MG, Zelniker TA, Kuder JF, Murphy SA, et al. Dapagliflozin and cardiovascular outcomes in type 2 diabetes. N Engl J Med. 2019;380:347–357. DOI: 10.1056/NEJMoa1812389. [DOI] [PubMed] [Google Scholar]
- 10.Cannon CP, Pratley R, Dagogo‐Jack S, Mancuso J, Huyck S, Masiukiewicz U, Charbonnel B, Frederich R, Gallo S, Cosentino F, et al. Cardiovascular outcomes with ertugliflozin in type 2 diabetes. N Engl J Med. 2020;383:1425–1435. DOI: 10.1056/NEJMoa2004967. [DOI] [PubMed] [Google Scholar]
- 11.McMurray JJV, Solomon SD, Inzucchi SE, Køber L, Kosiborod MN, Martinez FA, Ponikowski P, Sabatine MS, Anand IS, Bělohlávek J, et al. Dapagliflozin in patients with heart failure and reduced ejection fraction. N Engl J Med. 2019;381:1995–2008. DOI: 10.1056/NEJMoa1911303. [DOI] [PubMed] [Google Scholar]
- 12.Packer M, Anker SD, Butler J, Filippatos G, Pocock SJ, Carson P, Januzzi J, Verma S, Tsutsui H, Brueckmann M, et al. Cardiovascular and renal outcomes with empagliflozin in heart failure. N Engl J Med. 2020;383:1413–1424. DOI: 10.1056/NEJMoa2022190. [DOI] [PubMed] [Google Scholar]
- 13.Lopaschuk GD, Verma S. Mechanisms of cardiovascular benefits of sodium glucose co‐transporter 2 (SGLT2) inhibitors: a state‐of‐the‐art review. JACC Basic Transl Sci. 2020;5:632–644. DOI: 10.1016/j.jacbts.2020.02.004. [DOI] [PMC free article] [PubMed] [Google Scholar]
- 14.Verma S, Rawat S, Ho KL, Wagg CS, Zhang L, Teoh H, Dyck JE, Uddin GM, Oudit GY, Mayoux E, et al. Empagliflozin increases cardiac energy production in diabetes: novel translational insights into the heart failure benefits of SGLT2 inhibitors. JACC Basic Transl Sci. 2018;3:575–587. DOI: 10.1016/j.jacbts.2018.07.006. [DOI] [PMC free article] [PubMed] [Google Scholar]
- 15.Santos‐Gallego CG, Requena‐Ibanez JA, San Antonio R, Ishikawa K, Watanabe S, Picatoste B, Flores E, Garcia‐Ropero A, Sanz J, Hajjar RJ, et al. Empagliflozin ameliorates adverse left ventricular remodeling in nondiabetic heart failure by enhancing myocardial energetics. J Am Coll Cardiol. 2019;73:1931–1944. DOI: 10.1016/j.jacc.2019.01.056. [DOI] [PubMed] [Google Scholar]
- 16.Byrne NJ, Parajuli N, Levasseur JL, Boisvenue J, Beker DL, Masson G, Fedak PWM, Verma S, Dyck JRB. Empagliflozin prevents worsening of cardiac function in an experimental model of pressure overload‐induced heart failure. JACC Basic Transl Sci. 2017;2:347–354. DOI: 10.1016/j.jacbts.2017.07.003. [DOI] [PMC free article] [PubMed] [Google Scholar]
- 17.Luptak I, Sverdlov AL, Panagia M, Qin F, Pimentel DR, Croteau D, Siwik DA, Ingwall JS, Bachschmid MM, Balschi JA, et al. Decreased ATP production and myocardial contractile reserve in metabolic heart disease. J Mol Cell Cardiol. 2018;116:106–114. DOI: 10.1016/j.yjmcc.2018.01.017. [DOI] [PMC free article] [PubMed] [Google Scholar]
- 18.Luptak I, Qin F, Sverdlov AL, Pimentel DR, Panagia M, Croteau D, Siwik DA, Bachschmid MM, He H, Balschi JA, et al. Energetic dysfunction is mediated by mitochondrial reactive oxygen species and precedes structural remodeling in metabolic heart disease. Antioxid Redox Signal. 2019;31:539–549. DOI: 10.1089/ars.2018.7707. [DOI] [PMC free article] [PubMed] [Google Scholar]
- 19.Mascitti V, Maurer TS, Robinson RP, Bian J, Boustany‐Kari CM, Brandt T, Collman BM, Kalgutkar AS, Klenotic MK, Leininger MT, et al. Discovery of a clinical candidate from the structurally unique dioxa‐bicyclo[3.2.1]octane class of sodium‐dependent glucose cotransporter 2 inhibitors. J Med Chem. 2011;54:2952–2960. DOI: 10.1021/jm200049r. [DOI] [PubMed] [Google Scholar]
- 20.Qin F, Siwik DA, Pimentel DR, Morgan RJ, Biolo A, Tu VH, Kang YJ, Cohen RA, Colucci WS. Cytosolic H2O2 mediates hypertrophy, apoptosis, and decreased SERCA activity in mice with chronic hemodynamic overload. Am J Physiol Heart Circ Physiol. 2014;306:H1453–H1463. DOI: 10.1152/ajpheart.00084.2014. [DOI] [PMC free article] [PubMed] [Google Scholar]
- 21.Luptak I, Balschi JA, Xing Y, Leone TC, Kelly DP, Tian R. Decreased contractile and metabolic reserve in peroxisome proliferator‐activated receptor‐alpha‐null hearts can be rescued by increasing glucose transport and utilization. Circulation. 2005;112:2339–2346. DOI: 10.1161/CIRCULATIONAHA.105.534594. [DOI] [PubMed] [Google Scholar]
- 22.Dobin A, Davis CA, Schlesinger F, Drenkow J, Zaleski C, Jha S, Batut P, Chaisson M, Gingeras TR. STAR: ultrafast universal RNA‐seq aligner. Bioinformatics. 2013;29:15–21. DOI: 10.1093/bioinformatics/bts635. [DOI] [PMC free article] [PubMed] [Google Scholar]
- 23.Love MI, Huber W, Anders S. Moderated estimation of fold change and dispersion for RNA‐seq data with DESeq2. Genome Biol. 2014;15:550. DOI: 10.1186/s13059-014-0550-8. [DOI] [PMC free article] [PubMed] [Google Scholar]
- 24.Subramanian A, Kuehn H, Gould J, Tamayo P, Mesirov JP. GSEA‐P: a desktop application for Gene Set Enrichment Analysis. Bioinformatics. 2007;23:3251–3253. DOI: 10.1093/bioinformatics/btm369. [DOI] [PubMed] [Google Scholar]
- 25.Liberzon A, Birger C, Thorvaldsdottir H, Ghandi M, Mesirov JP, Tamayo P. The Molecular Signatures Database (MSigDB) hallmark gene set collection. Cell Syst. 2015;1:417–425. DOI: 10.1016/j.cels.2015.12.004. [DOI] [PMC free article] [PubMed] [Google Scholar]
- 26.Sverdlov AL, Elezaby A, Behring JB, Bachschmid MM, Luptak I, Tu VH, Siwik DA, Miller EJ, Liesa M, Shirihai OS, et al. High fat, high sucrose diet causes cardiac mitochondrial dysfunction due in part to oxidative post‐translational modification of mitochondrial complex II. J Mol Cell Cardiol. 2015;78:165–173. DOI: 10.1016/j.yjmcc.2014.07.018. [DOI] [PMC free article] [PubMed] [Google Scholar]
- 27.Tanajak P, Sa‐Nguanmoo P, Sivasinprasasn S, Thummasorn S, Siri‐Angkul N, Chattipakorn SC, Chattipakorn N. Cardioprotection of dapagliflozin and vildagliptin in rats with cardiac ischemia‐reperfusion injury. J Endocrinol. 2018;236:69–84. DOI: 10.1530/JOE-17-0457. [DOI] [PubMed] [Google Scholar]
- 28.Benetti E, Mastrocola R, Vitarelli G, Cutrin JC, Nigro D, Chiazza F, Mayoux E, Collino M, Fantozzi R. Empagliflozin protects against diet‐Induced NLRP‐3 inflammasome activation and lipid accumulation. J Pharmacol Exp Ther. 2016;359:45–53. DOI: 10.1124/jpet.116.235069. [DOI] [PubMed] [Google Scholar]
- 29.Li C, Zhang J, Xue M, Li X, Han F, Liu X, Xu L, Lu Y, Cheng Y, Li T, et al. SGLT2 inhibition with empagliflozin attenuates myocardial oxidative stress and fibrosis in diabetic mice heart. Cardiovasc Diabetol. 2019;18:15. DOI: 10.1186/s12933-019-0816-2. [DOI] [PMC free article] [PubMed] [Google Scholar]
- 30.Durak A, Olgar Y, Degirmenci S, Akkus E, Tuncay E, Turan B. A SGLT2 inhibitor dapagliflozin suppresses prolonged ventricular‐repolarization through augmentation of mitochondrial function in insulin‐resistant metabolic syndrome rats. Cardiovasc Diabetol. 2018;17:144. DOI: 10.1186/s12933-018-0790-0. [DOI] [PMC free article] [PubMed] [Google Scholar]
- 31.de las Fuentes LDL, Brown AL, Mathews SJ, Waggoner AD, Soto PF, Gropler RJ, Davila‐Roman VG. Metabolic syndrome is associated with abnormal left ventricular diastolic function independent of left ventricular mass. Eur Heart J. 2007;28:553–559. DOI: 10.1093/eurheartj/ehl526. [DOI] [PubMed] [Google Scholar]
- 32.Sun X, Han F, Lu Q, Li X, Ren D, Zhang J, Han Y, Xiang YK, Li J. Empagliflozin ameliorates obesity‐related cardiac dysfunction by regulating sestrin2‐mediated AMPK‐mTOR signaling and redox homeostasis in high‐fat diet‐induced obese mice. Diabetes. 2020;69:1292–1305. DOI: 10.2337/db19-0991. [DOI] [PubMed] [Google Scholar]
- 33.Habibi J, Aroor AR, Sowers JR, Jia G, Hayden MR, Garro M, Barron B, Mayoux E, Rector RS, Whaley‐Connell A, et al. Sodium glucose transporter 2 (SGLT2) inhibition with empagliflozin improves cardiac diastolic function in a female rodent model of diabetes. Cardiovasc Diabetol. 2017;16:9. DOI: 10.1186/s12933-016-0489-z. [DOI] [PMC free article] [PubMed] [Google Scholar]
- 34.Moellmann J, Klinkhammer BM, Droste P, Kappel B, Haj‐Yehia E, Maxeiner S, Artati A, Adamski J, Boor P, Schütt K, et al. Empagliflozin improves left ventricular diastolic function of db/db mice. Biochim Biophys Acta Mol Basis Dis. 2020;1866:165807. DOI: 10.1016/j.bbadis.2020.165807. [DOI] [PubMed] [Google Scholar]
- 35.Leung M, Wong VW, Hudson M, Leung DY. Impact of improved glycemic control on cardiac function in type 2 diabetes mellitus. Circ Cardiovasc Imaging. 2016;9:e003643. DOI: 10.1161/CIRCIMAGING.115.003643. [DOI] [PubMed] [Google Scholar]
- 36.Pitale SU, Abraira C, Emanuele NV, McCarren M, Henderson WG, Pacold I, Bushnell D, Colwell JA, Nuttall FQ, Levin SR, et al. Two years of intensive glycemic control and left ventricular function in the Veterans Affairs Cooperative Study in Type 2 Diabetes Mellitus (VA CSDM). Diabetes Care. 2000;23:1316–1320. DOI: 10.2337/diacare.23.9.1316. [DOI] [PubMed] [Google Scholar]
- 37.Ritchie RH, Abel ED. Basic mechanisms of diabetic heart disease. Circ Res. 2020;126:1501–1525. DOI: 10.1161/CIRCRESAHA.120.315913. [DOI] [PMC free article] [PubMed] [Google Scholar]
- 38.Lai L, Leone TC, Keller MP, Martin OJ, Broman AT, Nigro J, Kapoor K, Koves TR, Stevens R, Ilkayeva OR, et al. Energy metabolic reprogramming in the hypertrophied and early stage failing heart: a multisystems approach. Circ Heart Fail. 2014;7:1022–1031. DOI: 10.1161/CIRCHEARTFAILURE.114.001469. [DOI] [PMC free article] [PubMed] [Google Scholar]
- 39.Kusaka H, Koibuchi N, Hasegawa Y, Ogawa H, Kim‐Mitsuyama S. Empagliflozin lessened cardiac injury and reduced visceral adipocyte hypertrophy in prediabetic rats with metabolic syndrome. Cardiovasc Diabetol. 2016;15:157. DOI: 10.1186/s12933-016-0473-7. [DOI] [PMC free article] [PubMed] [Google Scholar]
- 40.Steven S, Oelze M, Hanf A, Kröller‐Schön S, Kashani F, Roohani S, Welschof P, Kopp M, Gödtel‐Armbrust U, Xia N, et al. The SGLT2 inhibitor empagliflozin improves the primary diabetic complications in ZDF rats. Redox Biol. 2017;13:370–385. DOI: 10.1016/j.redox.2017.06.009. [DOI] [PMC free article] [PubMed] [Google Scholar]
- 41.Kolwicz SC Jr, Olson DP, Marney LC, Garcia‐Menendez L, Synovec RE, Tian R. Cardiac‐specific deletion of acetyl CoA carboxylase 2 prevents metabolic remodeling during pressure‐overload hypertrophy. Circ Res. 2012;111:728–738. DOI: 10.1161/CIRCRESAHA.112.268128. [DOI] [PMC free article] [PubMed] [Google Scholar]
- 42.Ritterhoff J, Young S, Villet O, Shao D, Neto FC, Bettcher LF, Hsu YA, Kolwicz SC Jr, Raftery D, Tian R. Metabolic remodeling promotes cardiac hypertrophy by directing glucose to aspartate biosynthesis. Circ Res. 2020;126:182–196. DOI: 10.1161/CIRCRESAHA.119.315483. [DOI] [PMC free article] [PubMed] [Google Scholar]
- 43.Lopaschuk GD, Ussher JR, Folmes CD, Jaswal JS, Stanley WC. Myocardial fatty acid metabolism in health and disease. Physiol Rev. 2010;90:207–258. DOI: 10.1152/physrev.00015.2009. [DOI] [PubMed] [Google Scholar]
- 44.Osataphan S, Macchi C, Singhal G, Chimene‐Weiss J, Sales V, Kozuka C, Dreyfuss JM, Pan H, Tangcharoenpaisan Y, Morningstar J, et al. SGLT2 inhibition reprograms systemic metabolism via FGF21‐dependent and ‐independent mechanisms. JCI Insight. 2019;4:e123130. DOI: 10.1172/jci.insight.123130. [DOI] [PMC free article] [PubMed] [Google Scholar]
- 45.Aksentijević D, Karlstaedt A, Basalay MV, O’Brien BA, Sanchez‐Tatay D, Eminaga S, Thakker A, Tennant DA, Fuller W, Eykyn TR, et al. Intracellular sodium elevation reprograms cardiac metabolism. Nat Commun. 2020;11:4337. DOI: 10.1038/s41467-020-18160-x. [DOI] [PMC free article] [PubMed] [Google Scholar]
- 46.Baartscheer A, Schumacher CA, Wust RC, Fiolet JW, Stienen GJ, Coronel R, Zuurbier CJ. Empagliflozin decreases myocardial cytoplasmic Na+ through inhibition of the cardiac Na+/H+ exchanger in rats and rabbits. Diabetologia. 2017;60:568–573. DOI: 10.1007/s00125-016-4134-x. [DOI] [PMC free article] [PubMed] [Google Scholar]
- 47.Uthman L, Baartscheer A, Bleijlevens B, Schumacher CA, Fiolet JWT, Koeman A, Jancev M, Hollmann MW, Weber NC, Coronel R, et al. Class effects of SGLT2 inhibitors in mouse cardiomyocytes and hearts: inhibition of Na(+)/H(+) exchanger, lowering of cytosolic Na(+) and vasodilation. Diabetologia. 2018;61:722–726. DOI: 10.1007/s00125-017-4509-7. [DOI] [PMC free article] [PubMed] [Google Scholar]
- 48.Chung YJ, Park KC, Tokar S, Eykyn TR, Fuller W, Pavlovic D, Swietach P, Shattock MJ. Off‐target effects of SGLT2 blockers: empagliflozin does not inhibit Na+/H+ exchanger‐1 or lower [Na+]i in the heart. Cardiovasc Res. 2020. Nov 2 [epub ahead of print]. DOI: 10.1093/cvr/cvaa323. [DOI] [PMC free article] [PubMed] [Google Scholar]
- 49.Lombardi AA, Gibb AA, Arif E, Kolmetzky DW, Tomar D, Luongo TS, Jadiya P, Murray EK, Lorkiewicz PK, Hajnóczky G, et al. Mitochondrial calcium exchange links metabolism with the epigenome to control cellular differentiation. Nat Commun. 2019;10:4509. DOI: 10.1038/s41467-019-12103-x. [DOI] [PMC free article] [PubMed] [Google Scholar]
- 50.Tian R, Colucci WS, Arany Z, Bachschmid MM, Ballinger SW, Boudina S, Bruce JE, Busija DW, Dikalov S, Dorn GW, et al. Unlocking the secrets of mitochondria in the cardiovascular system: path to a cure in heart failure—a report from the 2018 National Heart, Lung, and Blood Institute Workshop. Circulation. 2019;140:1205–1216. DOI: 10.1161/CIRCULATIONAHA.119.040551. [DOI] [PMC free article] [PubMed] [Google Scholar]
- 51.Saddik M, Lopaschuk GD. Myocardial triglyceride turnover and contribution to energy substrate utilization in isolated working rat hearts. J Biol Chem. 1991;266:8162–8170. DOI: 10.1016/S0021-9258(18)92956-X. [DOI] [PubMed] [Google Scholar]
Associated Data
This section collects any data citations, data availability statements, or supplementary materials included in this article.
Supplementary Materials
Tables S1–S2
Figures S1–S13