Abstract
On March 2, 2020, the first Coronavirus Disease (COVID-19) case was reported in Jakarta, Indonesia. One and a half months later (15/05/2020), the cumulative number of infection cases was 16,496, with a total of 1076 mortalities. This study investigates the possible role of weather in the early cases of COVID-19 in six selected cities in Indonesia. Daily temperature and relative humidity data from weather stations nearby in each city were collected from March 3 to April 30, 2020, corresponding with COVID-19 incidence. Correlation tests and regression analysis were performed to examine the association of those two data series. Moreover, we analyzed the distribution of COVID-19 referring the weather data to estimate the effective range of weather data supporting the COVID-19 incidence. Our result reveals that weather data is generally associated with COVID-19 incidence. The daily average temperature (T-ave) and relative humidity (RH) present significant positive and negative correlation with COVID-19 data, respectively. However, the correlation coefficients are weak, with the strongest correlations found at the 5-day lag, i.e., 0.37 (− 0.41) for T-ave (RH). The regression analysis consistently confirmed this relation. The distribution analysis reveals that most COVID-19 cases in Indonesia occurred in the daily temperature range of 25–31 °C and relative humidity of 74–92%. Our findings suggest that COVID-19 incidence in Indonesia has a weak association with weather conditions. Therefore, non-meteorological factors seem to play a more prominent role and should be given greater consideration in preventing the spread of COVID-19.
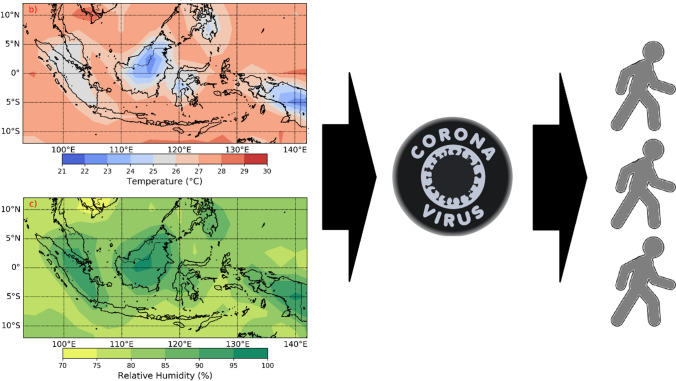
Graphic abstract
Supplementary Information
The online version contains supplementary material available at 10.1007/s42398-021-00202-9.
Keywords: Temperature, Relative humidity, Weather, COVID-19, Indonesia
Introduction
The world was shaken by the spread of the Coronavirus in Wuhan, China, starting in January 2020, which caused local authorities to impose lockdowns in several affected cities (Harapan et al. 2020; Li et al. 2020a, b; Tu et al. 2020; Wang et al. 2020b). In the mid-latitudes of the northern hemisphere countries (US, Italy, Spain, Iran, UK, Germany), the number of patients exposed to Coronavirus Disease 2019 (COVID-19) increased (https://www.worldometers.info/coronavirus/, data per 31 March 2020). On March 11, 2020, World Health Organization (WHO) declared COVID-19 as a pandemic due to its global spread (WHO 2020a). However, in March 2020, cases in China, the country of origin of COVID-19, declined. Meanwhile, the cases of COVID-19 in tropical countries, including Indonesia, were more widespread. With a total population of nearly 270 million (Kompas 2020), Indonesia is a vulnerable country to such fast-spreading infectious diseases.
On March 2, 2020, the Indonesian government announced the first and second cases of COVID-19 infection of two Depok citizens outside of Jakarta City (The Jakarta Post 2020). The contact tracing showed that transmission occurred at an event held on February 14, 2020, in Jakarta. Foreign citizens were attending the event. Later on, one person was confirmed infected by the disease. Four days after the first case, another case of COVID-19 was found, and afterward, the disease continued to spread. The development of cumulative rate rapidly showed an exponential pattern. On May 15, the total COVID-19 cases reported in 34 Indonesian Provinces were 16,496, with a total of 1076 mortalities (https://www.worldometers.info/coronavirus/).
The emergenice of COVID-19 cases in Indonesia during March–May 2020, triggered discussions about the risk of COVID-19 transmission in tropical countries. Tropical countries have a warm and humid climate which is very different from the origin country where the disease was first found. Some previous studies revealed that countries located in high altitudes with low temperatures and humidity have a higher vulnerability than tropical countries. They generally found that COVID-19 transmissions are influenced by weather conditions such as temperature (Bannister-Tyrrell et al. 2020; Holtmann et al. 2020; Monami et al. 2020; Nazari Harmooshi et al. 2020; O’Reilly et al. 2020; Scafetta 2020; Xie and Zhu 2020), relative humidity (Auler et al. 2020; Nazari Harmooshi et al. 2020; Scafetta 2020; Wang et al. 2020a; Wu et al. 2020), and precipitation (Ahmadi et al. 2020; Sobral et al. 2020). Some of these studies indicated that coronavirus’s ideal conditions are around 8–10 °C with a relative humidity of about 60–90% (Chen et al. 2020; Sajadi et al. 2020). Research by Bannister-Tyrrell et al. (2020) also found a negative correlation between temperature (above 1 °C) and the estimated number of COVID-19 cases per day. They showed that COVID-19 had optimum dispersion at very low temperatures (1–9 °C). This fact indicates that in countries with high temperatures and high humidity, the risk of COVID-19 transmission is minimum.
On the other hand, the current situation shows that tropical countries are also vulnerable to COVID-19 exposure. Many tropical countries currently have a high number of COVID-19 confirmed cases (per May 15, 2020); such as Brazil (218,223), India (85,784 cases), Ecuador (31,467 cases), Singapore (26,891 cases) (https://www.worldometers.info/coronavirus/). Additionally, recent publications by Auler et al. (2020) and Luo et al. (2020) reported COVID-19 cases also thrived in high temperatures, a contradictory conclusion to previous studies by Chen et al. (2020) and Quraishi et al. (2020). This discrepancy in research results suggests that the role of weather factors on COVID-19 transmission is still an open question and has become a topic of debate (Quraishi et al. 2020; Yuan et al. 2020).
In Indonesia, the association between weather conditions and COVID-19 cases has been studied by Tosepu et al. (2020) and Asyary and Veruswati (2020). Tosepu et al. (2020) found that temperature significantly correlates to COVID-19 cases, while Asyary and Veruswati (2020) reported that sunlight exposure increased the recovery rate of COVID-19. However, the studies were done over a brief period (1 month) and only in one city, i.e., Jakarta. Extending previous studies in Indonesia, this study aims to comprehensively investigate the role of weather factors in the incidence of COVID-19 in several cities in Indonesia. While the role of social and behavioral factors have been documented considerably (see, for example, Lakshmi Priyadarsini and Suresh 2020), literature reporting a robust role of meteorological factors on the COVID-19 transmission, particularly in tropical countries, is still scarce.
Materials and methods
Materials
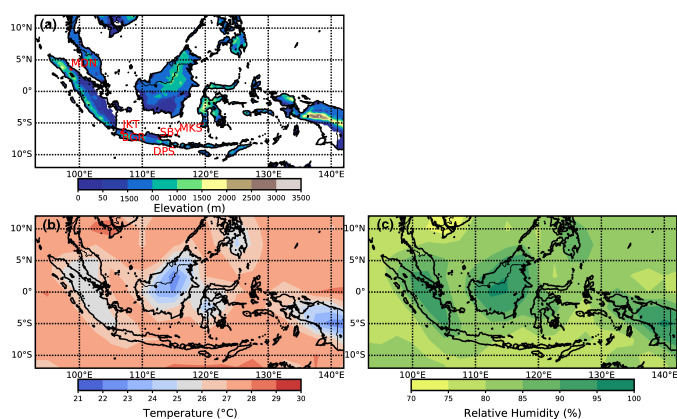
Six cities were selected for this study (See Fig. 1a) considering the cumulative confirmed cases (see Fig. 2). The location varies (north–south of equator line and western-eastern part of the country) to capture the variations of climate (see Fig. 1b, c) and the distribution of cases throughout the country. The six cities are Medan, Jakarta, Bogor, Surabaya, Denpasar, and Makassar. Specifically, Medan is a representative of cities located north of the equator line. Bogor is a representative of cities with a relatively high elevation (colder climate). Denpasar and Makassar are representatives of the eastern part of Indonesia (Table 1). Jakarta and Surabaya were selected to represent the urban area (with its urban climate), because those are the most populated cities in Indonesia. On the other hand, considering climate regions found by Aldrian and Dwi Susanto (2003), Medan was selected to represent climate region B (semi monsoonal region) while other five cities represent climate region A (monsoonal region).
Fig. 1.
The map is showing the location of six selected Indonesian cities and their elevation (a), the climatology of daily temperature (b), and relative humidity (c) for March–April based on NCEP/NCAR re-analysis data
Fig. 2.
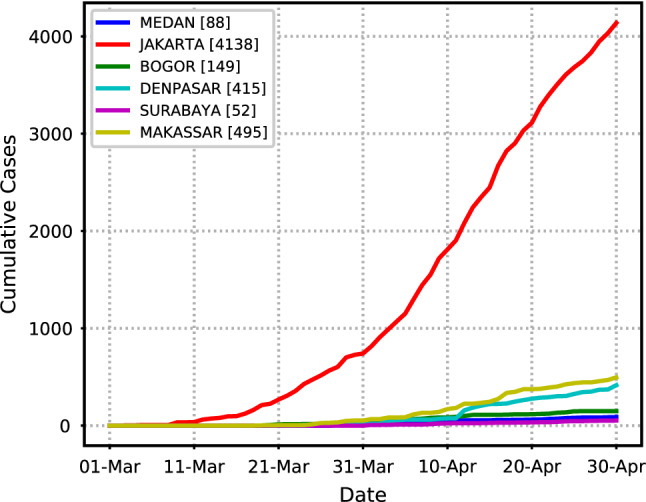
Time series of cumulative COVID-19 cases for selected cities during March 1–April 30, 2020
Table 1.
List of selected cities and their geographical characteristics
| City | Longitude | Latitude | Elevation | North–South | West–East | Period of data |
|---|---|---|---|---|---|---|
| Medan | 98.68 | 3.56 | < 50 m | North | West | 28 March 2020–30 April 2020 |
| Jakarta | 106.85 | − 6.16 | < 10 m | South | West | 2 March 2020–30 April 2020 |
| Bogor | 106.75 | − 6.55 | > 250 m | South | West | 21 March 2020–30 April 2020 |
| Surabaya | 112.78 | − 7.38 | < 10 m | South | West | 23 March 2020–30 April 2020 |
| Denpasar | 115.17 | − 8.75 | < 100 m | South | East | 1 April 2020–30 April 2020 |
| Makassar | 119.55 | − 5.07 | < 25 m | South | East | 15 March 2020–30 April 2020 |
Daily surface weather data for March–April 2020 were collected from the nearest weather station for each city (see Table 2). We selected four weather variables: average temperature (T-ave), minimum temperature (Tmin); maximum temperature (Tmax); and average relative humidity (RH). Those are frequently investigated variables in previous COVID-19 studies (Ahmadi et al. 2020; Briz-Redón and Serrano-Aroca 2020; Liu et al. 2020; Sobral et al. 2020). T-ave and RH were computed from hourly observations (24 data per day). Also, we computed the diurnal temperature range (DTR, Tmax minus Tmin) and absolute humidity (AH). AH was computed following a method used by Luo et al. (2020). Different from RH, AH is a variable describing the actual amount of water vapor in the atmosphere. Previous studies have shown that AH is more correlated to the disease compared to RH (Shaman and Kohn 2009; Metz and Finn 2015). To provide the country’s climate background, daily mean temperature and relative humidity from NCEP/NCAR Re-analysis data (Kalnay et al. 1996) for March–April during 1981–2010 were used.
Table 2.
Source of weather and COVID-19 data for six selected cities
| City | Source of weather data | Source of COVID-19 data |
|---|---|---|
| Medan | Kualanamu Airport Weather Station | https://covid19.pemkomedan.go.id/ |
| Jakarta | Kemayoran Weather Station | https://corona.jakarta.go.id/id |
| Bogor | Dramaga Climate Station | https://pikobar.jabarprov.go.id/ |
| Surabaya | Djuanda Airport Weather Station | https://lawanCOVID-19.surabaya.go.id/ |
| Denpasar | Ngurah Rai Airport Weather Station | https://safecity.denpasarkota.go.id/id/covid19 |
| Makassar | Hasanudin Airport Weather Station | https://covid19.sulselprov.go.id/ |
Daily data of new cases of COVID-19 were gathered from local government website (see Table 2). The data period varies depending on the timing of the first case of COVID-19 found in the respective city, as shown in Table 1. Only days with non-zero COVID-19 data were included in the analysis. For Makassar city, the COVID-19 data used was the total for South Sulawesi Province since Makassar’s data was not available online. However, we assumed that this province-level data was still valid for Makassar city, considering that most COVID-19 cases in South Sulawesi Province occurred in that city.
Methods
A descriptive statistical analysis was performed both at the city and country level (all data together) to explore the characteristics of confirmed case counts and weather data. Two approaches were then employed to determine the potential association between COVID-19 cases and weather data i.e., correlation tests and non-linear regression analysis. The correlation test was done for several lag time options (Liu et al. 2020; Wu et al. 2020) to consider the incubation period of COVID-19, which is on average around 5–6 days (WHO 2020b). This lag time technique is also intended to accommodate medical test lag effects to confirm COVID-19 cases. It is known that COVID-19 reported on a specific day might be due to transmission occurring several days before. In Indonesia, PCR testing (polymerase chain reaction) usually takes several days to complete (Van Empel et al. 2020; Djono et al. 2020) so that confirmed cases are published several days after the time of infection. Our subsequent analysis was based on the best lag time identified from the correlation test (i.e., lag time with the strongest coefficient correlation). Additionally, to examine associative relationships between weather data and COVID-19 data, the non-linear regression analysis was employed following a method by Luo et al. (2020). As the last step, we analyzed the distribution of COVID-19 data referring weather data to point out a possible consistent range of weather data favored by COVID-19 incidence (Bukhari and Jameel 2020). The analysis was done by visualizing COVID-19 data on a scatter plot and drawing a 90% data density contour. It means that the majority of COVID-19 data falls within the contour. By projecting the contour to the weather data (x-axis), we were able to locate the effective range of weather data favoring the COVID-19 incidence.
Results
Meteorological conditions
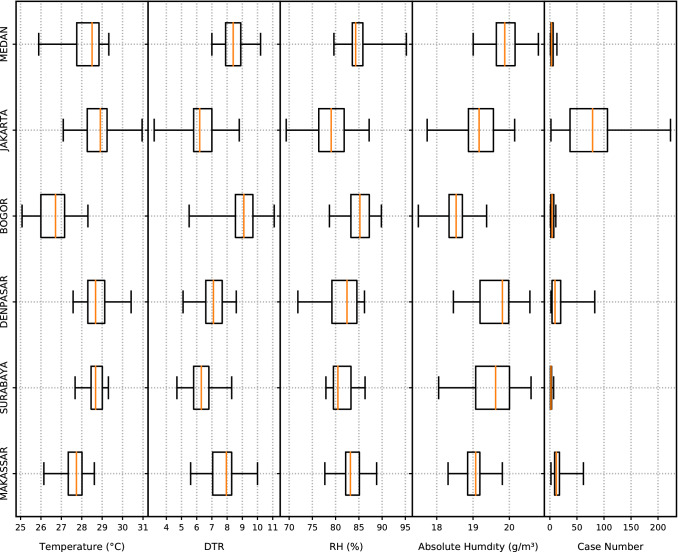
The climatology of temperature and relative humidity during March–April is shown in Fig. 1b and c. Based on NCEP/NCAR Re-analysis data, Indonesia’s March–April temperature ranges from 22 to 28 °C while relative humidity ranges from 70 to 95%. Figure 3 shows the boxplot representing the descriptive statistics for daily meteorological variables and case numbers of COVID-19 for each city. During March–April 2020, a large variation of the weather conditions was observed in Indonesia’s six selected cities. Generally, monthly rainfall is high in March–April, but some eastern Indonesia regions start to have a dry season onset. Jakarta, Surabaya, and Denpasar have the highest T-ave, while Bogor has the lowest among the six cities. For DTR, the lowest (highest) value was found in Jakarta (Bogor). As expected, unlike T-ave, the highest RH was found in Bogor, while Jakarta and Surabaya share a nearly similar range of RH data. For AH data, on the other hand, Medan had the highest mean, and Bogor had the lowest value. As shown in Fig. 3, the AH data range does not seem connected to other weather data confirming its specific characteristics. Moreover, we noted that Denpasar presented a narrow range for T-ave, DTR, and RH, suggesting a slight weather variation.
Fig. 3.
The boxplot of meteorological data and new cases of COVID-19 in six selected cities
The COVID-19 data, on the other hand, shows a large discrepancy among cities, with Jakarta having the highest number of confirmed cases. The first case of COVID-19 was found in Jakarta as the leading international gate to the country, indicating the high risk of this disease for the cities with high connectivity to other countries. During the study period (Table 1), there were 4138 COVID-19 cases in Jakarta. On average, there were approximately 75 cases of COVID-19 per day in Jakarta and less than 50 cases per day in other cities. With a population of 11 million, Jakarta is the center of national transmission of COVID-19, and early cases in other cities were mostly related to events in Jakarta.
Correlation test
The correlation of the weather variables and COVID-19 data is presented in Fig. 4. Except for AH, weather variables show a statistically significant correlation for all lag times. Our test found that T-ave is positively correlated with COVID-19 cases even though the coefficient correlation (r) is weak, with the highest r value of 0.37 found for 1- and 5-days lag time. In contrast, DTR and RH present a significantly negative correlation with relatively similar r values. The strongest correlation for DTR was found for 8 days lag time (r = − 0.39), and RH was found for 5 days lag time (r = − 0.41). On the other hand, AH shows the weakest correlation to the COVID-19 data, with r values ranging from − 0.03 to 0.05. Based on the T-ave and RH data, it was observed that the strongest correlation was found for a 5-day lag. This lag time probably indicates the average incubation period of COVID-19 in Indonesia, which is consistent with the WHO statement about this matter (WHO 2020b). Another possibility is that this 5-day lag time may represent the average interval between the timing of infection and the PCR test diagnosis. However, when looking at each city (Table 3, Supplementary Material), the r value and the lag time having the strongest correlation vary among cities.
Fig. 4.
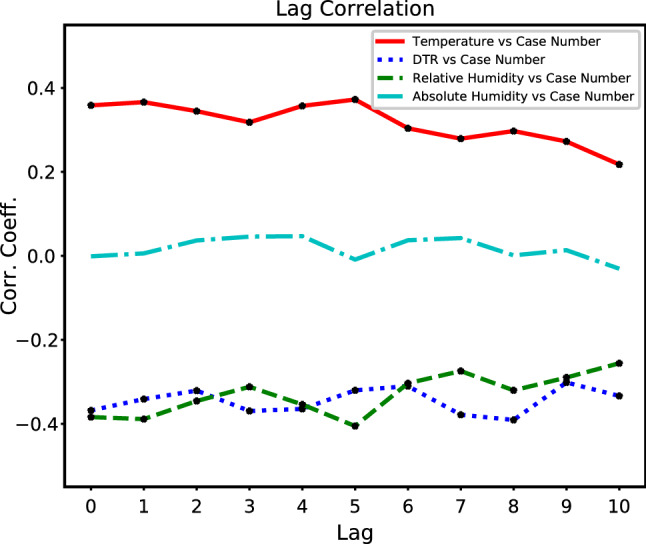
The correlation between meteorological factors and new cases of COVID-19 for total (the combination of six selected cities) for several options of lag times. Markers denote statistically significant correlation
Regression analysis
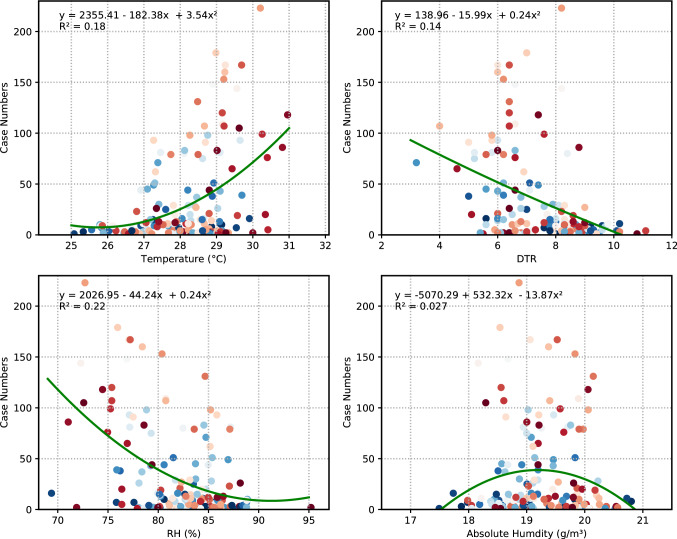
The non-linear regression analysis results between weather variables and COVID-19 data on 5 days lag time is visualized in Fig. 5. In general, the coefficient of determination (R2) for all variables are less than 20%, indicating that only a tiny part of the variance of COVID-19 data can be explained by weather variability. However, considering the statistically significant correlation between those two data, it is worth discussing the characteristics of COVID-19 data referring the range of weather data in this study.
Fig. 5.
Non-linear regression between meteorological data and COVID-19 cases. Blue to red color represents the timing of data from March to April 2020
As shown in Fig. 5, the plot suggests the confirmed number of cases increased parallel with temperature in the range of 25–31 °C. In contrast, in the range of 3–11 °C (65–95%), the confirmed cases declined as the DTR (RH) increased. On the other hand, the AH presents a different relationship pattern with more confirmed cases found at the AH of around 18–20 g/m3, the middle part of all distributions.
Distribution analysis
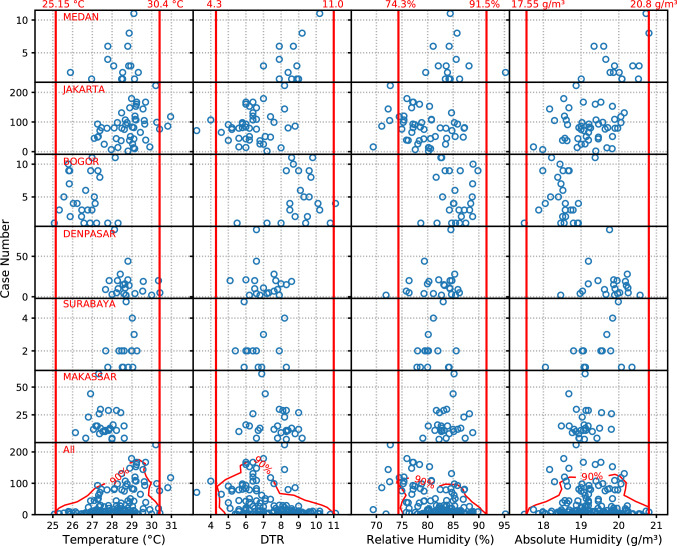
To get an idea of the effective range of weather data favoring COVID-19 transmission in Indonesia, we analyzed the distribution of COVID-19 data referring T-ave, DTR, RH, and AH, as shown in Fig. 6. During March–April 2020, 90% of confirmed cases in the six selected cities (shown by contour on the scatter plot) occurred in the T-ave range between 25 and 31 °C. Additionally, the bounds of DTR of 90% of the total confirmed cases was around 4–11 °C, and that of RH (AH) was about 74–92% (17–21 g/m3). Outside of those bounds, the number of confirmed cases was generally low. For instance, for T-ave > 31 or RH < 74%, the number of confirmed cases was minimum. These results may indicate the particular range of weather conditions that favor COVID-19 incidence.
Fig. 6.
Scatter plot of COVID-19 data with respect to weather data. The red contour represents 90% of COVID-19 data density, indicating the majority of data. Red vertical lines are the bounds of each weather variable, with 90% of COVID-19 data falling within those ranges
Discussion
This study is the first time on the link between meteorological parameters and COVID-19 incidence in Indonesia’s multi-cities. The study extends the research by Tosepu et al. (2020), which examines the correlation between weather and the COVID-19 pandemic in Jakarta, Indonesia. Our work also contributes to the insight for understanding the characteristics of COVID-19 cases, particularly for tropical climate regions, which are still limited in reference (Auler et al. 2020). It is known that most of the research on the link of weather data and COVID-19 cases available in the literature comes from sub-tropical countries (Briz-Redón and Serrano-Aroca 2020; Iqbal et al. 2020; Jüni et al. 2020).
We found that during the study period, the daily average temperature positively correlated to the COVID-19 cases, in agreement with previous studies reported by Auler et al. (2020), Liu et al. (2020), and Tosepu et al. (2020). In contrast, DTR and RH present a significant negative correlation with COVID-19 data, while AH shows an inconsistent correlation among all lag times studied. Our findings on T-ave and DTR’s role are consistent with the study by Liu et al. (2020). They found that the number of confirmed cases in China from January 20 to March 2, 2020, tended to increase (decline) following an increase in temperature (DTR). Our study also found that a lag time of 5-day presented the strongest correlation for T-ave and RH, which probably indicates the average time between exposure and diagnosis.
The regression analysis results confirmed the link between weather data and the COVID-19 data with a 5-day lag time. As shown in Fig. 5, we observed that the number of confirmed cases increased following an increase in temperature or decreased DTR and RH. These findings indicate that the COVID-19 incidence may be partially affected by meteorological factors. However, it is essential to mention that both the coefficient correlation and coefficient of determination were considerably low, i.e., about − 0.4–0.4 and less than 20%, respectively. This low value suggests that the effect of meteorological factors is limited, and non-meteorological factors might largely influence the COVID-19 incidence. It seems that a significant positive correlation between T-ave and COVID-19 data was found because the temperature gradually increased from March to April following the seasonal change, while at the same time, the confirmed cases of COVID-19 increased due to the rapid spread of disease.
Our findings contrast with previous studies conducted in regions with colder climates reporting that the increase in temperature could reduce COVID-19 transmission (Holtmann et al. 2020; Wang et al. 2020a). They, in general, found that lower temperatures favored COVID-19 cases. However, later studies in China by Liu et al. (2020) and in Brazil by Auler et al. (2020) reveal that an increase of confirmed cases follows the increase of temperature, and high temperature supports COVID-19 transmission as well. This contradictory finding indicates that the potency of high temperature and high humidity in reducing the transmission of COVID-19 might not be valid for tropical regions where the average temperature and relative humidity are climatologically high. For instance, the six selected cities in Indonesia during March and April 2020 registered a daily temperature higher than 25 °C and a daily relative humidity of more than 65%. This range of weather data is beyond the effective bound for COVID-19 cases suggested by previous studies (Chen et al. 2020; Sajadi et al. 2020). Furthermore, our distribution analysis revealed that most COVID-19 cases (90% of cases) occurred within the temperature range of 25–31 °C and the RH range of 74–92%. Our results are in agreement with the study by Auler et al. (2020), who found that the COVID-19 transmission rate in Brazil was initially observed to be favored by higher mean temperatures (27.5 °C) as well as intermediate relative humidity (near 80%).
We emphasize that this study presents preliminary analysis, and the investigation was limited to meteorological factors. A more extended study period and more sampling of affected cities might better represent the association between meteorological conditions and COVID-19 incidence. It has been reported that, besides being influenced by meteorological factors, the number of confirmed COVID-19 cases in a country depends on multiple factors, including the extent of testing conducted (Rohde 2020), population (Ahmadi et al. 2020; Briz-Redón and Serrano-Aroca 2020), social dynamics/migration scale (Kuper-Smith et al. 2020; O’Reilly et al. 2020; Wilder-Smith and Freedman 2020), governmental policies such as the limitation of public transport (Jüni et al. 2020; Miller et al. 2020; Shen et al. 2020), etc. In Indonesia, the number of daily confirmed cases at a national level is closely correlated with the extent of testing conducted. A coefficient correlation of 0.71 suggests that the detected confirmed cases depend primarily on the government’s testing extent (Fig. 7).
Fig. 7.
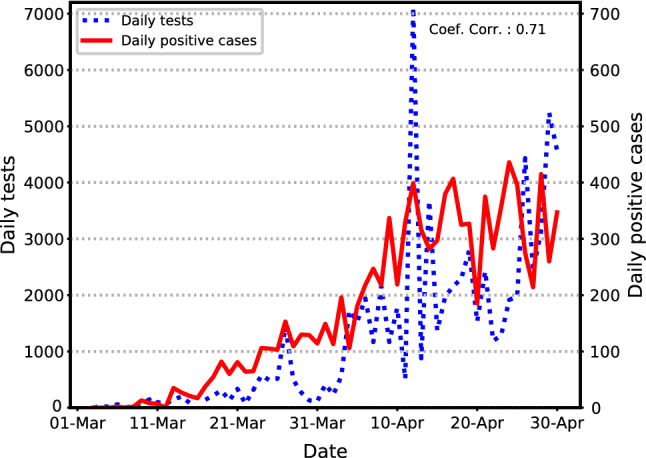
Time series of daily testing numbers taken by the government and daily new cases detected from the test
Conclusion
Our study demonstrates that weather conditions are weakly associated with the COVID-19 incidence, particularly in Indonesia’s six selected cities. This study is the first comprehensive research that has attempted to explore the effects of meteorological factors on the COVID-19 cases in multi-locations in Indonesia, an example of a country with a tropical climate. Daily mean temperature (diurnal range of temperature and relative humidity) presents a statistically positive (negative) significant correlation to confirmed COVID-19 cases. During the selected study period, March–April 2020, the majority of COVID-19 incidences in Indonesia were observed to occur in the daily temperature range of 25–31 °C and relative humidity of 74–92%. However, it should be noted that the effect of meteorological factors is limited, considering the low value of coefficient correlation and coefficient of determination presented in this study. Thus, non-meteorological factors have to be considered to have more control over the COVID-19 pandemic.
Supplementary Information
Below is the link to the electronic supplementary material.
Author contributions
SS and DEN contributed equally as the main contributor of this paper. All authors were involved in reviewing and editing the original manuscript.
Funding
Not applicable.
Data availability
Not applicable.
Code availability
Not applicable.
Declarations
Conflict of interest
The authors declare that they have no known competing interests or personal relationships that could have appeared to influence the work reported in this paper.
Footnotes
Publisher's Note
Springer Nature remains neutral with regard to jurisdictional claims in published maps and institutional affiliations.
References
- Aditya D, Lona O, Dina M (2020) PCR testing spearhead in fight against Covid-19 : Siloam. Jakarta Globe
- Ahmadi M, Sharifi A, Dorosti S, et al. Investigation of effective climatology parameters on COVID-19 outbreak in Iran. Sci Total Environ. 2020 doi: 10.1016/j.scitotenv.2020.138705. [DOI] [PMC free article] [PubMed] [Google Scholar]
- Aldrian E, Dwi Susanto R. Identification of three dominant rainfall regions within Indonesia and their relationship to sea surface temperature. Int J Climatol. 2003;23:1435–1452. doi: 10.1002/joc.950. [DOI] [Google Scholar]
- Asyary A, Veruswati M. Sunlight exposure increased Covid-19 recovery rates: a study in the central pandemic area of Indonesia. Sci Total Environ. 2020;729:139016. doi: 10.1016/j.scitotenv.2020.139016. [DOI] [PMC free article] [PubMed] [Google Scholar]
- Auler AC, Cássaro FAM, da Silva VO, Pires LF. Evidence that high temperatures and intermediate relative humidity might favor the spread of COVID-19 in tropical climate: a case study for the most affected Brazilian cities. Sci Total Environ. 2020;729:139090. doi: 10.1016/j.scitotenv.2020.139090. [DOI] [PMC free article] [PubMed] [Google Scholar]
- Bannister-Tyrrell M, Meyer A, Faverjon C, Cameron A. Preliminary evidence that higher temperatures are associated with lower incidence of COVID-19, for cases reported globally up to 29th February 2020. MedRxiv. 2020 doi: 10.1101/2020.03.18.20036731. [DOI] [PMC free article] [PubMed] [Google Scholar]
- Briz-Redón Á, Serrano-Aroca Á. A spatio-temporal analysis for exploring the effect of temperature on COVID-19 early evolution in Spain. Sci Total Environ. 2020;728:138811. doi: 10.1016/j.scitotenv.2020.138811. [DOI] [PMC free article] [PubMed] [Google Scholar]
- Bukhari Q, Jameel Y. Will coronavirus pandemic diminish by summer? SSRN Electron J. 2020 doi: 10.2139/ssrn.3556998. [DOI] [Google Scholar]
- Chen B, Liang H, Yuan X, et al. Roles of meteorological conditions in COVID-19 transmission on a worldwide scale. MedRxiv. 2020 doi: 10.1101/2020.03.16.20037168. [DOI] [Google Scholar]
- Harapan H, Itoh N, Yufika A, et al. Coronavirus disease 2019 (COVID-19): a literature review. J Infect Public Health. 2020;13:667–673. doi: 10.1016/j.jiph.2020.03.019. [DOI] [PMC free article] [PubMed] [Google Scholar]
- Holtmann M, Jones M, Shah A, Holtmann G. Low ambient temperatures are associated with more rapid spread of COVID-19 in the early phase of the endemic. Environ Res. 2020;186:109625. doi: 10.1016/j.envres.2020.109625. [DOI] [PMC free article] [PubMed] [Google Scholar]
- Iqbal N, Fareed Z, Shahzad F, et al. The nexus between COVID-19, temperature and exchange rate in Wuhan city: new findings from partial and multiple wavelet coherence. Sci Total Environ. 2020;729:138916. doi: 10.1016/j.scitotenv.2020.138916. [DOI] [PMC free article] [PubMed] [Google Scholar]
- Jüni P, Rothenbühler M, Bobos P, et al. Impact of climate and public health interventions on the COVID-19 pandemic: a prospective cohort study. Can Med Assoc J. 2020;192:E566–E573. doi: 10.1503/cmaj.200920. [DOI] [PMC free article] [PubMed] [Google Scholar]
- Kalnay E, Kanamitsu M, Kistler R, et al. The NCEP/NCAR 40-year reanalysis project. Bull Am Meteorol Soc. 1996;77:437–471. doi: 10.1175/1520-0477(1996)077<0437:TNYRP>2.0.CO;2. [DOI] [Google Scholar]
- Kompas (2020) Jumlah Penduduk Indonesia 2020. Kompas.com
- Kuper-Smith BJ, Doppelhofer L, Oganian Y et al (2020) Optimistic beliefs about the personal impact of COVID-19. PsyArXiv 1–4. 10.31234/osf.io/epcyb
- Lakshmi Priyadarsini S, Suresh M. Factors influencing the epidemiological characteristics of pandemic COVID 19: a TISM approach. Int J Healthc Manag. 2020;13:89–98. doi: 10.1080/20479700.2020.1755804. [DOI] [Google Scholar]
- Li H, Liu SM, Yu XH, et al. Coronavirus disease 2019 (COVID-19): current status and future perspectives. Int J Antimicrob Agents. 2020;55:105951. doi: 10.1016/j.ijantimicag.2020.105951. [DOI] [PMC free article] [PubMed] [Google Scholar]
- Li Q, Guan X, Wu P, et al. Early transmission dynamics in Wuhan, China, of novel coronavirus-infected pneumonia. N Engl J Med. 2020;382:1199–1207. doi: 10.1056/NEJMoa2001316. [DOI] [PMC free article] [PubMed] [Google Scholar]
- Liu J, Zhou J, Yao J, et al. Impact of meteorological factors on the COVID-19 transmission: a multi-city study in China. Sci Total Environ. 2020;726:138513. doi: 10.1016/j.scitotenv.2020.138513. [DOI] [PMC free article] [PubMed] [Google Scholar]
- Luo W, Majumder MS, Liu D, et al. The role of absolute humidity on transmission rates of the COVID-19 outbreak. MedRxiv. 2020 doi: 10.1101/2020.02.12.20022467. [DOI] [PMC free article] [PubMed] [Google Scholar]
- Metz JA, Finn A. Influenza and humidity - Why a bit more damp may be good for you! J Infect. 2015;71:S54–S58. doi: 10.1016/j.jinf.2015.04.013. [DOI] [PubMed] [Google Scholar]
- Miller MJ, Loaiza JR, Takyar A, Gilman RH. Covid-19 in latin america: novel transmission dynamics for a global pandemic? PLoS Negl Trop Dis. 2020;14:3–7. doi: 10.1371/JOURNAL.PNTD.0008265. [DOI] [PMC free article] [PubMed] [Google Scholar]
- Monami M, Silverii A, Mannucci E. Potential impact of climate on novel Corona Virus (COVID-19) epidemic. J Occup Environ Med. 2020;62:371–372. doi: 10.1097/JOM.0000000000001885. [DOI] [PMC free article] [PubMed] [Google Scholar]
- Nazari Harmooshi N, Shirbandi K, Rahim F. Environmental concern regarding the effect of humidity and temperature on SARS-COV-2 (COVID-19) survival: fact or fiction. Environ Sci Pollut Res. 2020 doi: 10.1007/s11356-020-09733-w. [DOI] [PMC free article] [PubMed] [Google Scholar]
- O’Reilly KM, Auzenbergs M, Jafari Y, et al. Effective transmission across the globe: the role of climate in COVID-19 mitigation strategies. Lancet Planet Health. 2020;4:e172. doi: 10.1016/S2542-5196(20)30106-6. [DOI] [PMC free article] [PubMed] [Google Scholar]
- Quraishi SA, Berra L, Nozari A. Indoor temperature and relative humidity in hospitals: workplace considerations during the novel coronavirus pandemic. Occup Environ Med. 2020;77:508. doi: 10.1136/oemed-2020-106653. [DOI] [PubMed] [Google Scholar]
- Rohde R (2020) The relationship between coronavirus (COVID-19) spread and the weather. In: berkeleyearth.org. http://berkeleyearth.org/coronavirus-and-the-weather/. Accessed 2 June 2020
- Sajadi MM, Habibzadeh P, Vintzileos A, et al. Temperature, humidity, and latitude analysis to estimate potential spread and seasonality of Coronavirus Disease 2019 (COVID-19) JAMA Netw Open. 2020;3:e2011834. doi: 10.1001/jamanetworkopen.2020.11834. [DOI] [PMC free article] [PubMed] [Google Scholar]
- Scafetta N. Distribution of the SARS-CoV-2 pandemic and its monthly forecast based on seasonal climate patterns. Int J Environ Res Public Health. 2020;17:1–34. doi: 10.3390/ijerph17103493. [DOI] [PMC free article] [PubMed] [Google Scholar]
- Shaman J, Kohn M. Absolute humidity modulates influenza survival, transmission, and seasonality. Proc Natl Acad Sci USA. 2009;106:3243–3248. doi: 10.1073/pnas.0806852106. [DOI] [PMC free article] [PubMed] [Google Scholar]
- Shen K, Yang Y, Wang T, et al. Diagnosis, treatment, and prevention of 2019 novel coronavirus infection in children: experts’ consensus statement. World J Pediatr. 2020 doi: 10.1007/s12519-020-00343-7. [DOI] [PMC free article] [PubMed] [Google Scholar]
- Sobral MFF, Duarte GB, da Penha Sobral AIG, et al. Association between climate variables and global transmission oF SARS-CoV-2. Sci Total Environ. 2020;729:138997. doi: 10.1016/j.scitotenv.2020.138997. [DOI] [PMC free article] [PubMed] [Google Scholar]
- The Jakarta Post (2020) BREAKING: Jokowi announces Indonesia’s first two confirmed COVID-19 cases. pp 2–9. http://www.thejakartapost.com. Accessed 24 June 2020
- Tosepu R, Gunawan J, Effendy DS, et al. Correlation between weather and Covid-19 pandemic in Jakarta. Indones Sci Total Environ. 2020 doi: 10.1016/j.scitotenv.2020.138436. [DOI] [PMC free article] [PubMed] [Google Scholar]
- Tu H, Tu S, Gao S, et al. Current epidemiological and clinical features of COVID-19; a global perspective from China. J Infect. 2020;81:1–9. doi: 10.1016/j.jinf.2020.04.011. [DOI] [PMC free article] [PubMed] [Google Scholar]
- Van Empel G, Mulyanto J, Wiratama BS. Undertesting of COVID-19 in Indonesia: what has gone wrong ? J Glob Health. 2020;10:19–21. doi: 10.7189/jogh.10.020306. [DOI] [PMC free article] [PubMed] [Google Scholar]
- Wang J, Tang K, Feng K, Lv W. High temperature and high humidity reduce the transmission of COVID-19. SSRN Electron J. 2020 doi: 10.2139/ssrn.3551767. [DOI] [Google Scholar]
- Wang L, Wang Y, Ye D, Liu Q. Review of the 2019 novel coronavirus (SARS-CoV-2) based on current evidence. Int J Antimicrob Agents. 2020 doi: 10.1016/j.ijantimicag.2020.105948. [DOI] [PMC free article] [PubMed] [Google Scholar]
- WHO (2020a) WHO Director-General’s opening remarks at the media briefing on COVID-19. In: World Heal. Organ. https://www.who.int/dg/speeches/detail/who-director-general-s-opening-remarks-at-the-media-briefing-on-covid-19---11-march-2020. Accessed 31 May 2020
- WHO (2020b) Coronavirus Disease 2019 (COVID-19) situation report - 73. Jeneva
- Wilder-Smith A, Freedman DO. Isolation, quarantine, social distancing and community containment: pivotal role for old-style public health measures in the novel coronavirus (2019-nCoV) outbreak. J Travel Med. 2020;27:1–4. doi: 10.1093/jtm/taaa020. [DOI] [PMC free article] [PubMed] [Google Scholar]
- Wu Y, Jing W, Liu J, et al. Effects of temperature and humidity on the daily new cases and new deaths of COVID-19 in 166 countries. Sci Total Environ. 2020;729:1–7. doi: 10.1016/j.scitotenv.2020.139051. [DOI] [PMC free article] [PubMed] [Google Scholar]
- Xie J, Zhu Y. Association between ambient temperature and COVID-19 infection in 122 cities from China. Sci Total Environ. 2020;724:138201. doi: 10.1016/j.scitotenv.2020.138201. [DOI] [PMC free article] [PubMed] [Google Scholar]
- Yuan S, Jiang SC, Li ZL. Do humidity and temperature impact the spread of the novel coronavirus? Front Public Health. 2020;8:8–11. doi: 10.3389/fpubh.2020.00240. [DOI] [PMC free article] [PubMed] [Google Scholar]
Associated Data
This section collects any data citations, data availability statements, or supplementary materials included in this article.
Supplementary Materials
Data Availability Statement
Not applicable.
Not applicable.


