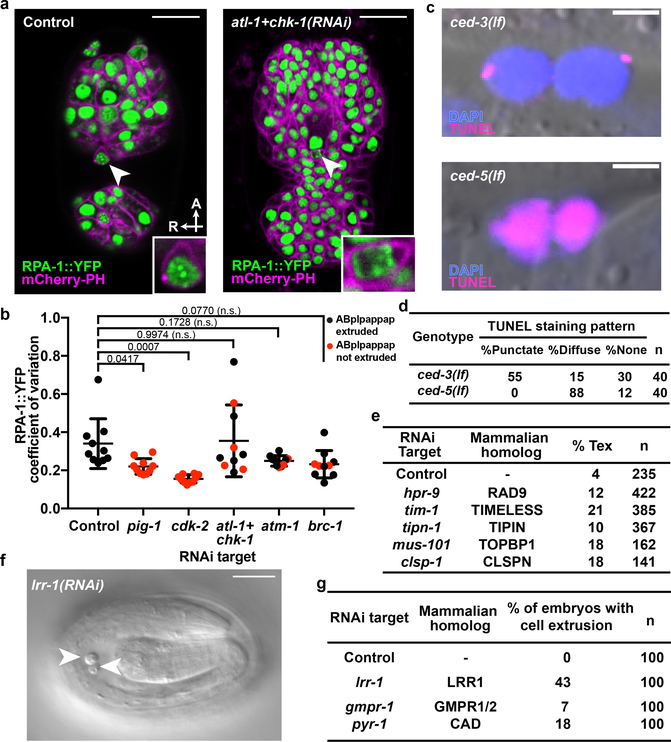
Figure 3. Replication stress is coincident with and promotes cell extrusion.
a, Confocal fluorescence micrographs showing the localization of RPA-1::YFP in ABplpappap (arrowhead) in ced-3(lf); ltIs44; opIs263[Prpa-1::rpa-1::YFP] embryos after the indicated RNAi treatment. Inset, magnified view of ABplpappap. A, anterior; R, right. Scale bars, 10 μm. b, Coefficient of variation of RPA-1::YFP fluorescence intensity in ABplpappap in ced-3(lf); ltIs44; opIs263 embryos after the indicated RNAi treatments. n=10 embryos (biological replicates) for each RNAi treatment. Black data point, ABplpappap extruded. Red data point, ABplpappap not extruded. All data are represented as Mean ± S.D. Ordinary one-way ANOVA with Dunnett’s correction for multiple comparison was performed. P values are indicated; n.s., not significant. c, Merged Nomarski and fluorescence micrographs showing DAPI and TUNEL staining in extruded cells in embryos of indicated genotype. Scale bars, 2 μm. d, Percentage of observed extruded cells in embryos of the indicated genotypes with the indicated TUNEL staining pattern. e, The percentages of animals with the Tex phenotype in ced-3(lf) animals after the indicated RNAi treatment along with mammalian homolog of the RNAi target. f, Nomarski micrograph showing cells extruded (arrowheads) from wild-type embryos after lrr-1(RNAi). Scale bar, 10 μm. g, Percentages of wild-type embryos exhibiting cell extrusion after the indicated RNAi treatments along with mammalian homologs of RNAi targets.

