Abstract
Benzene, a known occupational and environmental contaminant, has been recognized as the hematotoxin and human carcinogen. Lipids have a variety of important physiological functions and the abnormal lipid metabolism has been reported to be closely related to the occurrence and development of many diseases. In the present study, we aim to utilize LC–MS/MS lipidomic platform to identify novel biomarkers and provide scientific clues for mechanism study of benzene hematotoxicity. Results showed that a total of 294 differential metabolites were obtained from the comparison of benzene-treated group and control group. The glycerophospholipid pathway was altered involving the down-regulation of the levels of phosphatidylcholine and phosphatidylserine. In addition, phosphatidylethanolamine (PE) and 1-Acyl-sn-glycero-3-phosphocholine levels were increased in benzene-treated group. Based on the relationship between PE and autophagy, we then found that effective biomarker of autophagy, Beclin1 and LC3B, were increased remarkably. Furthermore, following benzene treatment, significant decreases in glucosylceramide (GlcCer) and phytosphingosine (PHS) levels in sphingolipid pathway were observed. Simultaneously, the levels of proliferation marker (PCNA and Ki67) and apoptosis regulator (Bax and Caspase-3) showed clear increases in benzene-exposed group. Based on our results, we speculate that disturbances in glycerophospholipid pathway play an important role in the process of benzene-induced hematopoietic toxicity by affecting autophagy, while sphingolipid pathway may also serve as a vital role in benzene-caused toxicity by regulating proliferation and apoptosis. Our study provides basic study information for the future biomarker and mechanism research underlying the development of benzene-induced blood toxicity.
Keywords: benzene, hematotoxicity, lipidomic, glycerophospholipid, sphingolipid pathway
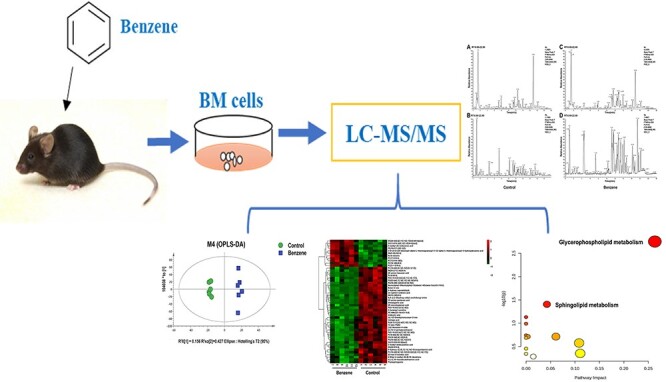
Graphical abstract
Introduction
Benzene is a class of aromatic compound with a wide range of applications in industrial and chemical manufacturing, such as rubbers, dyes, shoes and automobiles. As a known carcinogen, benzene is associated with a variety of adverse health effects, such as myelodysplastic syndrome and leukemia. Chronic benzene poisoning caused by occupational exposure in many developing countries has become one of major public health concerns [1, 2]. In addition, although the level of environmental benzene exposure among the general population is far lower than that of those exposed in the occupational workplace, it occurs occasionally that childhood leukemia or other hematological diseases caused by inhalation of decoration solvents (such as paint and glue) containing benzene or toluene as raw materials [3]. So far, although many scholars have done extensive experiments and population studies, there is still a lack of specific biomarker related with early hematopoietic injury caused by benzene exposure [4, 5]. Therefore, there is an urgent need to find novel biomarkers involved in benzene-induced hematopoietic toxicity and provide scientific basis for the early identification and prevention of benzene toxicity.
Lipids are a fundamental part of the biofilm, as well as the metabolites of organisms, which play a crucial role in cell energy storage, composition and signal transduction. In recent years, some studies have shown that lipids are potential biomarkers for multiple diseases [6]. Kouba et al. [7] reported that lysophosphatidic acid and arachidonic acid (AA), two kinds of lipids, were at high concentrations in epithelial ovarian cancer patients and related to proliferation and migration of cancer cells. According to previous research, six specific lipids including phosphatidylcholine (PC) (20: 2/20: 5ay) serve as potential biomarkers for early diagnosis of breast cancer [8]. Additionally, the role of lipids in disease has been widely investigated, with particular emphasis on the relevant to blood system diseases. Recent studies have shown that the level of PGF2α was elevated in the plasma as well as bone marrow (BM) in patients with acute myeloid leukemia (AML) [9]. Usman et al. [10] have reported that total cholesterol and low-density lipoprotein levels were significantly decreased in male participants of the AML population. Given the important role of lipids in hematological diseases, investigation of disturbances in lipids caused by benzene exposure may provide novel insights into the potential biomarker finding.
Since the crucial role of lipids in cell, tissue and organ physiology, there has been increased interest in research aimed at lipid role in the occurrence and development of various diseases and mechanism studies. As a comprehensive analysis of the lipid system of the body, lipidomics now has developed into a holistic research method to qualitatively and quantify lipid metabolite. Lipidomics analysis is helpful for molecular mechanism study through a serial of procedures: sample preparation, data acquisition, data processing and data interpretation [11, 12]. Furthermore, the pathways and networks of lipid metabolism were used to identify the molecular mechanisms responsible for disease pathogenesis [13]. Yang et al. [14] have found that abnormal glycerophospholipid metabolism pathway may be associated with lipid metabolism disorder caused by hyperuricemia through lipidomic investigation. Wu et al. [15] found that phospholipid metabolism may relate to the process of regulating Huang-Qi-San for treating early type 2 diabetes based on UPLC/Q-TOF-MS lipidomic method. Hence, it is reasonable to use lipidomics to study the mechanism of benzene-induced hematopoietic toxicity.
Previous studies from our lab reported that 150-mg/kg benzene caused hematotoxicity [16]. In this study, we compared BM lipidomic profiles in control mice and 150-mg/kg benzene exposure mice using LC–MS/MS technology. OPLS-DA was performed to identify differential lipids. Results showed that a total of 294 lipids identified could be used as potential biomarkers. Furthermore, glycerophospholipid metabolism and sphingolipids metabolism were deregulated in benzene-treated group through Metabolomic Pathway Analysis (MetPA). To investigate the role of glycerophospholipid metabolism and sphingolipids metabolism in benzene toxicity, we assessed the expression of key enzymes and cellular physiology-related genes. Our research in identification of benzene exposure-associated lipids and biological pathways may provide new clues for finding early screening biomarkers and mechanism research of benzene-induced hematotoxicity.
Materials and Methods
Materials
Benzene was produced by Sigma Co. (St. Louis, USA). HPLC grade acetonitrile, methanol, water and isopropanol were obtained from CNW Technologies GmbH (Dusseldorf, Germany). L-2-chlorophenylalanine was obtained from Hengchuang Bio-technology Co., Ltd (Shanghai, China).
Methods
Animal treatment
The study protocols were approved by the Research Ethics Committee of Southeast University (Nanjing, China, approve number: 20181224006). Male C57BL/6 mice with an initial body weight of 20 ± 3 g (aging ~7 ± 1 weeks) were kept in specific pathogen-free houses (23 ± 1°C, with a relative humidity of 50 ± 10% and a 12-hour light/dark cycle). There were 6 mice in each cage. All mice have free access to sterile food and water and adapt to these conditions for a week before starting the experiment. Based on our previous study [16], mice were subcutaneously injected with 150-mg/kg benzene, once a day for 30 days. Another group of randomly assigned mice served as the untreated controls. Each group contained 6 mice. The weight of mice was checked every other week. At the end of the treatment cycle, mice were euthanised by cervical dislocation. The BM cells were harvested from the four murine limbs.
Sample preparation
Mouse BM cells were collected and transferred to a 1.5-ml sterile Eppendorf tube. Two small steel balls were added into each tube. Twenty microlitre of internal standard (0.3 mg/ml of L-2-chlorophenylalanine dissolved in methanol) and 600 μl of methanol /water mixture (4/1, v/v) were added into each sample. Then, 600 μl of chloroform was added and the mixture was ultrasonicated on ice for 6 min. All solution was transferred into a pointed glass centrifuge tube and extracted with ultrasonication in an ice-water bath for 10 min. After centrifugation at 7500 rpm at 4°C for 10 min, the lower layer of liquid was injected into a GC–MS vial and vacumm dried. Then, 600 μl of chloroform/ methanol (2/1, v/v) was added into upper layer of liquid, vortexed for 30 s and ultrasonicated in an ice-water bath for 10 min. Again, the solution in lower layer was put into the treated upper layer sample vial and dried using a centrifugal vacuum evaporator. The lipid extracts were reconstituted in 600 μl of isopropanol/methanol (1/1, v/v) and centrifuged at 13 000 rpm for 10 min at 4°C. Finally, 200 μl of supernatant was prepared for LC–MS/MS analysis. The quality control sample was a mixture taken from each sample with equal volume.
LC–MS/MS-based lipidomics analysis
The LC–MS/MS lipidomics analysis was carried out on a Nexera UPLC (Shimadzu, Kyoto, Japan) coupled to a Q Exactive mass spectrometer (Thermo Scientific™). An ACQUITY UPLC BEH C18 column (1.7 um, 2.1 × 100 mm) was used in both positive and negative modes. The column was maintained at 45°C and the flow rate was 0.35 ml/min. The mobile phase was: (A) acetonitrile: water = 6: 4 (v/v), (B) acetonitrile: isopropanol = 1:9 (v/v). Both solvent A and B were added with 10 mmol/l ammonium formate and 0.1% formic acid. The gradient was 0–3 min maintained at 30% B; 3–5 min from 30 to 62% B; 5–15 min from 62 to 82% B; 15–16.5 min to 99% B and maintained for 1.5 min; and 18.1 min reduced to 30% B and maintained for 3.9 min. The whole process took 22 min. The mass parameters were set as follows: heater temperature, 300°C; sheath gas flow rate, 45 arb; aux gas flow rate, 15 arb; sweep gas flow rate, 1arb; capillary temperature, 320°C; S-Lens RF level, 50%; the spray voltage was set at 3.5 KV in positive mode and 3.1 KV in negative mode, respectively. The MS1 scan range was from 120 to 1800. The mass-to-charge ratio of lipid molecules and lipid fragments was collected as follows: 10 fragment maps (MS2 scan, high-energy collisional dissociation) were acquired after each full scan. The resolution of MS1 was 70 000 and MS2 resolution was 17 500 (at m/z 200). The QC samples were injected every six samples throughout the analytical run.
Multivariate data processing
The raw data were collected by UNIFI 1.8.1. software and then analyzed using Progenesis QI v2.3 software (Nonlinear Dynamics, Newcastle, UK). The peak identification, lipid identification, peak extraction and alignment and quantification were proceeded. Following parameters were used: precursor tolerance: 5 ppm; product tolerance: 5 ppm and product ion threshold: 5%. After Progenesis QI analysis, compounds were identified based on accurate masses, secondary fragments and isotopic distributions using the Lipidmaps (v2.3) database. For the extracted data, the lipid molecules with >50% missing values in the group were deleted. Multidimensional statistical analysis was conducted using SIMCA-P 14.1 (Umetrics, Umea, Sweden), including unsupervised principal component analysis (PCA) analysis, supervised exclusion least squares discriminant analysis (PLS-DA) and orthogonal partial least squares-discriminant analysis (OPLS-DA). Based on the OPLS-DA, the variable importance plot (VIP) > 1 was selected, and the P-value of the student’s t test <0.05 was considered to be significantly different.
Metabolite annotation and pathway analysis
To gain the metabolic pathway enrichment analysis associated with benzene treatment, differential lipids were assessed by MetaboAnalyst 5.0 (http://www.metaboanalyst.ca) online software. In detail, metabolic pathway was calculated by differentially expressed lipids detected in both ion modes. MetaboAnalyst is a free database to disclose metabolic pathway. The combination of powerful path enrichment analysis results and topological analysis gives MetaboAnalyst an advantage. MetPA (Metabolomic Pathway Analysis) can identify pathways that are significantly changed under specific experimental conditions.
RNA isolation and qRT-PCR
Total RNA was extracted using the Trizol method. The reverse transcriptase Takara Taq kit (Takara Bio, Shiga, Japan) was used to generate cDNA. Specific primers (Generry, Shanghai, China) were used to perform qRT-PCR on the cDNA. The qPCR procedure was designed under the following conditions: was 95°C for 5 s, then 40 cycles of 95°C for 15 s, 60°C for 60 s and 95°C for 15 s. The relative expression level of the gene was normalized to β-actin. The primer was showed in Table 1. All the samples were done in duplicates, three independent times. The 2-∆∆Ct method was calculated the relative gene expression.
Table 1.
primers used in the article
| Gene | Primer (5′–3′) | |
|---|---|---|
| mouse | Actin | F1-CCTCACTGTCCACCTTCC; R2-GGGTGTAAAACGCAGCTC |
| mouse | cept1 | F-AGACACCAGTTAAAACGGCTA; R-GGCAATCCATGAGGGTACT |
| mouse | chpt1 | F-GGTAAAGGCGCTAGGTGAG; R-GCAGCCAGGTCCAGTAAA |
| mouse | pisd | F-CCAACGAGTTTGCTGTCAT; R-TCACCCCAAAGGTCCAG |
| mouse | ptdss1 | F-TCCTGTTGTGCAATGGTG; R-TGGTGTGGATGTCCTTGA |
| mouse | ptdss2 | F-AAGCTAAAGACGGGCCATT; R-AGAAACTGTCGGCCATCC |
| mouse | Lcat | F-GCGGGATGAGACAGTGC; R-ACAGGCTTCCCATAAGCG |
| mouse | Degs1 | F-AGTGATGCTCGGAAGCTG; R-TGAGTGCAGGGGAGTGA |
| mouse | UGCG | F-AATGTGTGACGGGGATGT; R-CAACCTCGGTCGGCTAT |
| mouse | LC3B | F-CAGCCACACCCTTTCACT; R-GTCAGCAACCCCTGGAC |
| mouse | Beclin1 | F-ATTGAAGACACTGGAGGCA; R-CAGGCAAGACCCCACTT |
| mouse | Bax | F-GCCTCCTCTCCTACTTCGG; R-TCAGCCCATCTTCTTCCAG |
| mouse | Bcl-2 | F-ACAAGTGCCTGCTTTATGG; R-CTGCTCTGTTCCAAACCC |
| mouse | Caspase-3 | F-TGTGCTAGAAACGAAAGGG; R-CCATAAGGAGGCCAGGA |
| mouse | PCNA | F-TCCTGTTGTGCAATGGTG; R-TGGTGTGGATGTCCTTGA |
| mouse | Ki67 | F-TCCAGTGAAGGAGAAGCAG; R-TGATGGGCTCAGGTATGTC |
F1: Forward primer;
R2: Reverse primer.
Statistical analysis
All data were statistically analyzed by a two-tailed Student’s t test using SPSS 22.0 statistical software. The quantitative data were expressed as means ± SD. P < 0.05 was considered statistically significant.
Results
Benzene exposure caused hematotoxicity
Our previous studies shown that mice exposed to 150-mg/kg benzene had significant hematopoietic damage compared with control mice [16]. The results have reported that levels of white blood cell were decreased remarkably in 150-mg/kg benzene exposed group. In addition, red blood cell level and hemoglobin levels were altered significantly. Furthermore, benzene exposure also decreased the percentage and the colony forming capability of hematopoietic stem cells (HSCs) [17, 18].
Comparative analysis between the control and benzene groups
Base peak chromatograms (BPC) of mouse BM cells in control and benzene group on positive and negative modes are shown in Fig. 1. The PCA and OPLS-DA analyses were established to reveal the difference between control and benzene group using multivariate statistical analysis. As shown in Fig. 2, OPLS-DA score plot revealed more clear discrimination between two groups than PCA plot, with a R2Y value of 0.993 and a Q2 of 0.825, respectively. The results indicated that we could acquire more reliable metabolites information resulted in significant differences between the two sets of samples after effective elimination of the noise and uncorrelated variation. To test the validity of the OPLS-DA model, we performed permutation test with 200 random permutations in OPLS-DA model. The extrapolated intercept value (Q2inter) was −0.145 (negative), demonstrating that the statistical model was validated and no over-fitting was observed.
Figure 1.
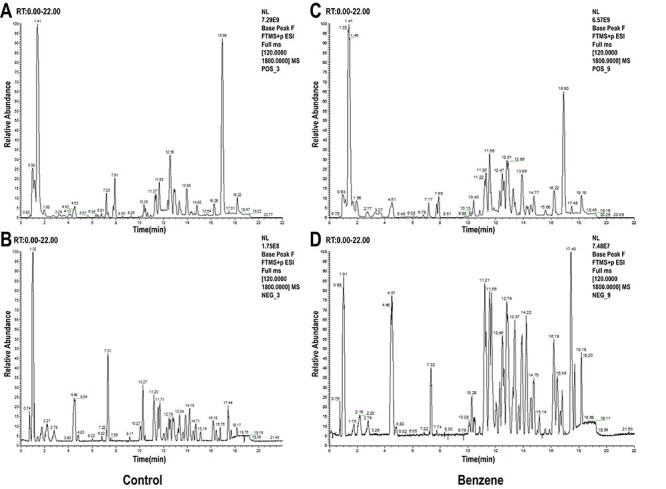
typical BPC of mouse BM cells in control and benzene group on positive (A and B) and negative mode (C and D); (A, C) control group; (B, D) benzene group.
Figure 2.
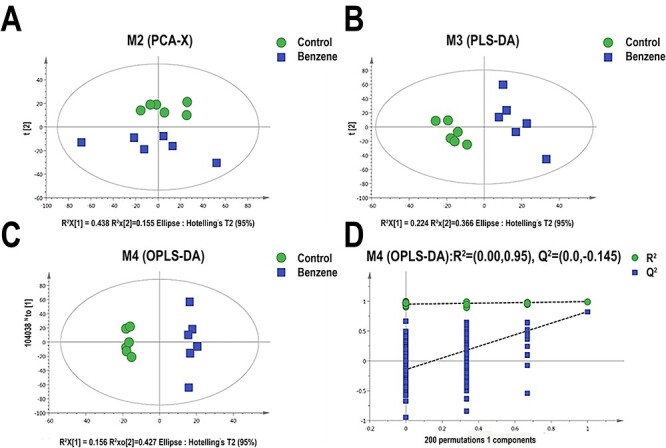
models derived from LC–MS dataset of BM cells from control and benzene group; (A) score plots of the PCA models; (B) supervised exclusion least squares discriminant analysis (PLS-DA); (C) orthogonal partial least squares-discriminant analysis (OPLS-DA); (D) permutation test (n = 200) validation plots of the OPLS-DA models; each point in the figure represents a single sample; green dots represent mice in control group; blue boxes represent samples in benzene exposure group.
Screening of differential lipid metabolites
Herein, based on the OPLS-DA analysis, 294 lipids with VIP ≥ 1 were selected and further confirmed by a student’s t test (P < 0.05). These lipids include five categories, namely 128 fatty Acyls, 133 Glycerophospholipids, 16 Glycerolipids, 16 Sphingolipids and 1 Sterol Lipids. Glycerophospholipids contributes the most to it, including PC, Phosphatidic acid (PA), phosphatidylethanolamine (PE), phosphatidylinositol (PI), phosphatidyl glycerol (PG) and phosphatidylserine (PS). The percentage distribution of the four main lipid types was shown in Fig. 3. Furthermore, top 50 significantly changed metabolites were identified as shown in Table 2 with their retention time (RT, min), ion mode, metabolite, molecular formula, VIP value, P-value and related trends. The result showed that 30 lipid metabolites were significantly up-regulated in benzene-exposed mice, while 20 lipid metabolites were down-regulated. Additionally, the clustering heat map also observed distinct segregation between benzene-treated group and control group (Fig. 4).
Figure 3.
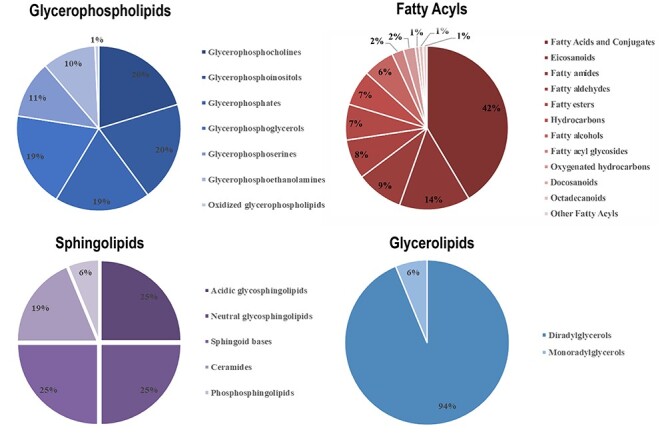
the proportional contribution of subclass lipids in four categories; lipidomic profiling revealed 294 differential lipids distinguishing benzene-treated mice from control mice; these lipids were distributed in four main lipid types, namely fatty acyls, glycerophospholipids, glycerolipids and sphingolipids.
Table 2.
top 50 identified differential lipids based on VIP & P-value
| NO. | m/z | RT1 (min) | Ion mode | Metabolites | Formula | VIP2 | P-value | Trend (B/C) |
|---|---|---|---|---|---|---|---|---|
| 1 | 245.1741 | 1.52 | pos | 2-methyl-dodecanedioic acid | C13H24O4 | 2.26 | 5.72E−05 | down |
| 2 | 169.9855 | 0.76 | pos | Iminoaspartic acid | C4H5NO4 | 2.41 | 1.83E−06 | down |
| 3 | 134.1174 | 0.76 | pos | 4-hydroxy caproaldehyde | C6H12O2 | 2.33 | 2.11E−05 | down |
| 4 | 14.0680 | 0.78 | pos | 2S-amino-pentanoic acid | C5H11NO2 | 2.42 | 1.45E−06 | down |
| 5 | 162.1485 | 0.76 | pos | Butan-2-one | C4H8O | 2.37 | 8.36E−06 | down |
| 6 | 232.1539 | 0.76 | pos | O-butanoyl-carnitine | C11H21NO4 | 2.46 | 4.40E−08 | down |
| 7 | 132.1018 | 0.80 | pos | 2S-amino-hexanoic acid | C6H13NO2 | 2.31 | 3.33E−05 | down |
| 8 | 16.1329 | 0.76 | pos | cis-epsilon-octenoic acid | C8H14O2 | 2.35 | 1.59E−05 | down |
| 9 | 209.1505 | 0.76 | pos | Undecylic acid | C11H22O2 | 2.44 | 8.75E−08 | down |
| 10 | 859.6047 | 7.53 | pos | PI(O-16:0/22:2(13Z,16Z)) | C47H89O12P | 2.41 | 6.55E−07 | down |
| 11 | 918.6436 | 8.30 | pos | PI(O-18:0/22:4(7Z,10Z,13Z,16Z)) | C49H89O12P | 2.08 | 1.38E−03 | down |
| 12 | 873.5845 | 12.66 | pos | PI(O-20:0/18:4(6Z,9Z,12Z,15Z)) | C47H85O12P | 2.00 | 2.19E−03 | down |
| 13 | 893.5489 | 11.12 | pos | PI(O-18:0/20:5(5Z,8Z,11Z,14Z,17Z)) | C47H83O12P | 2.13 | 6.27E−04 | down |
| 14 | 846.5420 | 11.42 | pos | PC(18:4(6Z,9Z,12Z,15Z)/20:1(11Z)) | C46H82NO8P | 2.01 | 1.41E−03 | down |
| 15 | 822.5021 | 7.43 | pos | PC(18:4(6Z,9Z,12Z,15Z)/20:5(5Z,8Z,11Z,14Z,17Z)) | C46H74NO8P | 2.05 | 1.43E−03 | down |
| 16 | 340.3932 | 6.22 | pos | 5Z-Tricosene | C23H46 | 2.02 | 1.92E−03 | down |
| 17 | 767.4092 | 6.73 | pos | Ustilagic acid | C36H64O18 | 2.01 | 1.28E−03 | down |
| 18 | 457.2575 | 1.61 | pos | PG(14:0/0:0) | C20H41O9P | 2.01 | 2.21E−03 | down |
| 19 | 368.4244 | 7.11 | pos | 5Z-Pentacosene | C25H50 | 2.03 | 1.78E−03 | down |
| 20 | 739.3790 | 6.32 | pos | 15-keto-PGE2 | C20H30O5 | 2.19 | 2.18E−04 | down |
| 21 | 692.5964 | 18.72 | pos | PE-NMe2(O-16:0/O-16:0) | C39H82NO6P | 2.50 | 3.21E−10 | up |
| 22 | 374.3773 | 11.14 | pos | 6-Ethyl-4-methyl-3E,5E,7E-decatriene | C13H22 | 2.18 | 2.47E−04 | up |
| 23 | 688.4326 | 10.63 | pos | PC(10:0/16:0) | C34H68NO8P | 2.01 | 1.61E−03 | up |
| 24 | 127.0387 | 1.01 | pos | (E)-hex-2-enedioic acid | C6H8O4 | 2.17 | 4.37E−04 | up |
| 25 | 135.0800 | 1.15 | pos | 2,6Z-Nonadien-4-olide | C9H12O2 | 2.17 | 3.13E−04 | up |
| 26 | 219.1740 | 7.60 | pos | 6,8,10,12-pentadecatetraenal | C15H22O | 2.11 | 5.01E−04 | up |
| 27 | 387.1794 | 10.65 | pos | 10-oxo-5,8-decadienoic acid | C10H14O3 | 2.02 | 1.79E−03 | up |
| 28 | 468.5135 | 14.07 | pos | 3S,11S-Dimethylnonacosan-2-one | C31H62O | 2.06 | 1.20E−03 | up |
| 29 | 454.2915 | 6.79 | pos | PA(18:1(9Z)/0:0) | C21H41O7P | 2.36 | 6.34E−06 | up |
| 30 | 319.2260 | 1.14 | pos | 9-hydroxy-2Z,5E,7Z,11Z,14Z-Eicosapentaenoic acid | C20H30O3 | 2.06 | 1.38E−03 | up |
| 31 | 351.1584 | 1.75 | pos | PA(6:0/6:0) | C15H29O8P | 2.01 | 2.16E−03 | up |
| 32 | 414.2972 | 5.83 | pos | N,N-(2,2-dihydroxy-ethyl) arachidonoyl amine | C24H41NO3 | 2.38 | 4.11E−06 | up |
| 33 | 397.2002 | 1.75 | pos | 8-oxo-Resolvin D1 | C22H30O5 | 2.02 | 1.66E−03 | up |
| 34 | 291.2286 | 0.76 | pos | 2R-aminoheptanoic acid | C7H15NO2 | 2.28 | 3.03E−05 | up |
| 35 | 675.5888 | 18.55 | pos | DG(20:0/18:0) | C41H80O5 | 2.26 | 9.95E−05 | up |
| 36 | 34.2813 | 1.38 | pos | Phytosphingosine | C18H39NO3 | 2.05 | 1.35E−03 | up |
| 37 | 633.5421 | 17.63 | pos | DG(15:0/20:0/0:0)[iso2] | C38H74O5 | 2.10 | 1.05E−03 | up |
| 38 | 356.3516 | 6.13 | pos | Eicosanoyl-EA | C22H45NO2 | 2.02 | 2.97E−03 | up |
| 39 | 785.5034 | 9.51 | pos | 3-O-(2-O-(2E-decenoyl)-alpha-L-rhamnopyranosyl-(1–2)-alpha-L-rhamnopyranosyl)-3-hydroxydecanoic acid | C42H74O14 | 2.23 | 3.47E−04 | up |
| 40 | 470.4200 | 9.05 | pos | 5-methyl-2E-tridecenoic acid | C14H26O2 | 2.19 | 4.05E−04 | up |
| 41 | 646.4801 | 9.12 | pos | PE(P-16:0/14:1(9Z)) | C35H68NO7P | 2.08 | 1.56E−03 | up |
| 42 | 768.4758 | 8.84 | pos | PS(16:0/17:2(9Z,12Z)) | C39H72NO10P | 2.13 | 8.09E−04 | up |
| 43 | 532.3366 | 4.04 | pos | PC(O-1:0/16:0) | C25H52NO7P | 2.13 | 6.32E−04 | up |
| 44 | 757.6472 | 18.19 | pos | PA(O-20:0/22:0) | C45H91O7P | 2.22 | 3.61E−04 | up |
| 45 | 699.5943 | 9.00 | pos | DG(20:5(5Z,8Z,11Z,14Z,17Z)/22:0/0:0)[iso2] | C45H78O5 | 2.21 | 2.76E−04 | up |
| 46 | 431.2160 | 0.94 | pos | PA(16:1(9Z)/0:0) | C19H37O7P | 2.15 | 6.70E−04 | up |
| 47 | 646.4803 | 8.58 | pos | PC(17:0/10:0) | C35H70NO8P | 2.16 | 7.60E−04 | up |
| 48 | 630.4515 | 8.07 | pos | PC(12:0/14:1(9Z)) | C34H66NO8P | 2.13 | 8.44E−04 | up |
| 49 | 566.4753 | 7.53 | pos | DG(13:0/18:3(9Z,12Z,15Z)/0:0)[iso2] | C34H60O5 | 2.13 | 1.03E−03 | up |
| 50 | 494.3236 | 2.24 | pos | PC(16:1(9E)/0:0) | C24H48NO7P | 2.28 | 7.82E−05 | up |
RT1: retention time;
VIP2: the variable importance of the projection.
Figure 4.
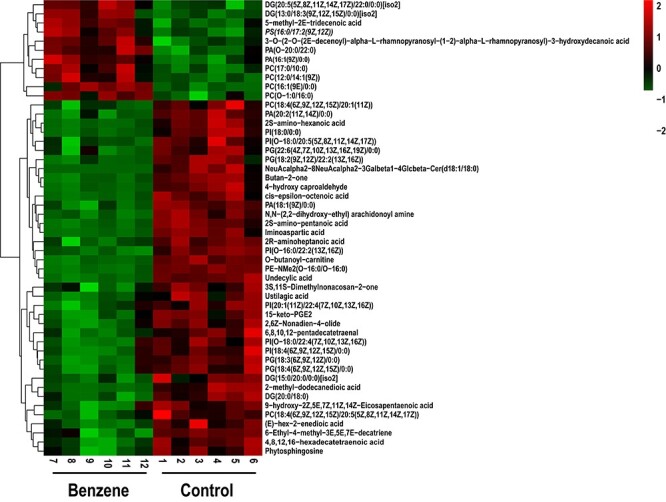
hierarchical clustering heat map of the top 50 differential lipid; each column represents an individual sample from benzene-exposed group (7–12) and control group (1–6); each row represents a kind of lipid; the degree of change is marked by different colors, and red represents the up-regulation, green represents the down-regulation
Metabolic pathway analysis
Metabolic pathway enrichment analysis in mice with benzene exposure was identified by MetaboAnalyst 5.0 (http://www.metaboanalyst.ca) software. The 294 metabolites with obvious changes were imported to MetPA for the metabolic pathway analysis. As shown in Fig. 5A, the results were presented with form of interactive visualization system. A total of 15 metabolic pathways were affected by benzene exposure and the detailed results of top five pathways analysis were shown in Table 3. TheP -value threshold calculated from pathway topology analysis was set to 0.05. Two cardinal metabolic pathways were discovered, namely glycerophospholipid metabolism and sphingolipids metabolism with P-value at 0.00, 0.04, respectively. Metabolic network was constructed shown in Fig. 5B and C.
Figure 5.
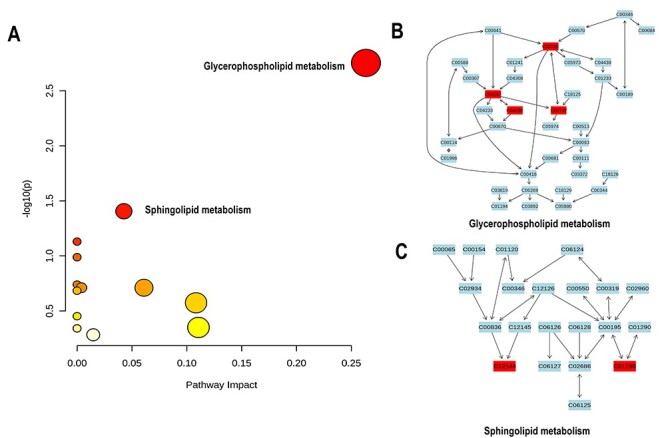
metabolic pathway enrichment map; (A) summary of pathway analysis using MetPA; results from pathway analysis are presented in Table 3. Axis x represented pathway impact score (the larger the circle the higher the impact score), axis y showed the P-value (yellow: higher P-value and red: lower P-value), respectively; (B and C) detailed construction of the glycerophospholipid metabolism and sphingolipids metabolism; labels within small boxes correspond to KEGG identifiers for metabolites; (C00350 – PE; C00157 –PC; C04230 – 1-Acyl-sn-glycero-3-phosphocholine; C02737 – PS; C12144 – Phytosphingosine (PHS); C01190 – Glucosylceramide (GlcCer)).
Table 3.
result from pathway analysis
| NO | Pathway name | Total compounds1 | Hits2 | Raw(P)3 | Log(P)4 | Holm(P)5 | FDR p6 | Impact7 |
|---|---|---|---|---|---|---|---|---|
| 1 | Glycerophospholipid metabolism | 36 | 4 | 0.00 | 2.75 | 0.14 | 0.14 | 0.26 |
| 2 | Sphingolipid metabolism | 21 | 2 | 0.04 | 1.40 | 1.0 | 1.0 | 0.04 |
| 3 | Linoleic acid metabolism | 5 | 1 | 0.07 | 1.12 | 1.0 | 1.0 | 0.00 |
| 4 | AA metabolism | 36 | 2 | 0.10 | 0.98 | 1.0 | 1.0 | 0.00 |
| 5 | Biosynthesis of unsaturated fatty acids | 36 | 2 | 0.10 | 0.98 | 1.0 | 1.0 | 0.00 |
Tota1: the total number of compounds in the pathway;
Hits2: the actually matched number from the user uploaded data;
Raw (p)3: the original p value calculated from the enrichment analysis;
Holm (p)4: the p value adjusted by Holm-Bonferroni method;
FDR p5: the p value adjusted using False Discovery Rate;
Impact6: the pathway impact value calculated from pathway topology analysis.
The glycerophospholipid pathway may involve in benzene-induced blood toxicity via influencing autophagy
Among them, glycerophospholipid metabolism was the pathway with the most significant enrichment level (−log (P) = 2.75, Raw P = 0.00). The alterations of significantly changed lipid metabolites in glycerophospholipid metabolism and their corresponding regulation genes were shown in Fig. 6A. As shown in Fig. 6B, PC and PS were down-regulated in benzene exposure group. PE and 1-Acyl-sn-glycero-3-phosphocholine were significantly increased compare with control group (P < 0.05). We then detected the expression of key enzymes of glycerophospholipid metabolism (Fig. 6C). PS decarboxylase (pisd) enzyme converts PS to PE in the inner mitochondrial membrane. Cholesterol acyltransferase (Lcat) transfer an acyl group from lecithin to cholesterol. In mammals, PtdSer synthase enzymes, ptdss1 and ptdss2, utilize PC and PE as substrates to synthesize PS, respectively. We found that mRNA levels of pisd, ptdss1 and ptdss2 showed a significant decline, while Lcat was presented higher level in benzene-treated group. Because PE has been reported to play a key role in autophagosome biogenesis [19]. We then also explored whether the changes in PE were coupled with alterations in autophagy. The results showed that Beclin1 and LC3B, two autophagy-related genes, were elevated in benzene-exposed mice (Fig. 6D) (P < 0.05). Hence, the glycerophospholipid pathway may involve in benzene-induced hematopoietic toxicity by partially increasing cell autophagy.
Figure 6.
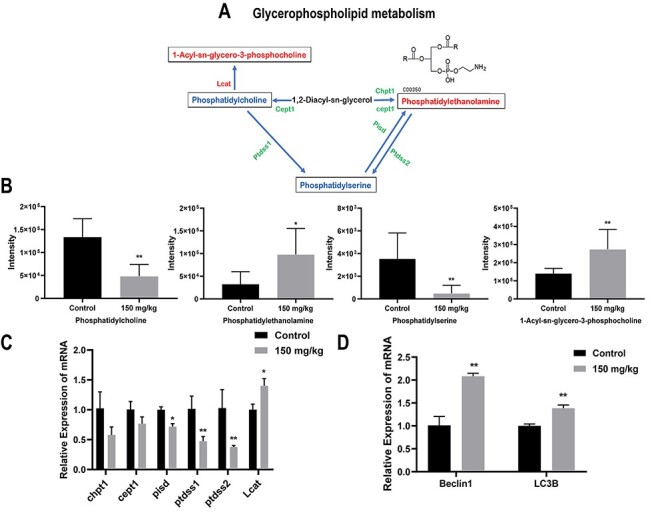
the glycerophospholipid pathway may involve in benzene-induced blood toxicity via influencing autophagy; metabolic pathways of glycerophospholipid metabolism (A); the red and blue words represent the relatively increased or decreased levels of the lipids in solid line box, respectively, and the red and green words on both sides of the solid arrow indicate the up- and down-regulation of the gene expression of the key enzymes; (B) the relative intensity of lipid which were matched in glycerophospholipid metabolism, namely PC, PS, PE and 1-Acyl-sn-glycero-3-phosphocholine, respectively; (C) the expression of each enzyme which may affect lipid levels, including Chpt1, Cept1, PS decarboxylase (Pisd), PtdSer synthase enzymes (Ptdsss1and Ptdss2) and Cholesterol acyltransferase (Lcat); (D) the relative mRNA expression of autophagy marker (Beclin1 and LC3B); *: P < 0.05; **: P < 0.01; ***: P < 0.001 compared with control group
Sphingolipid pathway may participate in benzene-induced blood toxicity by regulating cell proliferation and apoptosis
Sphingolipids metabolism was also a vital pathway associated with metabolic changes in benzene-exposed mice (−log (P) = 1.40, Raw P = 0.04). Figure 7A displayed the regulation relationship between the significantly altered sphingolipids metabolites and key genes caused by benzene exposure. Two lipids in sphingolipids metabolism, glucosylceramide (GlcCer) and phytosphingosine (PHS), were clearly lower in benzene-exposed group (Fig. 7B) (P < 0.05). We then detect the expression level of key genes in sphingolipids metabolism. UDP-glucose ceramide glucosyltransferase (UGCG) encodes a key regulatory enzyme which regulates GlcCer. Delta 4-desaturase, sphingolipid 1 (Degs1) is an ER-membrane-spanning protein, which converts dihydroceramide (dhCer) to Cer. Compared with control group, UGCG and Degs1 gene displayed a considerable elevation in benzene-treated group (Fig. 7C) (P < 0.05). Studies have shown that two cellular processes, apoptosis and proliferation, could be regulated by sphingolipids [20]. Thus, we then investigated whether benzene exposure impact apoptosis and proliferation in mouse BM cells. The results showed that proliferating cell nuclear antigen (PCNA) and Ki67, two proliferation markers, were significantly elevated in benzene group compared with control. After treatment with benzene, Bax, and Caspase-3 genes, which are core regulators of the intrinsic pathway of apoptosis, were markedly higher, and Bcl-2 showed a significant decline than that of control (Fig. 7D) (P < 0.05). Thus, dysregulation in sphingolipids may play a role in abnormal proliferation and apoptosis induced by benzene.
Figure 7.
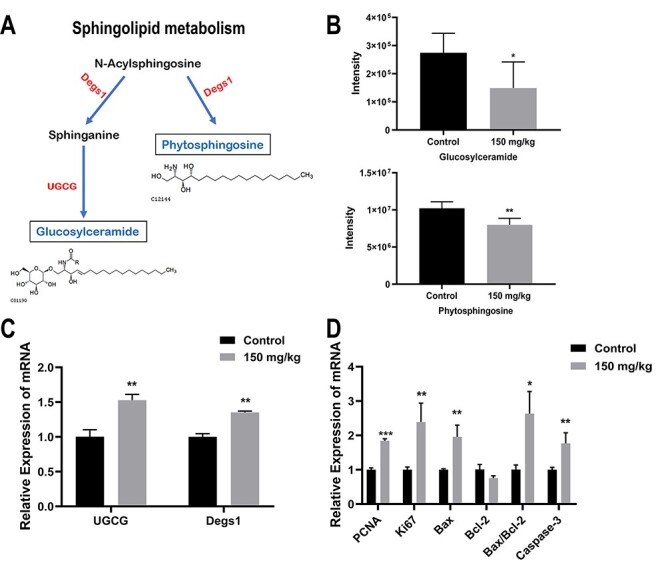
sphingolipid pathway may participate in benzene-induced blood toxicity by regulating cell proliferation and apoptosis; metabolic pathways of Sphingolipids metabolism (A); lipids in solid line box coloured with blue represent the down-regulation of the expression of the metabolites; gene on both sides of the solid arrow were coloured with red represent up-regulation of the expression of enzymes (B); the relative intensity of lipid which were selected in sphingolipids metabolism, including GlcCer and PHS; (C) UGCG and Delta 4-desaturase, sphingolipid 1(Degs1) gene expression in mouse BM cells; (D) the relative mRNA expression of proliferation (Ki67 and PCNA) and apoptosis-related genes (Bax, Bcl-2 and caspase-3); *: P < 0.05; **: P < 0.01; ***: P < 0.001 compared with control group
Discussion
Benzene can cause serious damage to the human hematopoietic system, resulting in varying degrees of pancytopenia, aplastic anemia and leukemia. In the previous study, we reported that benzene exposure cause hematotoxity which was confirmed by damaging to HSCs and decreasing blood cells counts [18]. Given the complex roles of lipids in cellular physiology, it is clear that deregulated lipids may contribute to disease. Simultaneously, lipidomics is an emerging technique for comprehensively analyzing the end products of lipid metabolism and revealing internal changes within whole organisms. BM is the target organ for benzene, and BM cells are often used as samples to analyze the hematopoietic toxicity caused by benzene. Therefore, in this study, BM cells from benzene-exposed and control mice were collected for lipid metabolism analysis. Based on the LC–MS/MS technology, the data were obtained and then lipid metabolites were screened through OPLS-DA model and comprehensive multivariate analysis. At the same time, their biological functions and related pathways were identified through MetPA.
After benzene exposure, a total of 294 metabolites were identified. Interestingly, glycerophospholipid metabolism and sphingolipid metabolism emerged as crucial pathways that were deregulate in benzene-exposed mice. Glycerophospholipids are major structural components of biological membranes and act as messengers to participate in signaling regulation. Importantly, researchers have found glycerophospholipid metabolism emerged as a crucial role that was deregulated in the disease progression by comparing the serum of ALL patients and controls [21]. In our study, we found that PE were significantly increased in benzene-treated mouse BM cells, while PC and PS declined significantly. The decreasing of multiple PSs level has observed in malignant lung tissue of non-small cell lung cancer patients [22]. Simultaneously, PS was one of the prominent cancer cell biomarkers. Over expression of PS on cancer cells surface enables them to become biomarker in some species cancer, including pancreatic cancer and lung cancer [23, 24]. Cui et al. [25] reported that apoptosis was induced by a reduction of PC synthesis in CHO-MT58 cells. Ptdss1 and ptdss2 were the key enzyme that regulate PS through PE and PC as substrates. According to our data, the decline of ptdss1 and ptdss2 levels may be related with the promotion of apoptosis in mouse BM cells after benzene treatment.
Of note, PE has also shown to directly involved in autophagy [26]. LC3-I on the phagophore membrane is conjugated to PE to form LC3-II, which is required for the formation of autophagosomes and selective recruitment of substrates. Both in yeast and in mammalian cell culture, artificial increased intracellular PE level could significantly enhance autophagy level [27, 28]. Increasing evidence demonstrates that deregulated autophagy may be the underlying mechanism by which benzene causes hematotoxicity [29]. In this study, after exposure to 150 mg/kg of benzene for 30 days, two important autophagy genes, namely Beclin l and LC3B, were increased in mouse BM cells. Meanwhile, over-expression of Lcat may increase the conversion of PC to 1-Acyl-sn-glycero-3-phosphocholine. Pisd can promote the PE synthesis process on mitochondrial membranes [30]. However, the decreased pisd expression and increased PE level were observed in our study, indicating that there are other metabolic pathways participating in PE synthesis. These results suggest that glycerophospholipid metabolism may be involved in the process of benzene-induced hematopoietic toxicity through regulating autophagy.
Sphingolipids are one of the three major classes of membrane lipids in eukaryotic cells. As important cell signal transduction molecules, sphingolipids metabolites have emerged as key regulators in processes such as cell growth, differentiation, senescence and death. Xie et al. [31] have reported that sphingolipid metabolism activated proteostasis programs to govern human HSCs self-renewal. There is sufficient evidence that benzene and its metabolite may act via modulation the self-renewal and differentiation of hematopoietic stem progenitor cells (HSPCs) [32, 33]. Thus, sphingolipid pathway may play an essential role via regulation fuctions of HSPCs in the study of benzene-induced hematopoietic toxicity.
After analyzing the results, GlcCer and PHS in sphingolipid metabolism were significantly decreased in BM cells of mice exposed to benzene in this research. GlcCer is an important glycosphingolipid metabolic intermediate, which serves as the starting point in the biosynthesis of a wide variety of sphingolipids. UGCG is a key enzyme in the sphingolipid metabolism by generating GlcCer, which is the precursor for all complex sphingolipids. Our research showed that the level of GlcCer was obviously declined after treatment with benzene, but UGCG expression level was increased. Chen et al. have reported that total GlcCer concentration was significantly lower in MCF-7/UGCG over expression cells. These researchers further indicated that the remaining GlcCer were integrated in the cell membrane [34]. UGCG is related to pro-cancerous processes such as increased proliferation. Researcher data have showed that an increased UGCG mRNA expression can promote MCF-7 cells proliferation [35]. The expression of UGCG mRNA and proliferation markers (Ki67 and PCNA) showed an increasing trend with benzene treatment. More experimental studies are needed to verify these assumptions in our study. In addition, the lack of GlcCer may increase the apoptosis of liver cells in vitro by Bcl-2/Bax pathway [36]. Both in vivo and in vitro toxicology tests have shown that apoptosis was involved in benzene-induced hematotoxicity by targeting Bax/Bcl-2 and Caspase-3 expression [37, 38]. Our results clearly confirmed that benzene promoted BM cell apoptosis via the upregulation of Caspase-3 expression and Bax/Bcl-2 ratio. Based on this result, GlcCer may involve in benzene-induced hematotoxicity via activation of Bax/Bcl-2-mediated apoptosis and promoting proliferation.
Of the structural analogs of sphingolipids, PHS is well-known to be involved in many significant cellular responses including apoptosis, differentiation and migration. Han et al. [39] have reported that PHS induced several hallmark changes associated with megakaryopoiesis from K562 and HEL cells including cell cycle arrest, cell size increase and polyploidization. The results of scholars have indicated that PHS perturbed mitochondrial functions to induce apoptosis [40]. Our previous study indicated that benzene and benzene metabolites have caused mitochondrial damage, G1 phase accumulation and increases in apoptosis [41–43]. Degs1, as a sphingolipid enzyme, is essential for HSCs function [31]. Studies have shown that damage to HSCs played a prominent role in the benzene-induced toxic effect not only in literatures but also in our previous studies [18, 44, 45]. Our data revealed that PHS level was downregulated in BM cells of benzene-exposed mice and accompanied by Degs1 gene changes, suggesting that PHS may participate in benzene-induced hematotoxicity through regulating HSCs self-renewal. Yet, the specific mechanism of PHS in benzene-induced blood toxicity still needs further research.
Conclusion
Taken together, we firstly used BM cell lipidomics to provide new clues for the further study of the mechanism of benzene-induced blood toxicity. However, there are limitations in our study. Firstly, the differential lipids selected by OPLS-DA model are required to be explored at environmental relevant benzene exposure doses. In addition, key potential metabolic biomarkers need to be further validated in occupational population exposed to benzene. As summarized, the present findings do provide the basis for further exploring the mechanism of benzene-induced hematotoxicity.
Acknowledgements
This research was supported by the National Natural Science Foundation of China (81730087, 81703265) and the Fundamental Research Funds for the Central Universities (2242018 K40019, 2242018K3DN25, 2242019R40050).
Contributor Information
Linling Yu, Key Laboratory of Environmental Medicine Engineering, Ministry of Education, School of Public Health, Southeast University, Nanjing 210009, Jiangsu, China.
Rongli Sun, Key Laboratory of Environmental Medicine Engineering, Ministry of Education, School of Public Health, Southeast University, Nanjing 210009, Jiangsu, China.
Kai Xu, Key Laboratory of Environmental Medicine Engineering, Ministry of Education, School of Public Health, Southeast University, Nanjing 210009, Jiangsu, China.
Yunqiu Pu, Key Laboratory of Environmental Medicine Engineering, Ministry of Education, School of Public Health, Southeast University, Nanjing 210009, Jiangsu, China.
Jiawei Huang, Key Laboratory of Environmental Medicine Engineering, Ministry of Education, School of Public Health, Southeast University, Nanjing 210009, Jiangsu, China.
Manman Liu, Key Laboratory of Environmental Medicine Engineering, Ministry of Education, School of Public Health, Southeast University, Nanjing 210009, Jiangsu, China.
Minjian Chen, State Key Laboratory of Reproductive Medicine, Institute of Toxicology, Nanjing Medical University, Nanjing 211166, China; Key Laboratory of Modern Toxicology of Ministry of Education, School of Public Health, Nanjing Medical University, Nanjing 211166, China.
Juan Zhang, Key Laboratory of Environmental Medicine Engineering, Ministry of Education, School of Public Health, Southeast University, Nanjing 210009, Jiangsu, China.
Lihong Yin, Key Laboratory of Environmental Medicine Engineering, Ministry of Education, School of Public Health, Southeast University, Nanjing 210009, Jiangsu, China.
Yuepu Pu, Key Laboratory of Environmental Medicine Engineering, Ministry of Education, School of Public Health, Southeast University, Nanjing 210009, Jiangsu, China.
Conflict of Interest
All authors declare there are no conflicts of interest.
References
- 1.Liu H, Liang Y, Bowes S et al. Benzene exposure in industries using or manufacturing paint in China–a literature review, 1956–2005. J Occup Environ Hyg 2009;6:659–70. [DOI] [PubMed] [Google Scholar]
- 2.Correa MJ, Santana VS. Occupational exposure to benzene in Brazil: estimates based on an occupational exposure matrix. Cad Saude Publica 2016;32:e00129415. [DOI] [PubMed] [Google Scholar]
- 3.Bayatian M, Ashrafi K, Azari MR et al. Risk assessment of occupational exposure to benzene using numerical simulation in a complex geometry of a reforming unit of petroleum refinery. Environ Sci Pollut Res Int 2018;25:11364–75. [DOI] [PubMed] [Google Scholar]
- 4.Liang B, Zhong Y, Chen K et al. Serum plasminogen as a potential biomarker for the effects of low-dose benzene exposure. Toxicology 2018;410:59–64. [DOI] [PubMed] [Google Scholar]
- 5.Li P, Wu Y, Zhang Z et al. Proteomics analysis identified serum biomarkers for occupational benzene exposure and chronic benzene poisoning. Medicine (Baltimore) 2019;98:e16117. [DOI] [PMC free article] [PubMed] [Google Scholar]
- 6.Sulciner ML, Gartung A, Gilligan MM et al. Targeting lipid mediators in cancer biology. Cancer Metastasis Rev 2018;37:557–72. [DOI] [PubMed] [Google Scholar]
- 7.Kouba S, Ouldamer L, Garcia C et al. Lipid metabolism and Calcium signaling in epithelial ovarian cancer. Cell Calcium 2019;81:38–50. [DOI] [PubMed] [Google Scholar]
- 8.Jiang N, Zhang G, Pan L et al. Potential plasma lipid biomarkers in early-stage breast cancer. Biotechnol Lett 2017;39:1657–66. [DOI] [PubMed] [Google Scholar]
- 9.Pabst T, Kortz L, Fiedler GM et al. The plasma lipidome in acute myeloid leukemia at diagnosis in relation to clinical disease features. BBA Clin 2017;7:105–14. [DOI] [PMC free article] [PubMed] [Google Scholar]
- 10.Usman H, Rashid R, Ameer F et al. Revisiting the dyslipidemia associated with acute leukemia. Clin Chim Acta 2015;444:43–9. [DOI] [PubMed] [Google Scholar]
- 11.Svegliati-Baroni G, Pierantonelli I, Torquato P et al. Lipidomic biomarkers and mechanisms of lipotoxicity in non-alcoholic fatty liver disease. Free Radic Biol Med 2019;144:293–309. [DOI] [PubMed] [Google Scholar]
- 12.Afshinnia F, Rajendiran TM, Wernisch S et al. Lipidomics and biomarker discovery in kidney disease. Semin Nephrol 2018;38:127–41. [DOI] [PMC free article] [PubMed] [Google Scholar]
- 13.Kimura T, Jennings W, Epand RM. Roles of specific lipid species in the cell and their molecular mechanism. Prog Lipid Res 2016;62:75–92. [DOI] [PubMed] [Google Scholar]
- 14.Yang F, Liu M, Qin N et al. Lipidomics coupled with pathway analysis characterizes serum metabolic changes in response to potassium oxonate induced hyperuricemic rats. Lipids Health Dis 2019;18:112. [DOI] [PMC free article] [PubMed] [Google Scholar]
- 15.Wu X, Zhu JC, Zhang Y et al. Lipidomics study of plasma phospholipid metabolism in early type 2 diabetes rats with ancient prescription Huang-Qi-San intervention by UPLC/Q-TOF-MS and correlation coefficient. Chem Biol Interact 2016;256:71–84. [DOI] [PubMed] [Google Scholar]
- 16.Sun R, Xu K, Ji S et al. Benzene exposure induces gut microbiota dysbiosis and metabolic disorder in mice. Sci Total Environ 2020;705:135879. [DOI] [PubMed] [Google Scholar]
- 17.Sun R, Zhang J, Xiong M et al. Altered expression of genes in signaling pathways regulating proliferation of hematopoietic stem and progenitor cells in mice with subchronic benzene exposure. Int J Environ Res Public Health 2015;12:9298–313. [DOI] [PMC free article] [PubMed] [Google Scholar]
- 18.Sun R, Xu K, Ji S et al. Toxicity in hematopoietic stem cells from bone marrow and peripheral blood in mice after benzene exposure: Single-cell transcriptome sequencing analysis. Ecotoxicol Environ Saf 2021;207:111490. [DOI] [PubMed] [Google Scholar]
- 19.Yang A, Pantoom S, Wu YW. Distinct mechanisms for processing autophagy protein LC3-PE by RavZ and ATG4B. Chembiochem 2020;21:3377–82. [DOI] [PMC free article] [PubMed] [Google Scholar]
- 20.Patwardhan GA, Beverly LJ, Siskind LJ. Sphingolipids and mitochondrial apoptosis. J Bioenerg Biomembr 2016;48:153–68. [DOI] [PMC free article] [PubMed] [Google Scholar]
- 21.Bai Y, Zhang H, Sun X et al. Biomarker identification and pathway analysis by serum metabolomics of childhood acute lymphoblastic leukemia. Clin Chim Acta 2014;436:207–16. [DOI] [PubMed] [Google Scholar]
- 22.Marien E, Meister M, Muley T et al. Non-small cell lung cancer is characterized by dramatic changes in phospholipid profiles. Int J Cancer 2015;137:1539–48. [DOI] [PMC free article] [PubMed] [Google Scholar]
- 23.Chu Z, Abu-Baker S, Palascak MB et al. Targeting and cytotoxicity of SapC-DOPS nanovesicles in pancreatic cancer. PLoS One 2013;8:e75507. [DOI] [PMC free article] [PubMed] [Google Scholar]
- 24.Zhao S, Chu Z, Blanco VM et al. SapC-DOPS nanovesicles as targeted therapy for lung cancer. Mol Cancer Ther 2015;14:491–8. [DOI] [PMC free article] [PubMed] [Google Scholar]
- 25.Cui Z, Houweling M, Chen MH et al. A genetic defect in phosphatidylcholine biosynthesis triggers apoptosis in Chinese hamster ovary cells. J Biol Chem 1996;271:14668–71. [DOI] [PubMed] [Google Scholar]
- 26.Patel D, Witt SN. Ethanolamine and phosphatidylethanolamine: partners in health and disease. Oxid Med Cell Longev 2017;2017:4829180. [DOI] [PMC free article] [PubMed] [Google Scholar]
- 27.Rockenfeller P, Koska M, Pietrocola F et al. Phosphatidylethanolamine positively regulates autophagy and longevity. Cell Death Differ 2015;22:499–508. [DOI] [PMC free article] [PubMed] [Google Scholar]
- 28.Runwal G, Stamatakou E, Siddiqi FH et al. LC3-positive structures are prominent in autophagy-deficient cells. Sci Rep 2019;9:10147. [DOI] [PMC free article] [PubMed] [Google Scholar]
- 29.Qian S, Han Y, Shi Y et al. Benzene induces haematotoxicity by promoting deacetylation and autophagy. J Cell Mol Med 2019;23:1022–33. [DOI] [PMC free article] [PubMed] [Google Scholar]
- 30.Hanada T, Noda NN, Satomi Y et al. The Atg12-Atg5 conjugate has a novel E3-like activity for protein lipidation in autophagy. J Biol Chem 2007;282:37298–302. [DOI] [PubMed] [Google Scholar]
- 31.Xie SZ, Garcia-Prat L, Voisin V et al. Sphingolipid modulation activates proteostasis programs to govern human hematopoietic stem cell self-renewal. Cell Stem Cell 2019;25:639, e637–53. [DOI] [PMC free article] [PubMed] [Google Scholar]
- 32.Dewi R, Hamid ZA, Rajab NF et al. Genetic, epigenetic, and lineage-directed mechanisms in benzene-induced malignancies and hematotoxicity targeting hematopoietic stem cells niche. Hum Exp Toxicol 2020;39:577–95. [DOI] [PubMed] [Google Scholar]
- 33.Morgan GJ, Alvares CL. Benzene and the hemopoietic stem cell. Chem Biol Interact 2005;153–154:217–22. [DOI] [PubMed] [Google Scholar]
- 34.Wegner MS, Schomel N, Gruber L et al. UDP-glucose ceramide glucosyltransferase activates AKT, promoted proliferation, and doxorubicin resistance in breast cancer cells. Cell Mol Life Sci 2018;75:3393–410. [DOI] [PMC free article] [PubMed] [Google Scholar]
- 35.Ishibashi Y, Ito M, Hirabayashi Y. The sirtuin inhibitor cambinol reduces intracellular glucosylceramide with ceramide accumulation by inhibiting glucosylceramide synthase. Biosci Biotechnol Biochem 2020;84:2264–72. [DOI] [PubMed] [Google Scholar]
- 36.Li JF, Zheng SJ, Wang LL et al. Glucosylceramide synthase regulates the proliferation and apoptosis of liver cells in vitro by Bcl2/Bax pathway. Mol Med Rep 2017;16:7355–60. [DOI] [PMC free article] [PubMed] [Google Scholar]
- 37.Chen Y, Sun P, Guo X et al. MiR-34a, a promising novel biomarker for benzene toxicity, is involved in cell apoptosis triggered by 1,4-benzoquinone through targeting Bcl-2. Environ Pollut 2017;221:256–65. [DOI] [PubMed] [Google Scholar]
- 38.Chen Y, Zhang W, Guo X et al. The crosstalk between autophagy and apoptosis was mediated by phosphorylation of Bcl-2 and beclin1 in benzene-induced hematotoxicity. Cell Death Dis 2019;10:772. [DOI] [PMC free article] [PubMed] [Google Scholar]
- 39.Han SH, Kim J, Her Y et al. Phytosphingosine promotes megakaryocytic differentiation of myeloid leukemia cells. BMB Rep 2015;48:691–5. [DOI] [PMC free article] [PubMed] [Google Scholar]
- 40.Nagahara Y, Shinomiya T, Kuroda S et al. Phytosphingosine induced mitochondria-involved apoptosis. Cancer Sci 2005;96:83–92. [DOI] [PMC free article] [PubMed] [Google Scholar]
- 41.Sun R, Cao M, Zhang J et al. Benzene exposure alters expression of enzymes involved in fatty acid beta-oxidation in male C3H/He mice. Int J Environ Res Public Health 2016;13:1068. [DOI] [PMC free article] [PubMed] [Google Scholar]
- 42.Sun R, Meng X, Pu Y et al. Overexpression of HIF-1a could partially protect K562 cells from 1,4-benzoquinone induced toxicity by inhibiting ROS, apoptosis and enhancing glycolysis. Toxicol In Vitro 2019;55:18–23. [DOI] [PubMed] [Google Scholar]
- 43.Pu Y, Sun F, Sun R et al. PTP4A3, a novel target gene of HIF-1alpha, participates in benzene-induced cell proliferation inhibition and apoptosis through PI3K/AKT pathway. Int J Environ Res Public Health 2020;17:910. [DOI] [PMC free article] [PubMed] [Google Scholar]
- 44.Sun R, Zhang J, Wei H et al. Acetyl-l-carnitine partially prevents benzene-induced hematotoxicity and oxidative stress in C3H/He mice. Environ Toxicol Pharmacol 2017;51:108–13. [DOI] [PubMed] [Google Scholar]
- 45.Wei H, Zhang J, Tan K et al. Benzene-induced aberrant miRNA expression profile in hematopoietic progenitor cells in C57BL/6 mice. Int J Mol Sci 2015;16:27058–71. [DOI] [PMC free article] [PubMed] [Google Scholar]


