Abstract
Background
Vessel-wall enhancement (VWE) on black-blood MRI (BB MRI) has been proposed as an imaging marker for a higher risk of rupture and associated with wall inflammation. Whether VWE is causally linked to inflammation or rather induced by flow phenomena has been a subject of debate.
Purpose
To study the effects of slow flow, spatial resolution, and Motion-Sensitized Driven Equilibrium (MSDE) preparation on signal intensities in BB MRI of patient-specific aneurysm flow models.
Study Type
Prospective
Subjects/Flow Aneurysm Model/Virtual Vessels
Aneurysm flow models based on 3D rotational angiography datasets of three patients with intracranial aneurysms were 3D printed and perfused at two different flow rates, with and without Gd-containing contrast agent.
Field Strength/Sequence
Variable refocusing flip angle 3D fast-spin echo sequence at 3T with and without MSDE with three voxel sizes (0.5 mm3, 0.7 mm3, and 0.9 mm3); time-resolved with phase-contrast velocity-encoding 3D spoiled gradient echo sequence (4D flow MRI).
Assessment
Three independent observers performed a qualitative visual assessment of flow patterns and signal enhancement. Quantitative analysis included voxel-wise evaluation of signal intensities and magnitude velocity distributions in the aneurysm.
Statistical Tests
Kruskal-Wallis test, potential regressions.
Results
A hyperintense signal in the lumen and adjacent to the aneurysm walls on BB MRI was colocalized with slow flow. Signal intensities increased by a factor of 2.56 ± 0.68 (p < 0.01) after administering Gd contrast. After Gd contrast administration, the signal was suppressed most in conjunction with high flows and with MSDE (2.41 ± 2.07 for slow flow without MSDE, and 0.87 ± 0.99 for high flow with MSDE). A clear result was not achieved by modifying the spatial resolution.
Data Conclusions
Slow-flow phenomena contribute substantially to aneurysm enhancement and vary with MRI parameters. This should be considered in the clinical setting when assessing VWE in patients with an unruptured aneurysm.
Keywords: aneurysm, vessel-wall enhancement, slow flow, flow suppression
INTRODUCTION
Intracranial aneurysms have been considered a relatively common pathological condition with a prevalence in the adult population without comorbidities of about 3.2% (1). If such an aneurysm ruptures, a potentially life-threatening intracranial hemorrhage develops (2). Inflammatory changes in the aneurysm wall have been considered to play an essential role in the formation, growth, and rupture of aneurysms (3–9). The dominant role of macrophage-related inflammatory processes in the aneurysm wall was demonstrated by various studies, as reviewed by Shimizu et al. (9). Enhancement of the aneurysm wall after administering gadolinium (Gd)-containing contrast agents has been associated with macrophage infiltration, neovascularization, vasa vasorum, atherosclerotic changes, and wall-adherent thrombus (10–14). Moreover, wall enhancement has been proposed as a possible imaging marker of a higher risk of aneurysm rupture and could therefore aid in stratifying the risk of patients in whom an aneurysm is detected incidentally (15–19). Specific hemodynamic conditions, including low wall shear stress (WSS) and low oscillatory shear index (OSI) in the aneurysm, have been associated with a higher risk of rupture (20). They have been shown to colocalize with contrast-enhanced wall segments on BB MRI (18).
It has been hypothesized that slow-flowing blood impairs the flow suppression in conventional BB MRI sequences and thus contributes to vessel-wall enhancement (VWE), leading to so-called “pseudo-enhancement” (21–23). Therefore, both accumulation of contrast agent in the vessel wall and slow flow may contribute to wall or wall-adjacent hyperintensities.
The impact of low flow velocities on BB-signal enhancement can be studied separately from an assumed inflammation-mediated accumulation of Gd contrast agent in the wall by using nonpermeable models of human vasculature (22). Furthermore, in vitro experiments facilitate the systematic optimization of sequence parameters because parameters such as flow and contrast agent concentration are well controlled and stable. A previous study investigated the influence of heart rate and additional preparation pulses on BB MRI signal in an aneurysm model. Those authors found that VWE increased with lower heart rates and decreased with the use of a preparation module (22).
The present study aimed to assess the contribution of slow flow to pseudo-enhancement in BB MRI of different aneurysm geometries. Moreover, the impact of the voxel size and MSDE preparation pulses on slow flow-related enhancement was investigated.
MATERIALS AND METHODS
This study was approved by the Institutional Ethics Committee, and written informed consent was obtained from the patients.
Model Production
Patients with unruptured intracranial aneurysms were retrospectively identified from the institutional MR vessel-wall imaging database (Figure 1 a). The inclusion criteria comprised: 1) saccular aneurysm > 10 mm; 2) high-resolution 3D T1-weighted black-blood MRI showing extensive luminal and wall-adjacent signal enhancement; and 3) availability of 3D rotational angiography (3D-RA) datasets.
Figure 1.
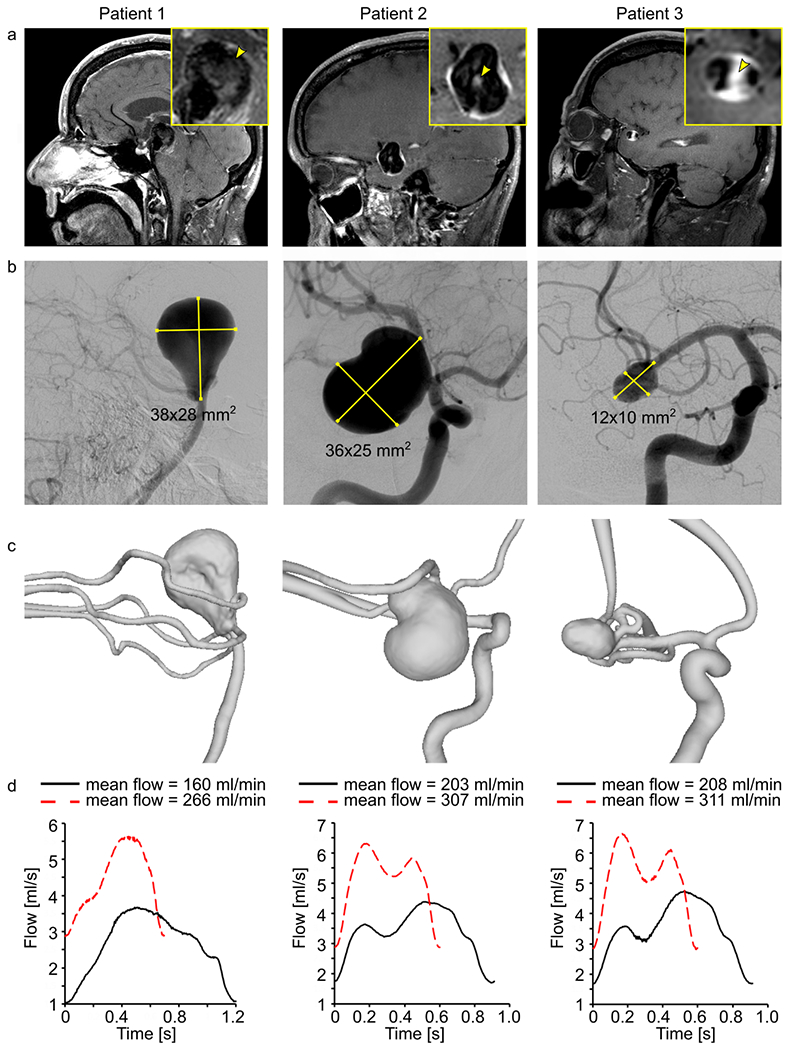
Black-blood MRI of patients 1-3 with intracranial aneurysm (yellow squares, inset) with wall-adjacent and luminal (yellow arrowhead) intra-aneurysmal signal enhancement after administering contrast agent (a), digital subtraction angiography (b), and surface rendering of segmented lumens (c) of intracranial arteries with aneurysms. Using these data, 3D-printed models were produced and supplied with the pulsatile flow at different velocities and cycles, measured with a sensor at the outlet (d).
The aneurysm size was determined according to 2D digital subtraction angiography data (Figure 1 b) during the recruitment process.
Three patients were included in the study:
Patient 1: 58 years, female, basilar tip aneurysm (38 x 28 mm2); Figure 1 b, left.
Patient 2: 57 years, female, carotid terminus aneurysm (36 x 25 mm2); Figure 1 b, middle
Patient 3: 65 years, male, middle cerebral artery bifurcation aneurysm (12 x 10 mm2); Figure 1 b, right.
Based on the corresponding in vivo 3D-RA (Allura XperFD 20/10, Philips, Best, The Netherlands, reconstructed with an isotropic voxel size of (0.27 mm)3) from patients 1-3, patient-specific aneurysm flow models (model 1-3, Figure 1 c) were constructed in-house by M.P. (a clinical research fellow with three years of experience in intracranial flow imaging), using 3D printing technology (Form 3, Formlabs, USA). The following steps were applied: 1) the vessel lumens were segmented from the 3D-RA dataset (threshold-based segmentation followed by marching cubes, MevisLab 3.0.1, MeVis Medical solution, Germany); 2) the resulting lumens were optimized for 3D printing by cutting all branches smaller than 1 mm in diameter (Meshmixer 3.5, Autodesk, USA); and 3) an outer layer was added to form a vessel wall, and flow connectors (Fusion 360 2.0, Autodesk, USA) were applied to integrate the models into a flow loop. The detailed protocol has been published elsewhere (24).
After printing, the models were submerged in an agarose gel with a 3% concentration of agar (Special ingredients Ltd, UK). The models are publicly available and can be downloaded at https://doi.org/10.5281/zenodo.4506612.
Experimental Setup For Flow Measurements
A glycerol-water mixture (40/60 % by volume) was pumped through the models using a centrifugal pump (Ismaltec MCP Standart, Cole Parmer, USA). The supplied flow rate was controlled with an inline transonic flow sensor (ME6PXN325, Transonic System Inc., USA) at the pump’s outlet. All experiments were carried out at room temperature (21 °C).
For each model, the flow rates were chosen according to the blood flow expected in vivo (25): model 1 was provided with 160 and 266 ml/min, and models 2 and 3 were fed with 203-307 ml/min and 208-311 ml/min, respectively (Figure 1 d). Due to the peristaltic nature of the pump, the simulated cardiac cycle depended on the flow rate that was generated, with a duration in the range of 600 – 1200 ms.
Flow and pressure were measured at the outlets of the models using a clamp-on transonic flow sensor (ME8PXL-M12, Transonic System Inc., USA) and a Luer-lock pressure sensor (PRESS-N-000, PendoTech, USA), respectively.
MR Imaging In Vitro
In vitro MR images were acquired on a 3T MR system equipped with a 32-channel head coil (Ingenia CX, R5 V6.1, Philips Healthcare, Best, Netherland). The MR protocol comprised BB MRI and 4D flow MRI.
BB MRI was performed using a T1-weighted, black-blood, 3D variable refocusing flip angle turbo spin echo (TSE) sequence (Volume ISotropic Turbo spin echo Acquisition (VISTA) (26), echo time/repetition time (TE/TR): 22-32/700 ms; field-of-view (FOV): 120 × 120 × 70 mm3, echo train length: 55) with and without MSDE preparation (27) and before and after administration of 0.3 mmol/l Gadobutrol (Gd) (Gadovist, Bayer Vital, Germany). Three isotropic voxel sizes were considered ((0.5 mm)3, (0.7 mm)3, and (0.9 mm)3). To compensate for the reduced signal-to-noise ratio (SNR) with increasing spatial resolution, the number of scans averaged was set to six, three, and one, respectively, resulting in a scan duration of 11.44, 3.0, and 0.38 minutes.
4D flow MRI was performed using a 3D spoiled gradient T1-weighted fast gradient echo sequence with Cartesian sampling (TE/TR: 4.6/7.5 ms; FOV: 120 × 120 × 70 mm3; voxel size: (1 mm)3; flip angle: 8°). The sequence was accelerated 4.5-fold with a compressed-sensing technique implemented by the vendor (Philips); the examination time was 21.31 minutes.
For velocity encoding, a balanced symmetric 4-point phase-contrast encoding scheme (Hadamard) was used (28), the maximum velocity-encoding parameter (Venc) was set to 100 cm/s for model 1 supplied with 266 ml/min and to 50 cm/s for all other models and flow conditions. An integrated artificial digital trigger was used for temporally resolved data acquisition, and 24 cardiac phases were obtained.
Image-Based Flow Simulations
High-resolution hemodynamic simulations based on computational fluid dynamics (CFD) were carried out to verify the 4D flow MRI measurements (29). The vascular lumens segmented by M.P. from the patients’ 3D-RA datasets to construct 3D-printed flow models were then used to extract the simulation geometries by F.G. (a clinical research fellow with three years of experience in intracranial flow imaging). Prior to the spatial discretization of the modeling domain, the inlet and outlet of the vessels were extruded to match the distance between the aneurysm model and flow or pressure sensors, respectively, enabling a realistic comparison between simulations and experiments.
Spatial discretization of the models was carried out using the finite volume solver STAR-CCM+ 14.04 (Siemens Product Lifecycle Management Software Inc., Plato, TX, USA). The numerical meshes in the original geometries consisted of polyhedral and prismatic cells and had a base size of 0.1 mm (30). The base size was gradually enlarged for the extruded parts of the geometry to reduce the total number of required cells and the computational time. However, in the regions of interest, the high spatial resolution was kept constant. In total, the meshes consisted of approximately 9.8 million cells (model 1), 15.1 million cells (model 2), and 8.5 million cells (model 3), respectively, guaranteeing a mesh-independent solution.
Boundary conditions (time-dependent flow and pressure waveforms, Figure 1 d) were set according to the measurements. All vessel walls were assumed to be rigid, and no-slip boundary conditions were applied. The blood-mimicking fluid was considered incompressible (ρ = 1114.5 kg/m3) and Newtonian (η = 3.72 mPas). The overall maximal Reynolds number was found to be Remax = 430 in model 1; thus, laminar flow conditions were assumed for all cases.
The time-dependent blood flow simulations comprised three cardiac cycles (time-step size Δt = 0.001 s). To ensure a periodic solution and avoid initiation effects, the first two cycles were discarded, and only the last one was included in the analysis. Consistent with the 4D flow measurements, 24 evenly distributed time points throughout the cardiac cycle were exported and averaged.
Data Processing
The magnitude and phase-difference images of 4D flow MRI were reconstructed on the MRI console. The images were pre-processed manually using a dedicated software (GTflow, Version 3.1.12, Gyrotools, Switzerland) according to the 4D flow MRI consensus statement (31).
Qualitative Assessment
Three observers: M.P., O.J. (a neuroradiologist with > 30 years of experience in neurovascular imaging), and N.L. (a neuroradiologist with 12 years of experience in neurovascular imaging) independently visually assessed the gray-scaled images of BB MRI and color-coded velocity maps. The flow jets and low-velocity areas were assessed regarding their colocalization with high and low signal-intensity regions on BB MRI.
Additionally, M.P., F.G., and P.B. (a research fellow with ten years of experience in intracranial flow imaging) evaluated the agreement between CFD and 4D flow MRI velocity maps, visually assessing the position of high flow jets and low-velocity regions.
Any disagreement between the observers was resolved in consensus.
Quantitative Assessment
3D regions of interest (ROI) were manually created on 4D flow MR magnitude data using MATLAB R2020a (MathWork, USA), by M.P.: 1) The aneurysm ROI (Figure 2 b, magenta) was drawn on the border between the flow volume (bright signal) and the wall (signal void); and 2) the ROI attributed to the static tissue was drawn outside of the lumen, close to the aneurysm ROI, avoiding intersection with 3D-printed walls (Figure 2 b, top, yellow).
Figure 2.
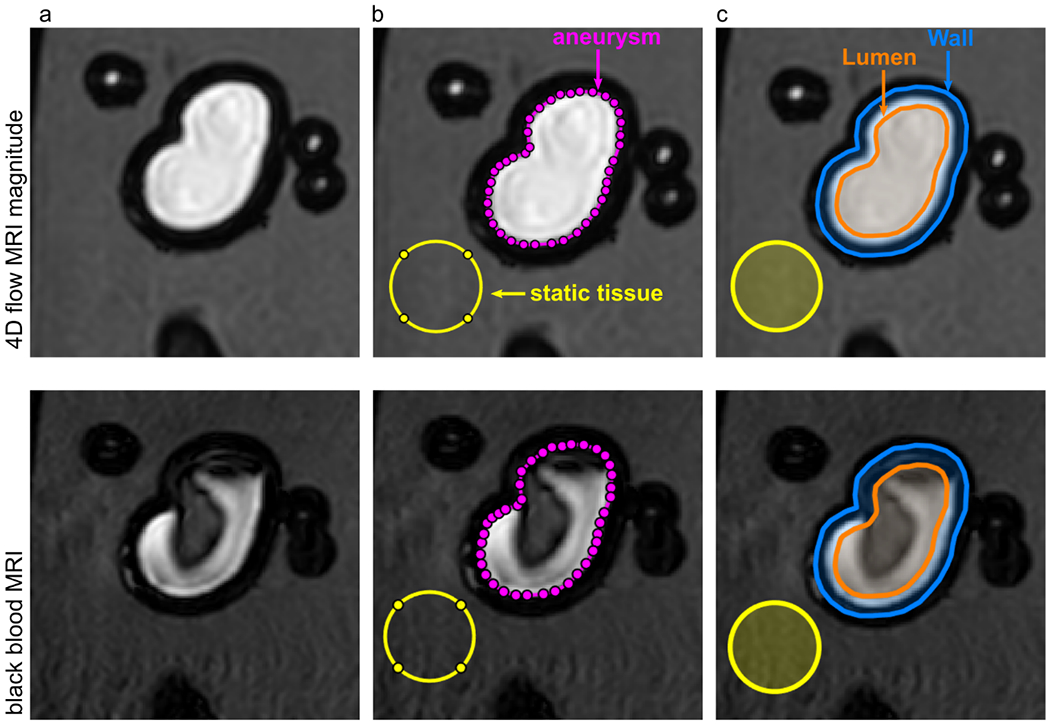
4D flow magnitude MRI (top) and BB MRI (bottom) of model 2 with different regions of interest (ROI). ROIs for lumen (orange), wall (orange-blue), aneurysm (magenta), and static tissue (yellow) were manually created on the 4D flow MR magnitude images and translated to the black-blood MRI. The BB MRI signal obtained in the aneurysm ROI (magenta) and wall (orange-blue) was normalized by the signal of the static tissue (yellow) outside of the flow volume to calculate the signal enhancement on black-blood MRI.
Using the aneurysm ROI, two more ROIs were defined as follows: 1) The lumen, containing the volume 1.5 mm to the inside of the aneurysm ROI (Figure 2 c, orange); and 2) the wall, an area covering 1.5 mm to the inside and outside of the aneurysm ROI (Figure 2 c, top, blue).
The resulting ROIs were used to assess the BB MRI and 4D flow MRI quantitatively: 1) The signal enhancement on BB MRI in lumen or wall was calculated as
2) The summed velocity magnitude in the lumen was calculated and averaged over time
where i indicates the voxel, t the cardiac phase, and Num the amount of acquired cardiac phases.
Statistical Analysis
A Kruskal-Wallis test was performed to compare intra-aneurysmal signal intensities on BB MRI with a significance level set at a p-value of 0.01 using MATLAB R2020a (MathWork, USA). The dependence between median values of the BB MRI signal and time-averaged velocity magnitude was fitted with a potential function (Microsoft Excel 2016, Microsoft Corporation, USA).
Data Representation
The visualization of flow patterns was carried out using velocity pathlines (GTflow, Version 3.1.12, Gyrotools, Switzerland) in the lumen and pixel-wise color-coded representation of time-averaged velocity magnitude in 2D planes (MATLAB R2020a, MathWork, USA).
The simulation results were post-processed in EnSight 10.2 (ANSYS Inc., Canonsburg, PA, USA).
RESULTS
Intra-Aneurysmal Flow
According to the hemodynamic simulations, flow upon entering the aneurysm was found to be 158 and 268 ml/min in model 1, 56 and 77 ml/min in model 2, and 0.1 and 0.2 ml/min in model 3 for low and high supplied flow conditions. Thus, the flow was the highest in the aneurysm of model 1 and the lowest in model 3.
Qualitatively, the velocity distribution obtained with 4D flow MRI was similar to that calculated with CFD for all three models (Figure 3). The flow patterns observed in the aneurysm sac were qualitatively identical for the two supplied flow rates for both 4D flow MRI and CFD. The velocity magnitude was higher when the model was provided with a higher flow rate, which was detected by both MRI and CFD.
Figure 3.
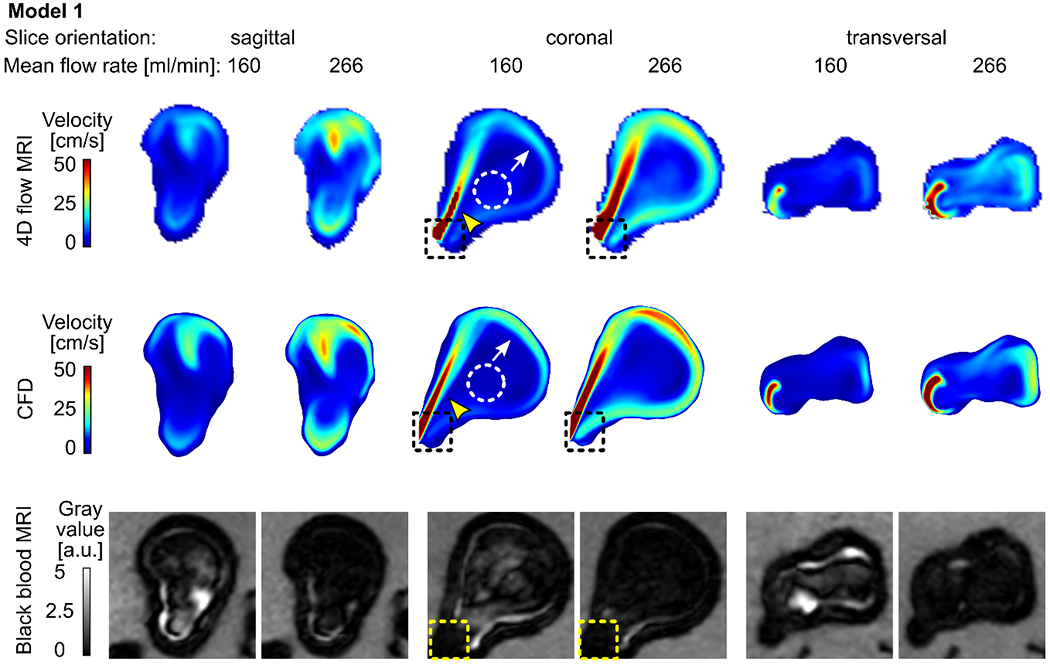
Time-averaged velocity magnitude acquired with 4D flow MRI (top) and calculated with CFD (middle) and corresponding black-blood MR images (bottom, after administering contrast agent, with 0.7 mm3 isotropic voxel size) for model 1 supplied with 160 and 266 ml/min average flow rate. Note that the 4D flow MRI and CFD revealed similar flow patterns: a strong forward flow (yellow arrowheads), reverse flow along the aneurysm wall (white arrows), and stagnation region of low velocity in the center of the aneurysm sac (dashed circles). Areas of high velocity were colocalized with low-signal areas (dashed squares).
Flow Patterns
Model 1: A jet of intense flow (velocity magnitude > 50 cm/s, Figure 3, yellow arrowhead) entering the aneurysm sac along the proximal wall hit the distal aneurysm wall. The jet was diffused after contact with the wall and lost its relatively high velocity (≈ 20-40 cm/s). The jet left the aneurysm sac along the distal wall (Figure 3, white arrow). In the center of the aneurysm sac, a stagnation zone with minimal velocity magnitude was observed (< 20 cm/s, Figure 3, dashed circle).
Model 2: A flow jet (velocity magnitude > 10-15 cm/s, Figure 4, yellow arrowhead) entering the aneurysm sac was apparent at the center of the aneurysm. When it had reached the opposite wall, it hit the wall and loses its speed (≈ 5 cm/s). The residual jet left the aneurysm sac along the distal walls (Figure 4, white arrow). The minimum velocity magnitude was observed between forward and reverse flow jets (< 5 cm/s, Figure 4, dashed circle).
Figure 4.
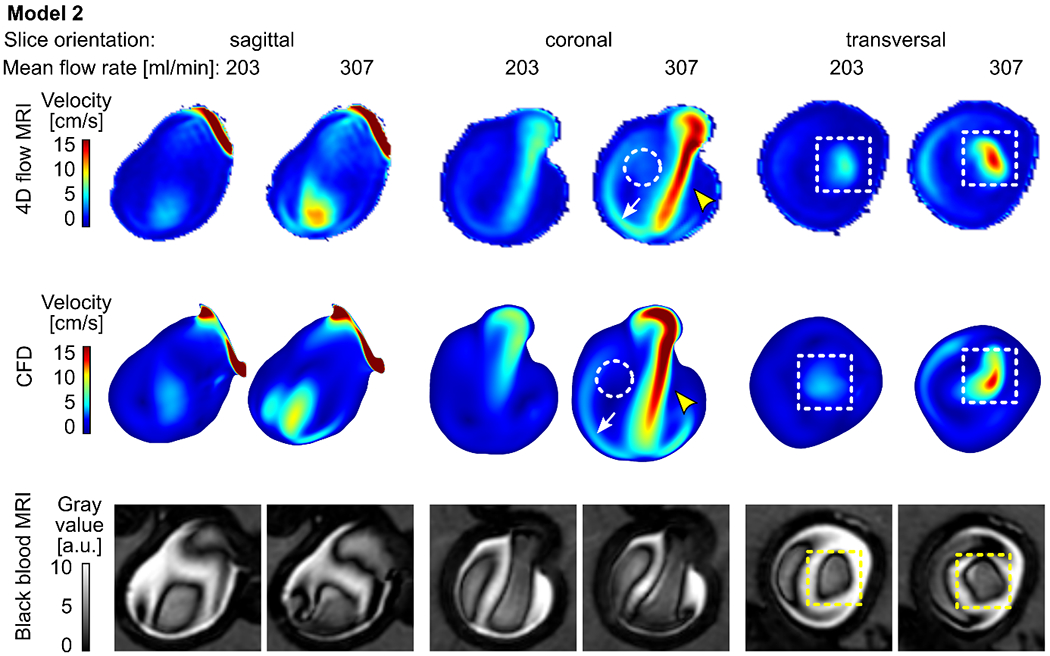
Time-averaged velocity magnitude acquired with 4D flow MRI (top) and calculated with CFD (middle) and the corresponding black-blood MR images (bottom, after administering contrast agent, with 0.7 mm3 isotropic voxel size) for model 2 supplied with 203 and 307 ml/min average flow rate. Note that the 4D flow MRI and CFD revealed similar flow patterns: a strong forward flow (yellow arrowheads), reverse flow along the aneurysm wall (white arrows), and the region of low velocity between forward and reverse flow (dashed circles). Areas of high velocity were colocalized with low-signal areas (dashed squares).
Model 3: No concentrated flow jet was apparent in model 3. 4D flow MRI and CFD generated slightly different velocity maps. 4D flow MRI detected an area of increased flow velocity at the center of the aneurysm sac (Figure 5, yellow arrowheads); CFD revealed a flow pattern adjacent to the aneurysm wall, which was not apparent on the 4D flow MR images (Figure 5, white arrows). However, both modalities confirmed predominantly slow intra-aneurysmal flow (Figure 5, velocity magnitude < 5 cm/s).
Figure 5.
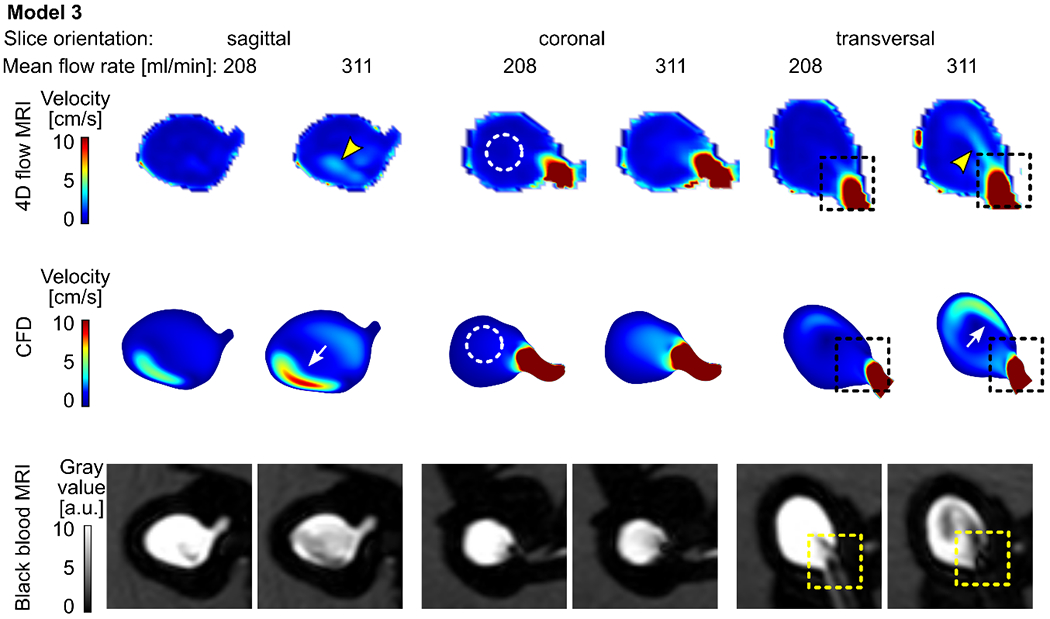
Time-averaged velocity magnitude acquired with 4D flow MRI (top) and calculated with CFD (middle) and the corresponding black-blood MR images (bottom, after administering contrast agent, with 0.7 mm3 isotropic voxel size) for model 3 supplied with 208 and 311 ml/min average flow rate. Note that the 4D flow MRI and CFD both revealed centrally located slow-flow areas (dashed circles). However, considerable differences among the modalities are present: higher flow velocities adjacent to the wall were detected by CFD (white arrows), while 4D flow MRI demonstrated a similar flow pattern removed from the wall (yellow arrowheads). Still, the areas of high velocity were colocalized with low-signal areas (dashed squares).
Flow And Signal Enhancement On BB MRI
Qualitatively, three observers noticed that, in all three models, a high-velocity magnitude was colocalized with areas of low signal intensities (recall dashed squares in Figures 3-5). In model 1, the highest velocity value (up to 50 cm/s) and the best flow suppression among the three flow models investigated were observed (Figure 3). A similar pattern of BB MRI signal and velocity was detected in model 2 (Figure 4). The velocity magnitude in the aneurysm of model 3 was < 5 cm/s (Figure 5), and when the model was supplied with 208 ml/min, the blood signal suppression was insufficient.
Quantitatively, a voxel-wise comparison between velocities acquired with 4D flow MRI and BB MRI signal confirmed that high-flow velocities were only observed together with low-signal areas (Figure 6 b). Median values of velocity and BB MRI signal distribution showed an inverse dependence on each other (Figure 1 c, Supporting information, Table S 1): higher velocities were associated with more effective blood signal suppression, resulting in lower signal intensities on black-blood MRI. The data were fitted with a potential function, resulting in the following equations: y = 7.6 × x−1.85 (R2 = 0.95) based on CFD data and y = 3.4 × x−1.27 (R2 = 0.97) based on 4D flow MRI data, where y is the BB MRI signal and x is the velocity.
Figure 6.
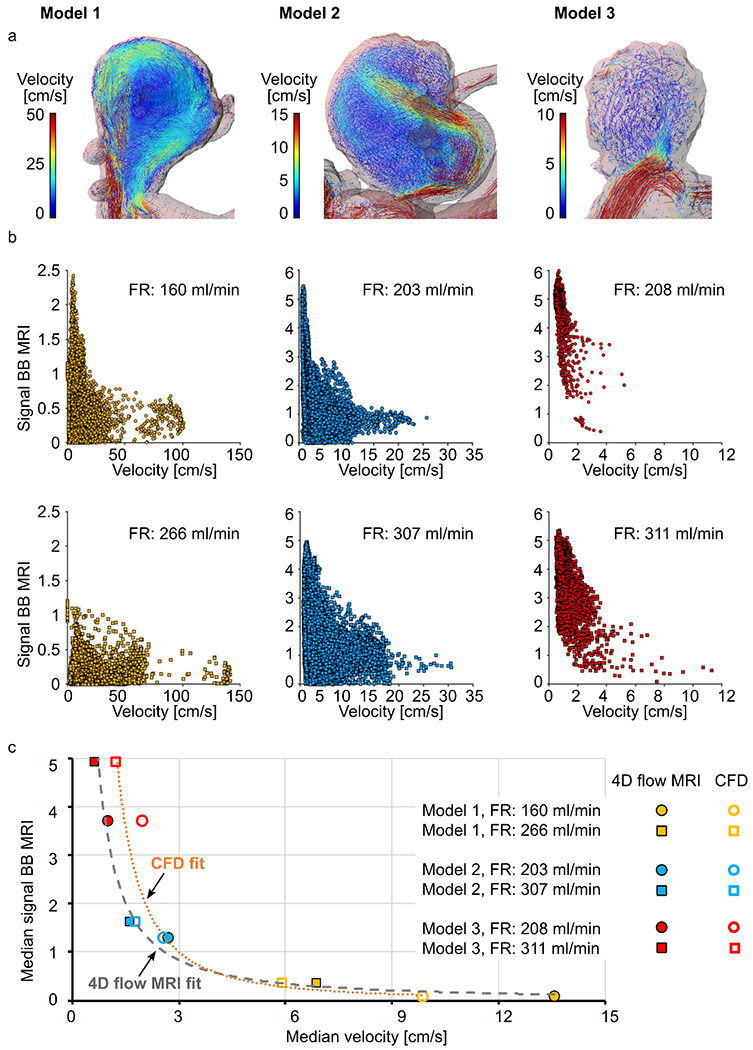
Flow patterns in models 1-3 visualized by velocity pathlines; note that the velocity scales are different for models 1-3 to magnify the flow patterns at each geometry (a), and distribution of time-averaged velocity magnitude and black-blood MRI signal intensities in the aneurysm lumen visualized with scatter plots (b). Note the different scales of a and b. The median values of time-averaged voxel-wise velocity and BB MRI signal intensities fitted with a potential function (c). High time-averaged velocity magnitude was observed only together with low-signal areas.
Imaging Parameters Of BB MRI
Model 1 exhibited the best flow signal suppression according to three observers. However, some residual unsuppressed signal was found before administration of contrast agent, especially for a voxel size of 0.9 and 0.7 mm3 (p-value < 0.01, Figure 7 a, Supporting information, Table S 2). The signal increased by a factor of 2.3 – 2.4 after administering the contrast agent (p-value < 0.01). The signal decreased by a factor of 3.2 – 4 (p-value < 0.01) when a higher flow rate was applied.
Figure 7.
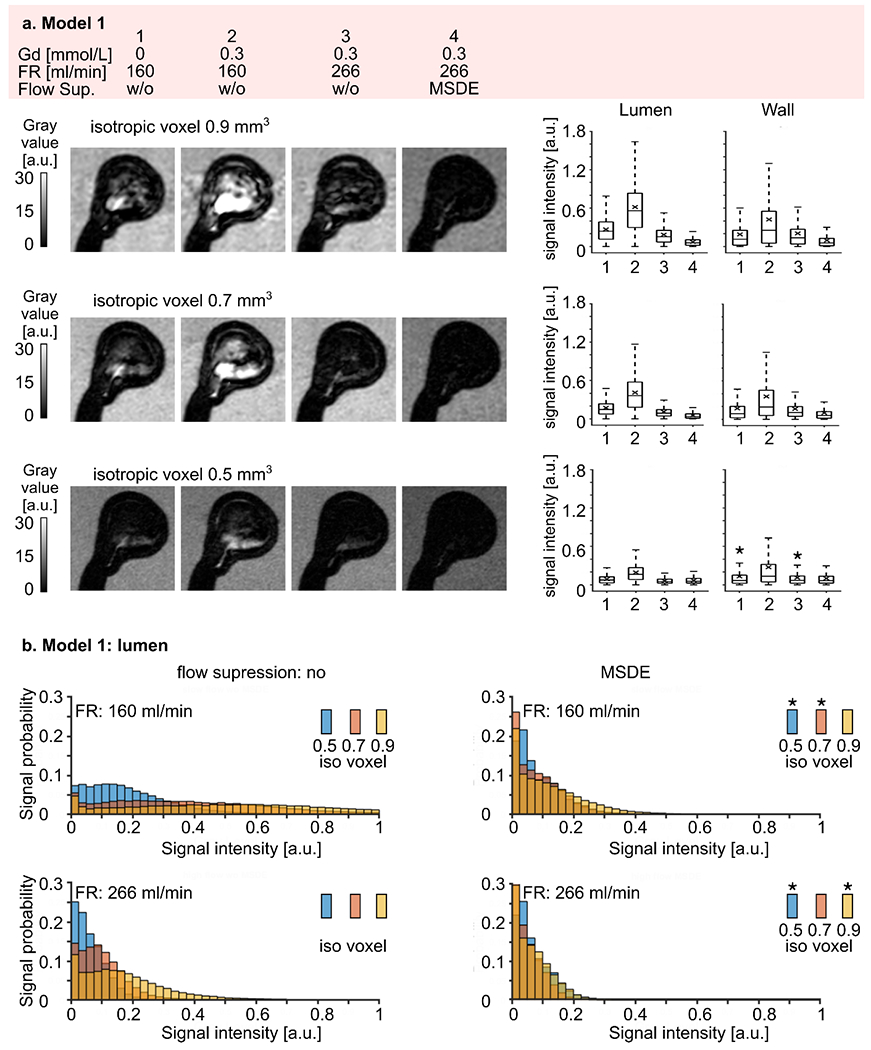
(a) Representative black-blood MR images of model 1 (high intra-aneurysmal flow) before (1) and after (2-4) administration of contrast agent, with low (1-2) and high (3-4) flow rates and additional flow suppression (MSDE, 4). The experiment was repeated with three different voxel sizes 0.9, 0.7, and 0.5 mm3 (from top to bottom). Note that the black-blood effect was more pronounced with smaller voxel sizes. Signal intensities were measured in the lumen and at the wall (right). Signal intensities increased when contrast agent was added and decreased with higher flow rates and with MSDE. The quantitative results were visualized with box plots, with the whiskers representing the upper and lower quartile. Asterisks above the box indicate a p-value > 0.01.
(b) Distribution of black-blood MRI signal intensity within the aneurysm lumen of model 1 visualized by histograms where the bar height represents the probability of finding a particular signal value in an aneurysm sac depending on the voxel size. Note that the probability of having a low signal intensity was higher when a smaller voxel size was used. Asterisks indicate a p-value > 0.01.
MSDE preparation pulse improved blood signal suppression even further (p-value < 0.01, Table S 2). However, when the signal from the blood was already well suppressed, e.g., for a voxel size of 0.5 mm3 at a higher flow rate, MSDE resulted in statistically lower signal intensities (p-value < 0.01), but did not change the visual perception of signal intensities in the qualitative analysis.
Reducing the voxel size decreased the signal intensities at low and high flow rates without MSDE preparation pulse (Figure 7 b, Table S 3, p-value < 0.01). However, when the signal was already well suppressed, the voxel size reduction did not improve blood signal suppression. Namely, the median signal intensity was the same for a voxel size of 0.5 and 0.7 mm3 at a flow rate of 160 ml/min (median signal: 0.05 and 0.05, p-value = 0.76) and for 0.5 and 0.9 mm3 at a flow rate of 266 ml/min (median signal: 0.05 and 0.06, p-value = 0.97), when MSDE pulse was applied. Besides, the signal distribution was skewed towards lower signal intensities (Figure 7 b, right).
Signal intensity distribution for model 2 was similar to that for model 1 over the four different experimental conditions (Figure 8 a). Namely, a residual unsuppressed flow signal was found before administering the contrast agent (Table S 4). Signal intensities increased by a factor of 1.9 – 2 after administering the contrast agent (p-value < 0.01). The signal decreased by a factor of 1.3 – 1.8 (p-value < 0.01) when the higher flow rate was applied. MSDE preparation pulse improved blood signal suppression (p-value < 0.01). The voxel size reduction resulted in lower signal intensities when acquired without a MSDE preparation pulse (p-value < 0.01, Figure 8 b). The opposite tendency was observed when MSDE preparation pulse was used (p-value < 0.01, Table S 5). Overall, signal intensities were higher in model 2, ranging from 0 to 6.53, than in model 1, ranging from 0 to 3.19.
Figure 8.
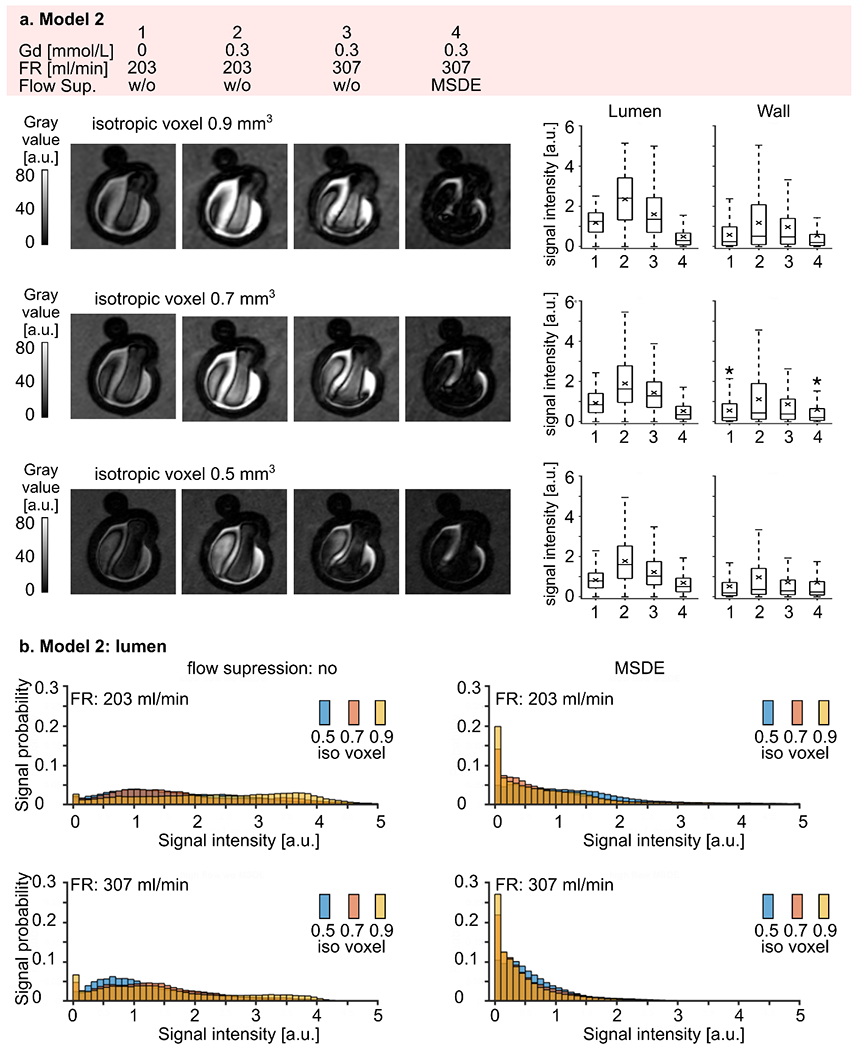
(a) Representative black-blood MR images of model 2 (medium intra-aneurysmal flow) before (1) and after (2-4) administering contrast agent, with low (1-2) and high (3-4) flow rates and additional flow suppression (MSDE, 4). The experiment was repeated with three different voxel sizes: 0.9, 0.7, and 0.5 mm3 (from top to bottom). Note that the black-blood effect was more pronounced with smaller voxel sizes. Signal intensities were measured in the lumen and at the wall (right). The intensity increased when contrast agent was added and reduced with a higher flow rate and with MSDE. The quantitative results were visualized with box plots, with the whiskers representing the upper and lower quartile. Asterisks indicate a p-value > 0.01.
(b) Distribution of black-blood MRI signal intensities within the aneurysm lumen of model 2 visualized by histograms where the bar height represents the probability of finding a particular signal value in an aneurysm sac depending on the voxel size. Note that the probability of low signal intensities was higher when a smaller voxel size was used. Differences in signal intensities among the experiments with different voxel sizes were statistically significant. (p-value < 0.01).
Model 3 exhibited the weakest flow suppression, with signal intensities ranging from 0 to 7.4. However, relative changes in signal intensities over the four different experimental conditions were comparable to models 1 and 2 (Figure 9 a). Again, residual unsuppressed signal was found before administering a contrast agent (Table S 6). Signal intensities increased by a factor of 3 – 3.9 after administering the contrast agent (p-value < 0.01) and slightly decreased by a factor of 1.1 -1.3 when the higher flow rate was applied (p-value < 0.01). MSDE preparation pulse improved blood signal suppression for voxel sizes of 0.9 and 0.7 mm3 (p-value < 0.01), but did not affect signal intensities at a voxel size of 0.5 mm3 (p = 0.98). Still, a relatively large portion of residual unsuppressed signal was present. The reduced voxel size resulted in a reduction in signal intensities only at a flow rate of 311 ml/min without MSDE (p-value < 0.01, Table S 7, Figure 9 b). The opposite tendency was observed at a flow rate of 208 ml/min with and without MSDE preparation pulse (p-value < 0.01). For the high flow rate the signal did not differ between 0.5 and 0.7 mm3 (p-value = 0.012) and between 0.7 and 0.9 mm3 (p-value = 0.022)
Figure 9.
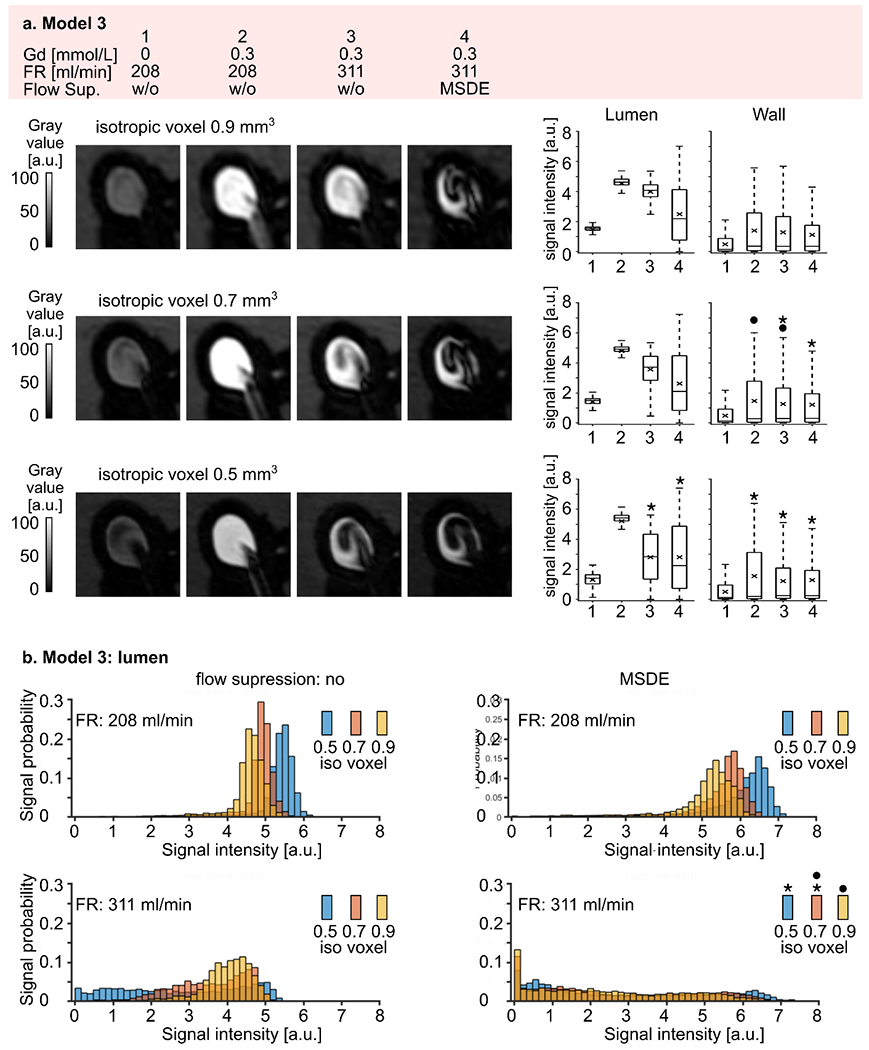
(a) Representative black-blood MR images of model 3 (slow intra-aneurysmal flow) before (1) and after (2-4) administering contrast agent, with low (1-2) and high (3-4) flow rates and additional flow suppression (MSDE, 4). The experiment was repeated with three different voxel sizes: 0.9, 0.7, and 0.5 mm3 (from top to bottom). Note that the black-blood suppression was more pronounced at smaller voxel sizes. Signal intensities were measured in the lumen and at the wall (right). Signal intensities increased when contrast agent was added and reduced at a higher flow rate and with MSDE. The quantitative results visualized with box plots, with the whiskers representing the upper and lower quartile. Asterisks indicate a p-value > 0.01.
(b) Distribution of black-blood MRI signal intensities within the aneurysm lumen of model 3 visualized by histograms, where the bar height represents the probability of finding a particular signal value in an aneurysm sac depending on the voxel size. Note that the probability of low signal intensities was higher when a smaller voxel size was used. Asterisks indicate a p-value > 0.01).
Among all three models, the following tendency was observed: MR signal in the aneurysm increased by a factor of 2.56 ± 0.68 (mean ± standard deviation) (p < 0.01) after Gd contrast administration and by a factor of 2.21 ± 1.12 (p < 0.01) when a higher flow rate was applied. The signal intensity was further reduced by a factor of 4.91 ± 3.01 (p < 0.01) when MSDE and the high flow rate were used. After administering Gd, signal suppression was most pronounced when the flow was high and MSDE was applied (from 2.41 ± 2.07 for slow flow without MSDE to 0.87 ± 0.99 for high flow with MSDE).
DISCUSSION
VWE has been linked to vessel-wall inflammation and associated with a higher risk of rupture (15–18). 3D T1-weighted TSE sequences are typically applied for imaging of the vessel wall because they can effectively suppress the signal from flowing blood, providing full brain coverage within an adequate examination time (26, 32). Blood signal suppression in 3D T1 TSE is primarily attributable to 1) intravoxel signal dephasing due to the velocity and acceleration distribution of the flowing spins and 2) the outflow of the blood from the imaging slice between excitation and refocusing the radiofrequency pulses. However, the extent of flow-related signal enhancement can be modified with imaging parameters; for example, the effect of the repetition time and receiver bandwidth was demonstrated by Alexander et al. (33). Moreover, choice of TE can impact the black-blood effect. A longer TE provides more time for the slow-flowing blood to mix, disperse, and leave the imaging slice. However, this comes at the expense of a reduced SNR and a stronger T2-weighting.
Slow Blood Flow
Despite the generally successful blood signal suppression in 3D T1 TSE images, it was previously described that slowly flowing or recirculating blood can give rise to an intraluminal hyperintense signal on black-blood MR images (22). Accordingly, the results showed that signal intensities increase with slower blood-flow velocities inside the aneurysm sac and adjacent to the wall, leading to a diminished black-blood effect in these areas. This was supported by the finding that regions with a hyperintense signal were colocalized with low-velocity areas, as detected by 4D flow MRI and hemodynamic simulations. These results have been in line with similar findings reported previously (22, 23).
Conversely, the inflow jet, a high-velocity entity traversing the aneurysm, was colocalized with hypointense areas of complete flow suppression.
The observed association between signal enhancement and slow flow was particularly noticeable. It has been shown previously that both signal enhancement (15) and slow flow (20) can be associated with a higher risk of aneurysm rupture. In the present study, an association was found between median velocity and BB MRI signal intensity, supporting the hypothesis that the visualization of slow blood flow on BB MRI could help to identify hemodynamic conditions associated with aneurysm progression and rupture risk, as opposed to regarding it only as a misleading artifact.
However, it has not yet been clarified whether there is a quantitative correlation between flow velocity, the extent of wall remodeling, and rupture risk in intracranial aneurysms.
Hemodynamic parameters can be measured noninvasively with 4D flow MRI. Still, this approach has not been widely used in clinical routine due to long acquisition times. The addition of accelerated flow-sensitive MRI sequences to the vessel-wall imaging protocol may strengthen the evaluation of aneurysms. However, typical 4D flow MRI acquisitions are not sensitive to slow flow conditions. Here, the most considerable difference between 4D flow MRI and CFD data was found for model 3, which had the lowest intra-aneurysmal flow. Likely, the differences occurred because the Venc of 50 cm / s was set much higher than the flow in model 3 of < 5 cm / s. As the velocity noise is proportional to the Venc and inversely proportional to the SNR, a high Venc hampers accurate quantification of slow flow (34). By better estimating the velocity-encoding parameter the velocity-to-noise ratio and 4D flow MRI sensitivity to the slow flow could be improved. Indeed, underestimating the Venc results in phase wrapping and velocity aliasing, but an overestimation results in high-velocity noise. A dual-venc 4D flow MRI scheme could facilitate the accurate measurement of high and low flow simultaneously (35).
Moreover, numerical simulations based on 4D flow MRI patient-specific inflow boundary conditions can contribute to the reliable assessment of intra-aneurysmal flow (36). For a comprehensive hemodynamic assessment, 4D flow MRI can easily be included in a clinical scanning protocol and, if necessary, complemented afterwards with hemodynamic simulations.
Voxel Size
The results of this study have demonstrated that voxel size has influenced the efficiency of blood signal suppression. A high spatial resolution increases the amplitude of the readout gradients and promotes flow-induced signal dephasing. By using thin slices, blood is cleared from the imaging area faster and thus can improve flow suppression. At the same time, smaller voxels cause less intravoxel dephasing, reducing blood suppression. On the other hand, it has been recommended to use the highest resolution possible in vessel-wall imaging to minimize partial volume effects (37).
In this study, the results have been rather complex: in model 1, blood signal suppression was most efficient at smaller voxel sizes in all experiments conducted; the same applied to model 2 without MSDE, where signal suppression was also more efficient with smaller voxel sizes. In contrast to that, blood signal suppression was more pronounced at larger voxel sizes with MSDE in model 2. In model 3, a small voxel size resulted in better blood signal suppression when a higher flow rate (311 ml/min) was provided. For a lower flow rate (208 ml/min), the larger voxel size was most efficient for signal suppression. Likely, the effect of the voxel size has been dependent on intra-aneurysmal flow velocity. With fast flow rates, the outflow from the voxel may play a dominant role in blood signal suppression. Thus, the smaller the voxel, the better the signal suppression, which was observed in model 1. In contrast, intravoxel dephasing, which was more pronounced in larger voxels, may be the dominant factor when slower flow rates were present. Such a dependency was observed in model 3 at a flow rate of 208 ml/min. Overall, blood signal suppression efficiency seems to depend on a complex interaction of imaging parameters and hemodynamic conditions. However, in clinical practice, a higher spatial resolution has been preferable (37) to adequately depict morphological features and pathological changes in the intracranial vasculature, but must be balanced against an acceptable acquisition time.
MSDE Preparation Pulse
In accordance with previous results (21) the current study found that MSDE further reduced flow-related signal enhancement. Interestingly, by using the vessel-wall imaging protocol with a voxel size of 0.5 mm3 and MSDE preparation blood signal suppression (model 1 = 0.05, model 2 = 0.51, model 3 = 2.25) was similar to that in the protocol with a voxel size of 0.9 mm3 and MSDE (model 1 = 0.06, model 2 = 0.30, model 3 = 2.19). Thus, in a clinical setting, MSDE preparation may be a more practical choice to improve blood signal suppression while maintaining an acceptable scanning time, in contrast to the use of a higher spatial resolution at the cost of longer acquisition times. However, other aspects such as diagnostic performance of MSDE-prepared black-blood MRI should be further investigated since MSDE preparation was reported to reduce the SNR of static tissue (38), which was also observed in the present study (data not shown). By modifying MSDE module, image quality can be enhanced (27). However, other black-blood techniques, such as delay alternating with nutation for tailored excitation (DANTE) (39), have been reported to suppress the signal from slowly flowing blood even more effectively (22), with an improved SNR compared to MSDE (41). Still, the clinical applicability of DANTE has been restricted due to a prolonged examination time (TR DANTE ≈ 923 ms, TR MSDE ≈ 623 ms (40)).
Limitations
Overall, the study reported a single-center experience. The experiments were conducted on a small number of models. However, the three patient-specific aneurysm models exhibited different representative flow patterns (e.g., bifurcation versus side-wall aneurysm). Moreover, a blood-mimicking fluid was used. Although a viscosity comparable to blood was chosen, the absolute signal intensities in vivo might be different. However, assessment of relative changes in signal intensities remained feasible. Next, rigid 3D-printed models were used in the study. The intrinsic signal intensity of the artificial wall was zero and differs from the signal intensity of in vivo aneurysm walls, precluding direct transfer of the results to in vivo scans. In addition, the microscopic properties of the surface of a 3D-printed model were different from those of a vessel in vivo. In addition, a manufacturing error in the 3D printing process could lead to small differences between the velocity maps derived from CFD and 4D flow MRI. Particularly, this may affect parameters that depend on the interaction with the wall, such as WSS and OSI. However, the limited spatial resolution of 4D flow MRI might have a greater effect on the quantification of WSS and OSI than the spatial resolution of 3D printing. Additionally, the jet orientation relative to the 1st readout gradient moment might influence the flow suppression. However, that effect was not assessed in this study.
Conclusion
Signal enhancement in aneurysms on black-blood MRI has been induced by slow blood flow velocities and can therefore aid in detecting hemodynamic conditions associated with a higher risk of aneurysm rupture. The effect depends on black-blood MRI scanning parameters. This should be taken into account in the clinical setting when assessing VWE in patients with an unruptured aneurysm for risk stratification.
Supplementary Material
ACKNOWLEDGEMENTS
We appreciate the help and support in the study design by Charles M. Strother.
Grant support
The authors are grateful for the financial and intellectual support by the Research Training Group “Materials4Brain” (GRK2154; P2). This study was funded by Federal Ministry of Education and Research in Germany (grant number 13GW0473A) European Structural and Investment Funds (grant number ZS/2016/08/80646) and the German Research Foundation (grant number BE 6230/2–1). Further support by the cluster of excellence Precision Medicine in Inflammation PMI 1267 and the faculty of medicine for funding the core facility MOIN CC is acknowledged.
REFERENCES
- 1.Vlak MH, Algra A, Brandenburg R, Rinkel GJ: Prevalence of unruptured intracranial aneurysms, with emphasis on sex, age, comorbidity, country, and time period: a systematic review and meta-analysis. Lancet Neurol 2011; 10:626–636. [DOI] [PubMed] [Google Scholar]
- 2.Wiebers DO: Unruptured intracranial aneurysms: natural history, clinical outcome, and risks of surgical and endovascular treatment. The Lancet 2003; 362:103–110. [DOI] [PubMed] [Google Scholar]
- 3.Chalouhi N, Ali MS, Jabbour PM, et al. : Biology of intracranial aneurysms: role of inflammation. J Cereb Blood Flow Metab 2012; 32:1659–1676. [DOI] [PMC free article] [PubMed] [Google Scholar]
- 4.Tulamo R, Frösen J, Hernesniemi J, Niemelä M: Inflammatory changes in the aneurysm wall: a review. J NeuroInterventional Surg 2018; 10(Suppl 1):i58–i67. [DOI] [PubMed] [Google Scholar]
- 5.Turkmani AH, Edwards NJ, Chen PR: The role of inflammation in cerebral aneurysms. Neuroimmunol Neuroinflammation 2015; 2:102–106. [Google Scholar]
- 6.Kataoka Kazuo, Taneda Mamoru, Asai Toshiharu, Kinoshita Akira, Ito Mamoru, Kuroda Ryotaro: Structural Fragility and Inflammatory Response of Ruptured Cerebral Aneurysms. Stroke 1999; 30:1396–1401. [DOI] [PubMed] [Google Scholar]
- 7.Frösen J, Piippo A, Paetau A, et al. : Remodeling of saccular cerebral artery aneurysm wall is associated with rupture: histological analysis of 24 unruptured and 42 ruptured cases. Stroke 2004; 35:2287–2293. [DOI] [PubMed] [Google Scholar]
- 8.Frösen J, Piippo A, Paetau A, et al. : Growth factor receptor expression and remodeling of saccular cerebral artery aneurysm walls: implications for biological therapy preventing rupture. Neurosurgery 2006; 58:534–541; discussion 534–541. [DOI] [PubMed] [Google Scholar]
- 9.Shimizu K, Kushamae M, Aoki T: Macrophage Imaging of Intracranial Aneurysms. Neurol Med Chir (Tokyo) 2019; 59:257–263. [DOI] [PMC free article] [PubMed] [Google Scholar]
- 10.Larsen N, von der Brelie C, Trick D, et al. : Vessel Wall Enhancement in Unruptured Intracranial Aneurysms: An Indicator for Higher Risk of Rupture? High-Resolution MR Imaging and Correlated Histologic Findings. Am J Neuroradiol 2018; 39:1617–1621. [DOI] [PMC free article] [PubMed] [Google Scholar]
- 11.Portanova A, Hakakian N, Mikulis DJ, Virmani R, Abdalla WMA, Wasserman BA: Intracranial Vasa Vasorum: Insights and Implications for Imaging. Radiology 2013; 267:667–679. [DOI] [PubMed] [Google Scholar]
- 12.Shimonaga Koji, Matsushige Toshinori, Ishii Daizo, et al. : Clinicopathological Insights From Vessel Wall Imaging of Unruptured Intracranial Aneurysms. Stroke 2018; 49:2516–2519. [DOI] [PubMed] [Google Scholar]
- 13.Sato T, Matsushige T, Chen B, et al. : Wall Contrast Enhancement of Thrombosed Intracranial Aneurysms at 7T MRI. Am J Neuroradiol 2019; 40:1106–1111. [DOI] [PMC free article] [PubMed] [Google Scholar]
- 14.Matsushige T, Shimonaga K, Mizoue T, et al. : Focal Aneurysm Wall Enhancement on Magnetic Resonance Imaging Indicates Intraluminal Thrombus and the Rupture Point. World Neurosurg 2019; 127:e578–e584. [DOI] [PubMed] [Google Scholar]
- 15.Hartman JB, Watase H, Sun J, et al. : Intracranial aneurysms at higher clinical risk for rupture demonstrate increased wall enhancement and thinning on multicontrast 3D vessel wall MRI. Br J Radiol 2019; 92:20180950. [DOI] [PMC free article] [PubMed] [Google Scholar]
- 16.Edjlali M, Guédon A, Ben Hassen W, et al. : Circumferential Thick Enhancement at Vessel Wall MRI Has High Specificity for Intracranial Aneurysm Instability. Radiology 2018; 289:181–187. [DOI] [PubMed] [Google Scholar]
- 17.Hu P, Yang Q, Wang D-D, Guan S-C, Zhang H-Q: Wall enhancement on high-resolution magnetic resonance imaging may predict an unsteady state of an intracranial saccular aneurysm. Neuroradiology 2016; 58:979–985. [DOI] [PubMed] [Google Scholar]
- 18.Larsen N, Flüh C, Saalfeld S, et al. : Multimodal validation of focal enhancement in intracranial aneurysms as a surrogate marker for aneurysm instability. Neuroradiology 2020. [DOI] [PMC free article] [PubMed] [Google Scholar]
- 19.Quan Kai, Song Jianping, Yang Zixiao, et al. : Validation of Wall Enhancement as a New Imaging Biomarker of Unruptured Cerebral Aneurysm. Stroke 2019; 50:1570–1573. [DOI] [PubMed] [Google Scholar]
- 20.Liang L, Steinman DA, Brina O, Chnafa C, Cancelliere NM, Pereira VM: Towards the Clinical utility of CFD for assessment of intracranial aneurysm rupture — a systematic review and novel parameter-ranking tool. J NeuroInterventional Surg 2018:neurintsurg-2018-014246. [DOI] [PubMed] [Google Scholar]
- 21.Kalsoum E, Chabernaud Negrier A, Tuilier T, et al. : Blood Flow Mimicking Aneurysmal Wall Enhancement: A Diagnostic Pitfall of Vessel Wall MRI Using the Postcontrast 3D Turbo Spin-Echo MR Imaging Sequence. Am J Neuroradiol 2018; 39:1065–1067. [DOI] [PMC free article] [PubMed] [Google Scholar]
- 22.Cornelissen BMW, Leemans EL, Coolen BF, et al. : Insufficient slow-flow suppression mimicking aneurysm wall enhancement in magnetic resonance vessel wall imaging: a phantom study. Neurosurg Focus 2019; 47:E19. [DOI] [PubMed] [Google Scholar]
- 23.Cornelissen BMW, Leemans EL, Slump CH, Marquering HA, Majoie CBLM, Berg R van den: Vessel wall enhancement of intracranial aneurysms: fact or artifact? Neurosurg Focus 2019; 47:E18. [DOI] [PubMed] [Google Scholar]
- 24.Pravdivtseva MS, Peschke E, Lindner T, et al. : 3D-printed, patient-specific intracranial aneurysm models: from clinical data to flow experiments with endovascular devices. Med Phys ; n/a(n/a). [DOI] [PubMed] [Google Scholar]
- 25.Zarrinkoob L, Ambarki K, Wåhlin A, Birgander R, Eklund A, Malm J: Blood flow distribution in cerebral arteries. J Cereb Blood Flow Metab 2015; 35:648–654. [DOI] [PMC free article] [PubMed] [Google Scholar]
- 26.Qiao Y, Steinman DA, Qin Q, et al. : Intracranial arterial wall imaging using three-dimensional high isotropic resolution black blood MRI at 3.0 Tesla. J Magn Reson Imaging 2011; 34:22–30. [DOI] [PubMed] [Google Scholar]
- 27.Wang J, Yarnykh VL, Yuan C: Enhanced Image Quality in Black-Blood MRI by Using the Improved Motion-Sensitized Driven-Equilibrium (iMSDE) Sequence. J Magn Reson Imaging JMRI 2010; 31:1256–1263. [DOI] [PMC free article] [PubMed] [Google Scholar]
- 28.Pelc NJ, Bernstein MA, Shimakawa A, Glover GH: Encoding strategies for three-direction phase-contrast MR imaging of flow. J Magn Reson Imaging 1991; 1:405–413. [DOI] [PubMed] [Google Scholar]
- 29.Roloff C, Stucht D, Beuing O, Berg P: Comparison of intracranial aneurysm flow quantification techniques: standard PIV vs stereoscopic PIV vs tomographic PIV vs phase-contrast MRI vs CFD. J NeuroInterventional Surg 2018:neurintsurg-2018–013921. [DOI] [PubMed] [Google Scholar]
- 30.Janiga G, Berg P, Beuing O, et al. : Recommendations for accurate numerical blood flow simulations of stented intracranial aneurysms. Biomed Tech (Berl) 2013; 58:303–314. [DOI] [PubMed] [Google Scholar]
- 31.Dyverfeldt P: 4D flow cardiovascular magnetic resonance consensus statement. 2015:19. [DOI] [PMC free article] [PubMed] [Google Scholar]
- 32.Zhang L, Zhang N, Wu J, et al. : High resolution three dimensional intracranial arterial wall imaging at 3T using T1 weighted SPACE. Magn Reson Imaging 2015; 33:1026–1034. [DOI] [PubMed] [Google Scholar]
- 33.Alexander AL, Buswell HR, Sun Y, Chapman BE, Tsuruda JS, Parker DL: Intracranial black-blood MR angiography with high-resolution 3D fast spin echo. Magn Reson Med 1998; 40:298–310. [DOI] [PubMed] [Google Scholar]
- 34.Markl M, Frydrychowicz A, Kozerke S, Hope M, Wieben O: 4D flow MRI. J Magn Reson Imaging JMRI 2012; 36:1015–1036. [DOI] [PubMed] [Google Scholar]
- 35.Schnell S, Ansari SA, Wu C, et al. : Accelerated Dual-Venc 4D flow MRI for neurovascular applications. J Magn Reson Imaging JMRI 2017; 46:102–114. [DOI] [PMC free article] [PubMed] [Google Scholar]
- 36.Berg P, Saalfeld S, Voß S, Beuing O, Janiga G: A review on the reliability of hemodynamic modeling in intracranial aneurysms: why computational fluid dynamics alone cannot solve the equation. Neurosurg Focus 2019; 47:E15. [DOI] [PubMed] [Google Scholar]
- 37.Mandell DM, Mossa-Basha M, Qiao Y, et al. : Intracranial Vessel Wall MRI: Principles and Expert Consensus Recommendations of the American Society of Neuroradiology. Am J Neuroradiol 2017; 38:218–229. [DOI] [PMC free article] [PubMed] [Google Scholar]
- 38.Koktzoglou I, Li D: Diffusion-prepared segmented steady-state free precession: Application to 3D black-blood cardiovascular magnetic resonance of the thoracic aorta and carotid artery walls. J Cardiovasc Magn Reson Off J Soc Cardiovasc Magn Reson 2007; 9:33–42. [DOI] [PubMed] [Google Scholar]
- 39.Li L, Miller KL, Jezzard P: DANTE-prepared pulse trains: a novel approach to motion-sensitized and motion-suppressed quantitative magnetic resonance imaging. Magn Reson Med 2012; 68:1423–1438. [DOI] [PubMed] [Google Scholar]
- 40.Li L, Chai JT, Biasiolli L, et al. : Black-Blood Multicontrast Imaging of Carotid Arteries with DANTE-prepared 2D and 3D MR Imaging. Radiology 2014; 273:560–569. [DOI] [PubMed] [Google Scholar]
Associated Data
This section collects any data citations, data availability statements, or supplementary materials included in this article.


