

Abstract
Objectives:
A holistic understanding of the many ways that systemic dehydration affects vocal fold biology is still evolving. There are also myriad physiologically relevant methodologies to induce systemic dehydration. To untangle the effects of systemic dehydration on vocal fold biology, we need to utilize realistic, clinically translatable paradigms of systemic dehydration in lab animals. Restricted access to water accommodates clinical translation. We investigated whether systemic dehydration via reduced water intake would negatively affect vocal fold biology.
Study Design:
Prospective, in vivo study design.
Methods:
Male Sprague Dawley rats (N = 13) were provided 4 mL/100 g of water/day for 5 days, whereas male control rats (N = 8) were given ad lib access to water. Following euthanasia, tissues were processed for histological staining, gene expression, and protein assays.
Results:
Renin gene expression level in kidneys increased significantly (P ≤ .05), validating dehydration. Dehydration induced by restricted water access downregulated the gene expression of interleukin-1α and desmoglein-1 (P ≤ .05). Hyaluronidase-2 gene expression increased after dehydration (P ≤ .05). The protein level of desmoglein-1 decreased after dehydration (P ≤ .05). Histological analyses suggested decreased hyaluronan (P ≤ .05) in the water-restricted rat vocal fold.
Conclusion:
Reduced daily water intake for just 5 days impairs vocal fold biology by disrupting inflammatory cytokine release, reducing plasma membrane integrity, and disrupting the hyaluronan network. This is the first study investigating the dehydrating effects of restricted water intake on vocal fold tissue in an in vivo model.
Level of Evidence:
NA (prospective animal study).
Keywords: Vocal fold, dehydration, water restriction, pathobiology, rat
INTRODUCTION
Vocal folds are bilateral, viscoelastic tissues that vibrate for voice production. Viscoelastic shear properties of vocal fold tissues are regulated by the amount of tissue hydration.1 Therefore, maintaining vocal fold hydration homeostasis is thought to contribute to optimal vocal fold vibration and voice quality.2 Speakers are consequently advised to ensure adequate hydration intake to prevent systemic dehydration.3 Clinical recommendations to avoid vocal fold dehydration are, however, largely based on anecdotal evidence. Recently, more experimental data are emerging on whether systemic dehydration of the body (defined by body weight loss), can induce vocal fold dehydration.4 Published work in our laboratory has demonstrated vocal fold dehydration, corroborated by proton density-weighted magnetic resonance imaging, following water withholding for 72 hours in a rodent model.5,6 The expression of several major extracellular matrix (ECM) components did not change by qualitative polymerase chain reaction (qPCR) or by histochemical staining during this time period (unpublished data). To develop a holistic understanding of the effects of systemic dehydration on vocal fold tissue, additional research is needed using physiologically relevant methods of systemic dehydration and investigating the underlying biological changes to this tissue.
This study investigated the effects of restricting water intake for 5 days on gene expression and protein levels of membrane proteins (desmoglein-1), inflammatory cytokines (interleukin-1α [IL-1α] and interleukin-1β [IL-1β]), and ECM components (hyaluronan [HA]). HA is an important component of the ECM and is responsible for maintaining tissue hydration, osmotic balance, and supporting tissue integrity.7,8 Systemic dehydration induced by withholding water for 72 hours is associated with changes in HA quantity in the female rat vocal fold lamina propria.9 HA interacts with cells through various cell surface receptors, including CD44, found in vocal fold fibroblasts.10,11 Hyaluronan synthase 2 (Has2), hyaluronidase-1 (Hyal1) and hyaluronidase-2 (Hyal2) are enzymes responsible for biosynthesis and degradation of HA, contributing to HA homeostasis in tissue,12 and were also included in this study. Proteoglycan 4 (PRG4), a lubricant that enables connective tissues to withstand shearing and frictional forces during motion,13 was also investigated. Interleukin-1 (IL-1) family of cytokines is primarily associated with innate immunity, which can function as a mechanism of host defense.14 Therefore, steady expression level of IL-1α and IL-1β in healthy vocal fold tissue is important for triggering innate immunity when the tissue is exposed to a wide range of stimuli, including dehydration. Finally, desmoglein-1 (DSG1), a member of the desmoglein protein subfamily associated with resisting shearing forces in tissues exposed to mechanical stress,15 including heart and skin,16,17 was investigated as the vocal fold is also subjected to repeated mechanical stress.
The objective of this study was to investigate the impact of a physiologically realistic method of systemic dehydration on vocal fold biology in a laboratory animal model that can be translated to human beings. Previous published studies perturbed hydration levels using viscous solutions applied to the surface of excised larynges,18 exposing excised vocal folds to dry air19 or immersing excised vocal folds in hypertonic solution.20 These data cannot be translated to humans because experiments were conducted on ex vivo tissues. in vivo methodologies of induced dehydration by water deprivation5,9 are limited because complete water deprivation is infrequent, stressful, and can result in reduced appetite.
In contrast, access to limited water (water restriction) is a paradigm that is followed by healthy individuals and is evident around the globe. It is a physiologically realistic method to induce dehydration while minimizing stress on the animal. In this study, two groups were compared (control vs. water restriction). Daily water intake was first assessed for 5 days in animals in both groups. Next, animals in the control group were provided ad libitum access to water for 5 days, whereas animals in the experimental group were provided half of the average daily water intake21 for 5 days.
MATERIALS AND METHODS
Experimental Animals
The animal experiments were conducted according to protocols approved by the Purdue Animal Care and Use Committee (PACUC 1703001551). Male Sprague–Dawley rats (< 6 months), weighing 382 to 473 g (Envigo Inc, Indianapolis, IN), were housed one per cage. The rats were acclimated to the housing conditions for 1 week before experiments were conducted.
Water Restriction Protocol
After acclimation, animals were randomly assigned to water-restricted (N = 13) and control groups (N = 8). The entire experiment lasted for 10 days. During the first 5 days, hereafter referred to as the baseline period, animals in the water-restricted and control groups were provided water ad libitum. During the next 5 days, hereafter referred to as the experimental period, control rats were given water ad libitum, whereas the water-restricted rats were given only 4 mL/100 g body weight of water per day (average 14–18 mL). All animals received free access to food throughout the study. Body weights and water intake volumes of each animal were measured and recorded daily throughout the experiment. Daily water intake was determined through the weight difference of water bottle every 24 hours. An empty cage with a water bottle was used to measure water loss due to evaporation. Daily water intake = initial weight (bottle + water) − 24 hours weight (bottle + water) − water evaporation during a 24 hour period.
Euthanasia and Tissue Collection
At the end of the experimental period, all animals were humanely euthanized via CO2 inhalation, and the larynges were removed rapidly. The vocal folds used for gene and protein analyses were harvested through microdissection, flash-frozen in liquid nitrogen, and then stored at −80°C until analyzed. The larynges used for histochemical staining were harvested and stored in 10% neutral buffered formalin. Kidneys were excised, and the cortex was obtained, flash-frozen in liquid nitrogen, and then stored at −80°C until analyzed for renin (Ren) levels as described below.
Gene Expression Level Analysis
Total RNA was extracted from collected vocal folds (N = 5/group) and kidneys (N = 8/group) using RNeasy Fibrous Tissue Mini Kit (QIAGEN, Hilden, Germany) and RNeasy Plus Mini Kit (QIAGEN), respectively, according to the manufacturer’s protocol. RNA concentrations were measured using spectrophotometry (NanoDrop, Thermo Fisher Scientific, Waltham, MA), and nucleic acid purity was verified by checking the A260:A280 ratio. RNA (400 ng) was then reverse transcribed into cDNA using the iScript cDNA synthesis kit (Bio-Rad, Hercules, CA). The qPCR was performed using a CFX96 real-time thermal cycler (Bio-Rad) with a program of 3 minutes at 95°C for enzyme activation, followed by 40 cycles with 10 seconds denaturing at 95°C and 30 seconds from 54°C to 57°C (depending on the primer pair) for annealing and extension. Each of the qPCR samples were run in triplicate using the SsoAdvanced Universal SYBR Green Super-mix (Bio-Rad). The presence of single amplicons was validated by performing a melt-curve analysis. Target genes were normalized to the housekeeping gene β-actin. Fold change in gene expression was calculated by determining ΔΔCq values. The relative expression of target genes in dehydration group compared to control group was calculated by setting the control group as 100%. The forward and reverse primers for genes tested in qPCR were designed using Primer-BLAST (National Institutes of Health)22 and were selected to be specific for each target mRNA. The sequence of each primer is listed in Table I.
Table I.
Primers for the Quantitative Polymerase Chain Reaction Analysis.
| Tested Tissue | Gene | Accession | Forward Sequence | Reverse Sequence | Product Length |
|---|---|---|---|---|---|
| Vocal fold | β-actin | NM_031144.3 | GGCACCACACTTTCTACAATGA | CATGATCTGGGTCATCTTTTCA | 113 bp |
| Vocal fold | Has2 | NM_013153.1 | CCAATGCAGTTTCGGTGATG | ACTTGGACCGAGCCGTGTAT | 86 bp |
| Vocal fold | Hyal1 | NM_207616.1 | TGACCAGCTAGGGTGGTTGT | TAAAGCCAAACGGAACGCCT | 136 bp |
| Vocal fold | Hyal2 | NM_172040.2 | CGTTACGTCAAGGCAGTCAG | AGGTACACGGAGGGAAAGAG | 188 bp |
| Vocal fold | IL 1α | NM_017019.1 | TCCTTAAATCCTCTGAGCTTGC | ACAGATTGGTGATCATGACTGC | 178 bp |
| Vocal fold | IL 1β | NM_031512.2 | AGTGTGGATCCCAAACAATACC | AACTGTGCAGACTCAAACTCCA | 101 bp |
| Vocal fold | DSG1 | XM_017601072.1 | TGTAGCTGAATTCCACCAGTCA | GAGCCCTCGACGACATTCAA | 90 bp |
| Vocal fold | PRG4 | NM_001105962.3 | CTACAACAGCTTCTGCGAAGAA | GATTTGGGTGAACGTTTGGTGG | 117 bp |
| Vocal fold | CD44 | NM_012924.2 | AGCCTTGATGACTACCCCTG | CGTACCAGGCATCTTCGTTG | 124 bp |
| Kidney | Ren | NM_012642.4 | GATCAGGGAAGGTCAAAGGT | AGACAGGGATGACTCCATCA | 180 bp |
| Kidney | β-actin | NM_031144.3 | CACACTGTGCCCATCTATGA | CCGATAGTGATGACCTGACC | 272 bp |
Protein Expression Level Analysis
Vocal folds (N = 3/group) were lysed and homogenized using the T-PER Tissue Protein Extraction Reagent (Thermo Fisher Scientific). The concentration of protein was determined using the Pierce 660 nm Protein Assay Reagent (Thermo Fisher Scientific). Protein samples were mixed with 4x Laemmli Sample Buffer (Bio-Rad) and denatured by incubation at 70°C for 10 minutes. Lysates (30 μg/lane) were separated by Mini-Protean TGX Gels (Bio-Rad) and transferred by Trans-Blot Turbo Transfer Pack (Bio-Rad). After transfer, polyvinylidene fluoride membranes were blocked in Pierce TBS [tris-buffered saline] Blocking Buffer (Thermo Fisher Scientific) for 1 hour at room temperature. For Hyal2 protein detection, membranes were then incubated with primary anti-HYAL2 antibody (1:500, Abcam, ab68608, Cambridge, UK) and GAPDH (glyceraldehyde-3-phosphate dehydrogenase) antibody (1:1,000, Invitrogen, AM4300, Carlsbad, CA) diluted in a 1:1 TBST (0.05%Tween20 in Tris-buffered saline):blocking buffer diluent at 4°C overnight on rocker. After a brief wash with TBST, membranes were incubated with the secondary goat anti-mouse IRDye 680RD and goat anti-rabbit IRDye 800CW (1:5,000, LI-COR, Lincoln, NE) diluted in a 1:1 TBST:blocking buffer diluent for 2 hours at room temperature. The membranes were then washed with TBST and TBS (tris-buffered saline). Membranes were exposed at NIR channel using Azure c600 imaging system (Azure Bio-systems, Dublin, CA). For DSG1 protein detection, membranes were then incubated with primary anti-DSG1 antibody (1:500, Abcam, ab124798) and GAPDH antibody (1:1,000, Invitrogen, AM4300) diluted in a 1:1 TBST:blocking buffer diluent at 4°C overnight on rocker. After a brief wash with TBST, membranes were incubated with the HRP-conjugated secondary antibodies goat anti-mouse HRP (Invitrogen, #31430) and goat anti-rabbit HRP (Invitrogen, #31460) at 1:10,000 dilution ratio diluted in a 1:1 TBST:blocking buffer diluent for 1 hour at room temperature. The membranes were then washed with TBST and TBS. SuperSignal West Pico PLUS Chemiluminescent Substrate (Thermo Fisher Scientific) was used for membrane immuno-blots, which was then visualized and imaged using Azure c600 (Azure Bio-systems). Image Studio Lite (version 5.2 Li-Cor Software, Lincoln, Nebraska) was used to quantify differences in intensity of western blot bands. The relative amount of target proteins was normalized to GAPDH.
Histology
Larynges (N = 5/group) were fixed in 10% neutral buffered formalin, dehydrated, and embedded in paraffin. Larynges were prepared for histological staining with alcian blue (pH 2.5) according to standard procedures. All microscopic slides underwent histological evaluation by a veterinary pathologist who was blinded to treatment conditions (i.e., control vs. water-restricted).
Hyaluronan Quantification
HA was quantified following published procedures.9 Briefly, collected vocal folds (N = 5/group) were serially sectioned, stained with alcian blue and nuclear fast red, and then underwent 0.5 mg/mL hyaluronidase incubation (MilliporeSigma, St. Louis, MO). Alcian blue stains glycosaminoglycans such as HA, and hyaluronidase incubation removes HA from the lamina propria.23 Each alcian blue-stained slide was digitized using a Leica Bio-systems Aperio Versa Scanner (Aperio Technologies, Vista, CA). Aperio ImageScope software (v12.3.2.8013) Color Deconvolution v9 algorithm was optimized for specific staining in our histology laboratory. The Color Deconvolution macro detected positive blue stain within the midmembranous true vocal fold and was normalized to the area analyzed. Thus, HA in vocal fold was quantified by determining the difference in positive alcian blue stain in pre- and posthyaluronidase-treated slides. Euhydrated rat vocal folds were used as control slides in HA quantification analysis.
Statistical Analysis
All statistical analyses were completed with GraphPad Prism software (version 8.3.0 GraphPad Software, Inc., San Diego, CA). Significance was set at P ≤ .05 for all statistical analyses. Analysis of variance tests were used to compare water consumption for each rat between baseline period and experimental period in both groups. HA quantity, gene, and protein expression levels between water-restricted group and control group were compared using Mann–Whitney U tests because raw data did not meet assumptions of normality. Outliers were identified by ROUT (robust regression and outlier removal) method preset in GraphPad Prism (version 8.3.0, GraphPad Software, Inc.) setting Q = 1%.
RESULTS
Water consumption in control and water-restricted rats
During the baseline period, no significant differences in water consumption were found between the control and water-restricted groups (P = .3342). For the control group, no significant differences (P = .0724) in water consumption were found between baseline and experimental periods. After the water restriction protocol concluded, there were significant differences (P < .01) between baseline and experimental period water consumption in the water-restricted group. Figure 1A summarizes water intake volumes of the control and water-restricted groups during the baseline and experimental periods (N = 8/group).
Fig. 1.
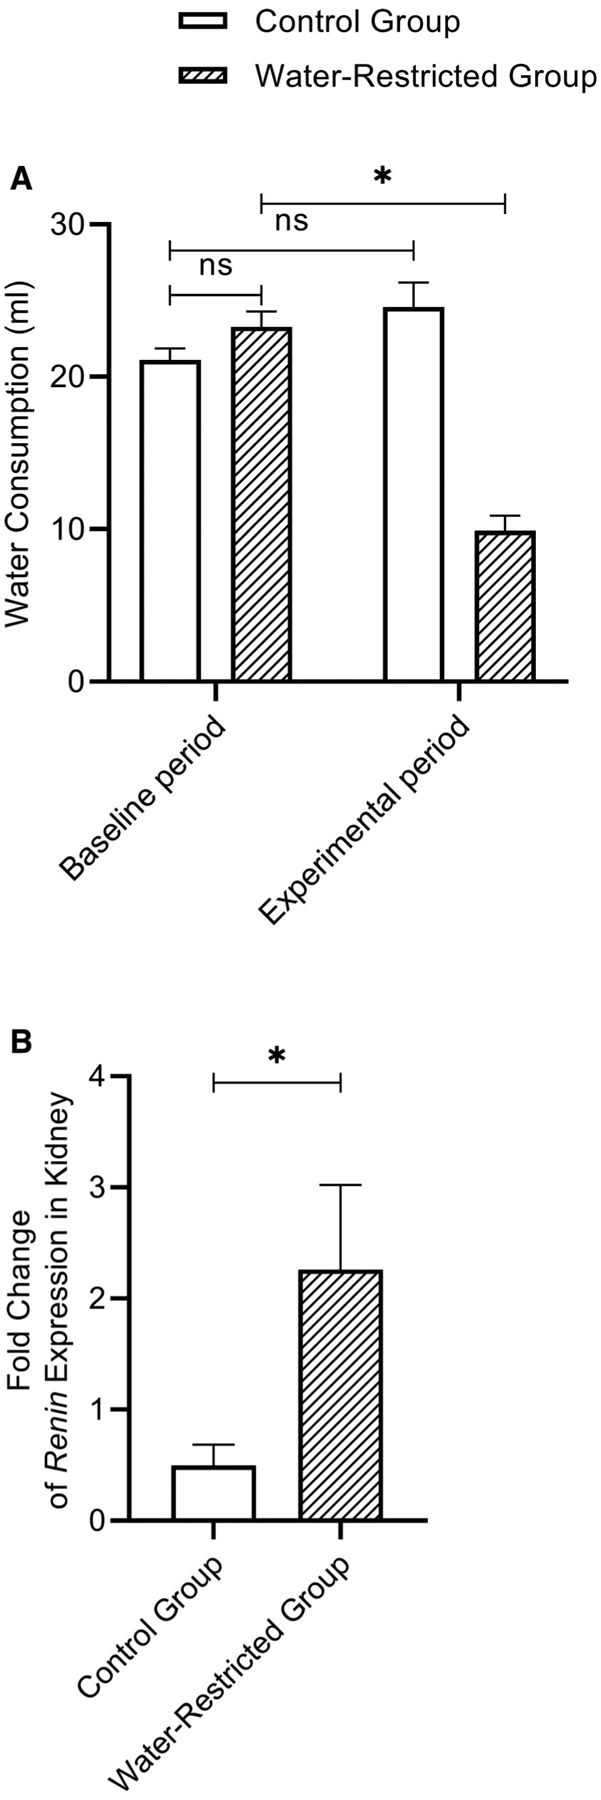
(A) Bar graph (Mean, SEM) of the average water consumption in control and water-restricted groups during baseline and experimental period (N = 8/group). *P ≤ .05. (B) Bar graph (Mean, SEM) of the fold change for Ren gene expression in kidneys between control (N = 7) and water-restricted group (N = 8). *P ≤ .05. SEM = standard error of the mean.
Renin expression level in kidneys
The expression of Ren mRNA in the kidney of water-restricted rats was significantly increased (P = 0.0401) compared to control rats, consistent with previously published work.9 Figure 1B shows the fold change of Ren expression level in kidneys between control (N = 7) and water-restricted group (N = 8); one outlier was identified and removed from control group.
Gene expression level in vocal fold
There were statistically significant changes (P = .0079) in the gene expression levels of Hyal2, IL-1α, and DSG1. Dehydration induced by restricted water access downregulated the expression of DSG1 and IL-1α, whereas the expression level of Hyal2 increased when compared to the control group. There were no significant differences observed in the gene expression levels of Hyal1, Has2, PRG4, and CD44. However, IL-1β showed a trend for decrease in the water-restricted group. Figure 2 shows the fold change of investigated genes between control and water-restricted group (N = 5/group).
Fig. 2.
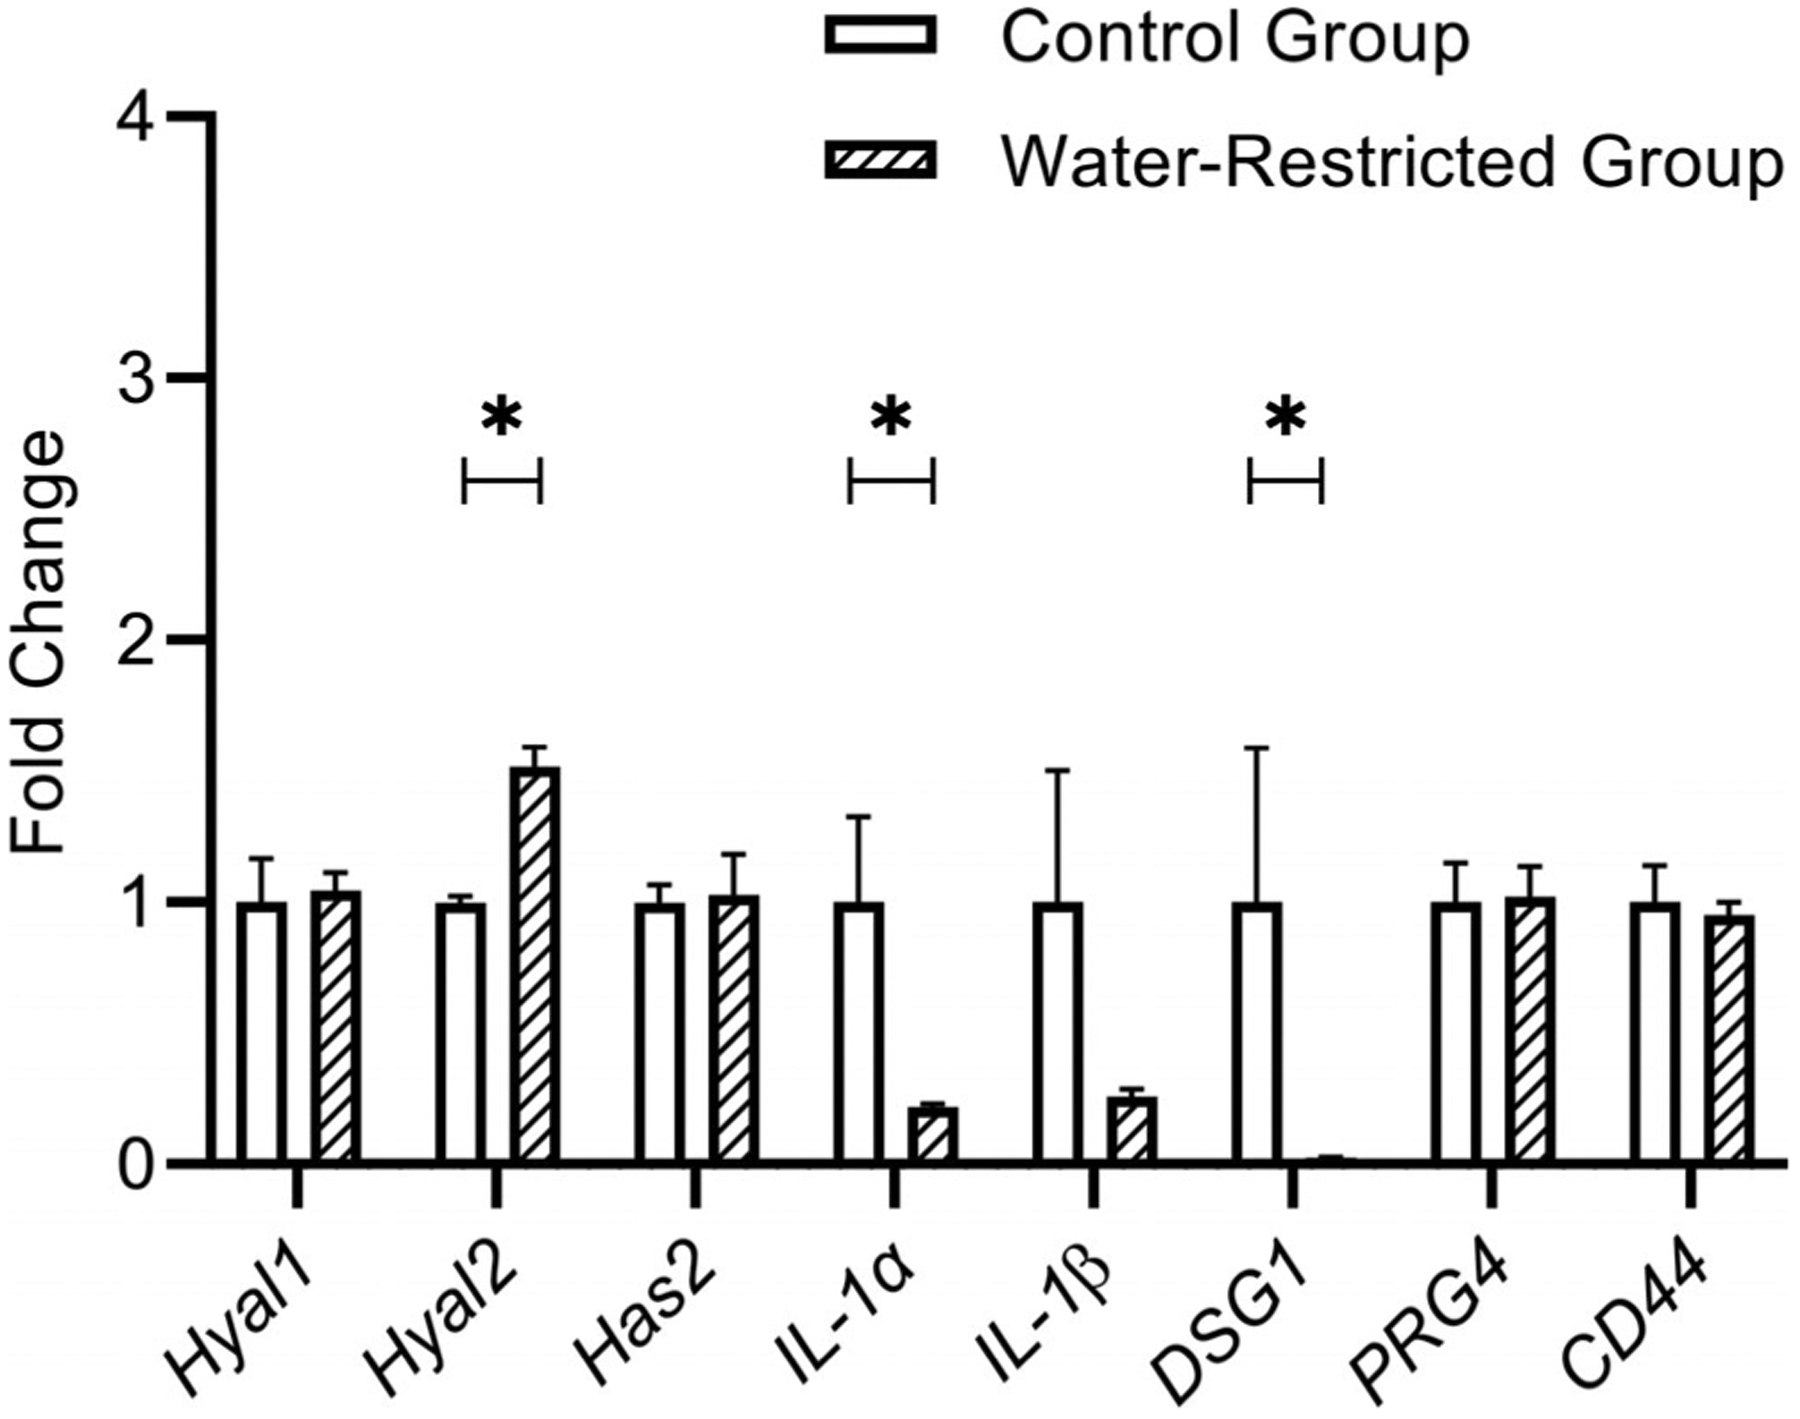
Bar graph (Mean, SEM) of the fold change for each target gene in vocal fold tissue between control and water-restricted group (N = 5/group). Water restriction significantly decreased the expression level of IL-1α and DSG1 and increased the expression level of Hyal2 in rat vocal fold tissue. *P ≤ .05. Hyal2 = hyaluronidase-2; SEM = standard error of the mean.
Protein expression level in vocal fold
There was a statistically significant change (P = .05) in the protein level of DSG1. Dehydration induced by restricted water access downregulated the amount of DSG1. There was no significant difference observed in the protein level of Hyal2. Figure 3A (representative blots) and Figure 3B show DSG1 and Hyal2 protein level in vocal folds between control and water-restricted group (N = 3/group).
Fig. 3.
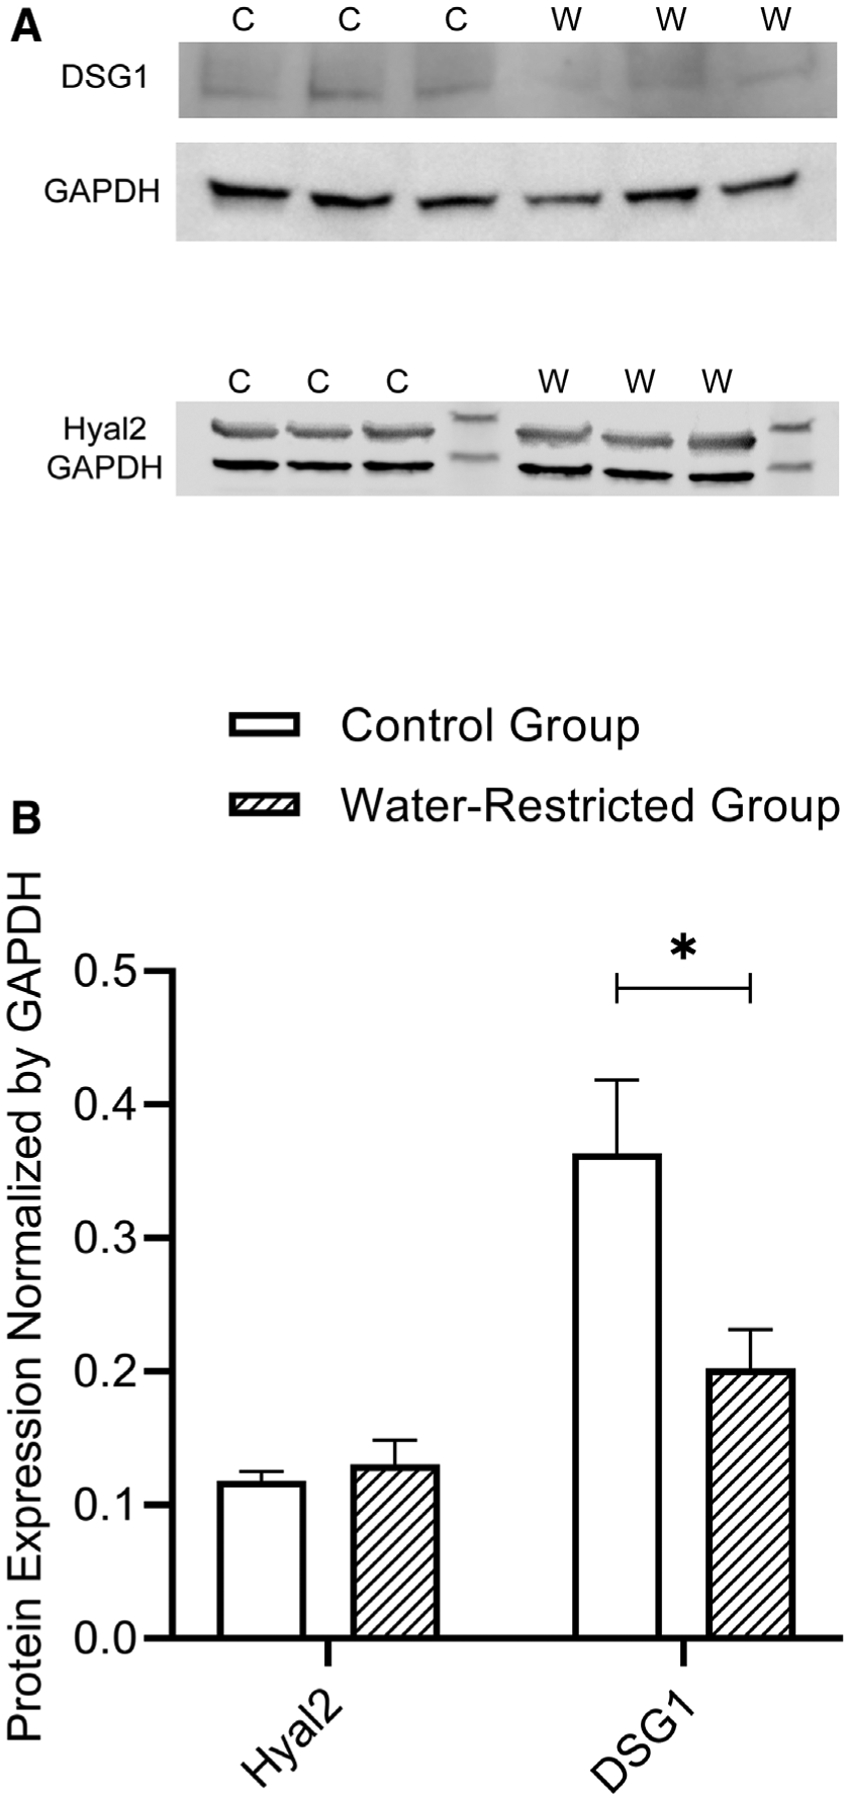
(A) Representative image showing the western blot of each protein in vocal fold tissue between control and water-restricted group (N = 3/group). Control group = C; Water-restricted group = W. (B) Bar graph (Mean, SEM) of the amount of each protein in vocal fold tissue between control and water-restricted group (N = 3/group). Water restriction method significantly decreased the protein level of DSG1. *P ≤ .05. DSG1 = desmoglein-1; SEM = standard error of the mean.
Hyaluronan quantity in vocal fold
HA quantification was based on analysis of digitized images of alcian blue (pH 2.5)-stained slides pre- and posthyaluronidase incubation. Alcian blue stains glycosaminoglycans with a blue color. After treating sections with the enzyme hyaluronidase, which removes the HA from the tissue specimen, the difference between the blue intensity of pre- and posthyaluronidase stains should reflect the HA present in the tissue sections. The quantity of HA in the vocal fold was significantly lower (P = .0317) in water-restricted rats compared to control rats. Figure 4 shows the percent change in HA based on alcian blue staining pre- and posthyaluronidase incubation between control and water-restricted group (N = 5/group).
Fig. 4.

Bar graph (Mean, SEM) of the average percent change in HA content in vocal fold tissue between control and water-restricted group. *P ≤ .05. HA = hyaluronan; SEM = standard error of the mean.
DISCUSSION
This study investigated the biological changes in vocal fold tissue from a 5-day experimental, physiologically realistic perturbation induced by restricting water to induce systemic dehydration. The methodology used to induce systemic dehydration in this study was novel; we chose to restrict water rather than withhold water (as accomplished in prior studies5,6) because water restriction is clinically translatable to humans. We established a simple and effective water restriction in vivo method based on animal body weight and average daily water intake, which can be easily translated to human subjects. To the best of our knowledge, this is the first study investigating the effects of restricted water intake on vocal fold pathobiology in an in vivo model.
We first confirmed that restricted water intake induced a mild-to-moderate systemic dehydration. The average body weight loss of water restricted rats in this study was 3.35% ± 1.43%, whereas control rats did not show body weight loss during the course of the study. Based on previous work,6 the level of dehydration observed in this study is considered mild to moderate. A previous study from our group revealed an average body weight loss of 11.4% (range of 8%–13%) after 72 hours of water deprivation,9 which is considered moderate to marked dehydration. Renin (Ren) gene expression level in kidney increased after 5-day water restriction compared to control group, indicating that systemic dehydration occurred. Renin is mainly produced and secreted by the juxtaglomerular cells in the kidney24 and is elevated by twofold change in dehydration.9 Here, we also observed a twofold change in renin in our water restriction model corroborating systemic dehydration. The use of this bio-marker to validate that dehydration occurred overcomes some of the challenges of using body weight loss as the gold standard of dehydration because body weight loss may be influenced by reduced food intake.
A decrease in HA in the water-restricted rat vocal fold was identified compared to control group. HA is a major component of the ECM and is responsible for lubrication and viscoelasticity in vocal fold lamina propria25 and contributes to optimal vocal fold vibration and prevents the tissue from oscillatory trauma during voice production.8 Several studies have also emphasized that HA has unique hygroscopic, rheological, and viscoelastic properties in different type of organs and tissues.7,26 For example, the stiffness of fresh bovine cartilage increases after enzymatically removing HA.27 HA chains interact with each other to form a hydrogen bond network, which can trap water28 and resist the flow of water through connective tissue.29 HA is catabolized principally by Hyal1 and Hyal2.30 Hyal2 is responsible for hydrolyzing high-molecular-weight HA polymers and has been detected in many tissues.31 Increased Hyal2 gene expression level was observed in water-restricted group. No significant difference was found in Hyal2 protein level between control and water-restricted groups in this study. It is possible that Hyal2 protein level increased during an early period, exerting its biological activity and then returned to normal. In the water-restricted group, increased Hyal2 may have contributed to a decrease in HA and a disruption of the hydrogen bond network, leading to the diffusion of water into the vocal fold in an attempt to maintain hydration homeostasis. Similar decreases in hyaluronan have been observed in the renal medulla of dehydrated rats.32
Decreased IL-1α gene expression level in water-restricted rats was observed. A trend for decrease in IL-1β was also found in water-restricted group. Stress follows a disruption in homeostasis.33 Dehydration can be considered as a stress. Plasma cortisol concentration increased during dehydration in human subjects.34 Increased cortisol was also found simultaneously with increased IL-1 inhibitors after surgery.35 It is possible that decreased IL-1α and IL-1β were caused by increased cortisol concentration and IL-1 inhibitors during water restriction period. This preliminary hypothesis should be investigated further. IL-1α and IL-1β also have an important role in preventing the host from injury or damage, functioning as an “alarmin” in healthy tissues.36 Decreased IL-1α and IL-1β in water-restricted rats may indicate that continued reduced daily water intake makes vocal folds more vulnerable, losing the alarmin function, and increasing susceptibility to phonotrauma.
A decrease of DSG1 in the vocal folds of the water-restricted group was identified compared to the control group in both gene and protein expression level (P ≤ .05). Desmoglein proteins, encoded by the DSG1–4 genes, are transmembrane glycoproteins that form desmosomes. Desmosomes are associated with maintaining tissue integrity and resisting mechanical forces, especially in those tissues that are exposed to intense mechanical stress.15 Recent work demonstrates that ultraviolet light induced changes in the mechanical properties of human stratum corneum disrupt the presence and location of DSG1,37 suggesting an important role of DSG1 in contributing to tissue stiffness. A previous study demonstrated that appropriate tissue hydration was a key factor contributing to optimal mechanical properties.1 Reductions in water content resulted in increased vocal fold tissue stiffness and viscosity.38 Decreased DSG1 expression level in water-restricted rats in this study may lead to a loss of tissue mechanical integrity, which could be the primary cause of the changes in mechanical properties during hydration challenge.
Planned extensions of this project include proteomics to study dynamic protein turn over at several different time points during the water restriction period and following rehydration. Additionally, research is needed to relate HA changes in vocal fold tissue with changes in tissue mechanical properties. Another aspect of this programmatic line of research will investigate the interaction of systemic dehydration with vocal fold wound healing. Because the methodology to induce systemic dehydration is so easily translatable to human subjects, future investigations should explore the effect of water restriction on voice measures to fully relate underlying biological tissue changes to functional voice parameters.
CONCLUSION
This novel study quantified the effects of restricted water intake on vocal fold biology in an in vivo animal model. Our results provide evidence that reduced daily water intake for just 5 days impairs the biology of vocal fold through 1) disturbing the HA network, with potential down-stream effects on tissue viscoelasticity; 2) decreasing IL-1α release, leading to an increased risk of tissue damage; and 3) reducing plasma membrane integrity by disrupting desmosomes making the tissue more vulnerable to mechanical damage. These data lay the foundation for further study on the interaction of dehydration with vocal fold injury to inform prophylactic recommendations for vocal care.
ACKNOWLEDGMENT
The study was funded by the National Institutes of Health (NIH)/the National Institute on Deafness and other Communication Disorders (NIDCD) grant R01DC015545.
Supported by the National Institutes of Health (NIH)/the National Institute on Deafness and Other Communication Disorders (NIDCD) grant R01DC0115545.The authors have no other funding, financial relationships, or conflicts of interest to disclose.
BIBLIOGRAPHY
- 1.Chan RW, Tayama N. Biomechanical effects of hydration in vocal fold tissues. Otolaryngol Head Neck Surg 2002;126:528–537. [DOI] [PubMed] [Google Scholar]
- 2.Leydon C, Sivasankar M, Falciglia DL, Atkins C, Fisher KV. Vocal fold surface hydration: a review. J Voice 2010;23:658–665. [DOI] [PMC free article] [PubMed] [Google Scholar]
- 3.Sataloff RT. Professional Voice: The Science and Art of Clinical Care. 1st ed.Philadelphia, PA: Raven Press; 1991:179–183. [Google Scholar]
- 4.King RE, Steed K, Rivera AE, Wisco JJ, Thibeault ST. Magnetic resonance imaging quantification of dehydration and rehydration in vocal fold tissue layers. PLoS One 2018;13:e0208763. [DOI] [PMC free article] [PubMed] [Google Scholar]
- 5.Oleson S, Lu K, Liu Z, et al. Proton density weighted laryngeal MRI in systemically dehydrated rats. Laryngoscope 2019;128:E222–E227. [DOI] [PMC free article] [PubMed] [Google Scholar]
- 6.Oleson S, Cox A, Liu Z, Sivasankar MP, Lu K-H. In vivo magnetic resonance imaging of the rat vocal folds after systemic dehydration and rehydration. J Speech Lang Hear Res 2020;63:135–142. [DOI] [PMC free article] [PubMed] [Google Scholar]
- 7.Chan RW, Gray SD, Titze IR. The importance of hyaluronic acid in vocal fold biomechanics. Otolaryngol Head Neck Surg 2001;124:607–614. [DOI] [PubMed] [Google Scholar]
- 8.Gaston J, Thibeault SL. Hyaluronic acid hydrogels for vocal fold wound healing. Biomatter 2013;3:e23799. [DOI] [PMC free article] [PubMed] [Google Scholar]
- 9.Cox A, Do Nascimento N, Dos Santos A, Sivasankar MP. Dehydration and estrous staging in the rat larynx: an in vivo prospective investigation. J Voice 2019. 10.1016/j.jvoice.2019.06.009. [DOI] [PMC free article] [PubMed] [Google Scholar]
- 10.Entwistle J, Hall CL, Turley EA. HA receptors: regulators of signalling to the cytoskeleton. J Cell Biochem 1996;61:569–577. [DOI] [PubMed] [Google Scholar]
- 11.Hanson SE, Kim J, Quinchia Johnson BH, et al. Characterization of mesen-chymal stem cells from human vocal fold fibroblasts. Laryngoscope 2010; 120:546–551. [DOI] [PMC free article] [PubMed] [Google Scholar]
- 12.Ward PD, Thibeault SL, Gray SD. Hyaluronic acid: its role in voice. J Voice 2002;16:303–309. [DOI] [PubMed] [Google Scholar]
- 13.Kobler JB, Tynan MA, Zeitels SM, et al. Lubricin/proteoglycan 4 detected in vocal folds of humans and five other mammals. Laryngoscope 2019;129: E229–E237. [DOI] [PubMed] [Google Scholar]
- 14.Dinarello CA. Overview of the IL-1 family in innate inflammation and acquired immunity. Immunol Rev 2018;281:8–27. [DOI] [PMC free article] [PubMed] [Google Scholar]
- 15.Lewis JD, Caldara AL, Zimmer SE, et al. The desmosome is a mesoscale lipid raft–like membrane domain. Mol Biol Cell 2019;30:1390–1405. [DOI] [PMC free article] [PubMed] [Google Scholar]
- 16.Delmar M, McKenna WJ. The cardiac desmosome and arrhythmogenic cardiomyopathies: from gene to disease. Circ Res 2010;107:700–714. [DOI] [PubMed] [Google Scholar]
- 17.Hsu CK, Lin HH, Harn HIC, Hughes MW, Tang MJ, Yang CC. Mechanical forces in skin disorders. J Dermatol Sci 2018;90:232–240. [DOI] [PubMed] [Google Scholar]
- 18.Ayache S, Ouaknine M, Dejonkere P, Prindere P, Giovanni A. Experimental study of the effects of surface mucus viscosity on the glottic cycle. J Voice 2004;18:107–115. [DOI] [PubMed] [Google Scholar]
- 19.Jiang JJ. Effects of dehydration on phonation in excised canine larynges. Ann Otol Rhinol Laryngol 2000;109:568–575. [DOI] [PubMed] [Google Scholar]
- 20.Jiang J, Ng J, Hanson D. The effects of rehydration on phonation in excised canine larynges. J Voice 1999;13:51–59. [DOI] [PubMed] [Google Scholar]
- 21.McGivern RF, Henschel D, Hutcheson M, Pangburn T. Sex difference in daily water consumption of rats: effect of housing and hormones. Physiol Behav 1996;59:653–658. [DOI] [PubMed] [Google Scholar]
- 22.Ye J, Coulouris G, Zaretskaya I, Cutcutache I, Rozen S, Madden TL. Primer-BLAST: a tool to design target-specific primers for polymerase chain reaction. BMC Bioinformatics 2012;13:134. [DOI] [PMC free article] [PubMed] [Google Scholar]
- 23.Gray SD, Titze IR, Chan R, Hammond TH. Vocal fold proteoglycans and their influence on biomechanics. Laryngoscope 1999;109:845–854. [DOI] [PubMed] [Google Scholar]
- 24.Persson PB. Renin: origin, secretion and synthesis. J Physiol 2003;552: 667–671. [DOI] [PMC free article] [PubMed] [Google Scholar]
- 25.Hahn MS, Jao CY, Faquin W, Grande-allen KJ. Glycosaminoglycan composition of the vocal fold lamina propria in relation to function. Ann Otol Rhinol Laryngol 2008;117:371–381. [DOI] [PubMed] [Google Scholar]
- 26.Chen WYJ, Abatangelo G. Functions of hyaluronan in wound repair. Wound Repair Regen 1999;7:79–89. [DOI] [PubMed] [Google Scholar]
- 27.Xu X, Li Z, Cai L, Calve S, Neu CP. Mapping the nonreciprocal micro-mechanics of individual cells and the surrounding matrix within living tissues. Sci Rep 2016;6:24272. [DOI] [PMC free article] [PubMed] [Google Scholar]
- 28.Chabrec P. Hyaluronan: preparation, structure, properties, and applications. Chem Rev 1998;98:2663–2684. [DOI] [PubMed] [Google Scholar]
- 29.Comper WD, Laurent TC. Physiological function of connective tissue poly-saccharides. Physiol Rev 1978;58:255–315. [DOI] [PubMed] [Google Scholar]
- 30.Csoka AB, Frost GI, Stern R. The six hyaluronidase-like genes in the human and mouse genomes. Matrix Biol 2001;20:499–508. [DOI] [PubMed] [Google Scholar]
- 31.Lepperdinger U, Mullegger J. Hyal2–less active, but more versatile? Matrix Biol 2001;20:509–514. [DOI] [PubMed] [Google Scholar]
- 32.Göransson V, Johnsson C, Nylander O, Hansell P. Renomedullary and intestinal hyaluronan content during body water excess: a study in rats and gerbils. J Physiol 2002;542:315–322. [DOI] [PMC free article] [PubMed] [Google Scholar]
- 33.Krause EG, de Kloet AD, Flak JN, et al. Hydration state controls stress responsiveness and social behaviors. J Neurosci 2011;31: 5470–5476. [DOI] [PMC free article] [PubMed] [Google Scholar]
- 34.Taylor PJ, van Rosendal SP, Coombes JS, Gordon RD, Stowasser M. Simultaneous measurement of aldosterone and cortisol by high-performance liquid chromatography-tandem mass spectrometry: application to dehydration-rehydration studies. J Chromatogr B Analyt Technol Biomed Life Sci 2010;878:1195–1198. [DOI] [PubMed] [Google Scholar]
- 35.Di Padova F, Pozzi C, Tondre MJ, Tritapepe R. Selective and early increase of IL-1 inhibitors, IL-6 and cortisol after elective surgery. Clin Exp Immunol 1991;85:137–142. [DOI] [PMC free article] [PubMed] [Google Scholar]
- 36.Paolo NCD, Shayakhmetov DM, Disorders I. Interleukin 1α and the inflammatory process. Nat Immunol 2017;17:906–913. [DOI] [PMC free article] [PubMed] [Google Scholar]
- 37.Lipsky ZW, German GK. Ultraviolet light degrades the mechanical and structural properties of human stratum corneum. J Mech Behav Biomed Mater 2019;100:103391. [DOI] [PubMed] [Google Scholar]
- 38.Yang S, Zhang Y, Mills RD, Jiang JJ. Quantitative study of the effects of dehydration on the viscoelastic parameters in the vocal fold mucosa. J Voice 2017;31:269–274. [DOI] [PubMed] [Google Scholar]