Abstract
During radiation therapy (RT) of head and neck cancer, the shape and volume of the parotid glands (PG) may change significantly, resulting in clinically relevant deviations of delivered dose from the planning dose. Early and accurate longitudinal prediction of PG anatomical changes during the RT can be valuable to inform decisions on plan adaptation. We developed a deep neural network for longitudinal predictions using the displacement fields (DFs) between the planning computed tomography (pCT) and weekly cone beam computed tomography (CBCT).
Sixty-three HN patients treated with volumetric modulated arc were retrospectively studied. We calculated DFs between pCT and week 1-3 CBCT by B-spline and Demon deformable image registration (DIR). The resultant DFs were subsequently used as input to our novel network to predict the week 4 to 6 DFs for generating predicted weekly PG contours and weekly dose distributions. For evaluation, we measured dice similarity (DICE), and the uncertainty of accumulated dose. Moreover, we compared the detection accuracies of candidates for adaptive radiotherapy (ART) when the trigger criteria were mean dose difference more than 10%, 7.5%, and 5%, respectively.
The DICE of ipsilateral/contralateral PG at week 4 to 6 using the prediction model trained with B-spline were 0.81±0.07/0.81±0.04 (week 4), 0.79±0.06/0.81±0.05 (week 5) and 0.78±0.06/0.82±0.02 (week 6). The DICE with the Demons model were 0.78±0.08/0.82±0.03 (week 4), 0.77±0.07/0.82±0.04 (week 5) and 0.75±0.07/0.82±0.02 (week 6). The dose volume histogram (DVH) analysis with the predicted accumulated dose showed the feasibility of predicting dose uncertainty due to the PG anatomical changes. The AUC of ART candidate detection with our predictive model was over 0.90.
In conclusion, the proposed network was able to predict future anatomical changes and dose uncertainty of PGs with clinically acceptable accuracy, and hence can be readily integrated into the ART workflow.
Keywords: Parotid gland, Displacement field, Adaptive radiotherapy
1. Introduction
Radiation therapy (RT) plays a critical role in the current treatment of patients with head and neck (HN) cancer. It requires delivering high tumoricidal dose to target structures while minimizing the dose to adjacent critical organs [1–4]. Over the past decade, intensity-modulated radiotherapy (IMRT) has become a standard-of-care for HN cancer treatment due to its ability to create a highly conformal dose distribution on the tumor [3]. One noticeable aspect of HN radiation therapy is that significant anatomical changes occur in tumors and normal tissues during the course of treatment [5–8]. These changes include shrinkage of the tumor and normal tissue volumes along with the geometrical shift of some organs. Especially, the parotid gland (PG), which is extremely sensitive to radiation, shows significant volume shrinkage due to patient weight loss [8–10]. For example, Ricchetti et al [11] concluded that among the organs-at-risk (OARs) that underwent volume shrinkage during the RT of HN cancer, the magnitude of change of the PGs may have implications for daily dose distribution and early monitoring. Similarly, Nishimaru et al [12] reported that the volume of the PGs decreased by 30 (p<0.001) in the third week of IMRT. For this reason, there is clinical uncertainty that the treatment plan created on the initial planning CT (pCT) may not be optimal for changing anatomy during the course of RT [9, 13–14]. This longitudinal anatomical change should be taken into account since the radiation dose delivered to the patient may be significantly different from that of the planning dose. [9] In this paper, based on the hypothesis that anatomical changes in the PG during the RT would follow a specific spatial and temporal pattern, we investigated the feasibility of anatomical prediction of PG at a later time point through longitudinal pattern analysis of deformation between weekly CBCT and pCT images [15–16]. Adaptive radiotherapy (ART) may potentially benefit from the timely prediction because the earlier these changes can be determined, the sooner the replanning can be taken, ideally achieving a better therapeutic ratio [16–19].
Longitudinal image frame prediction by recurrent neural networks (RNN) has attracted great interest in the field of medical image analysis as well as computer vision [20–22]. For example, Wang et al., and Zhang et al, developed deep learning models, which combine RNN and convolution neural network (CNN) for predicting longitudinal lung tumor anatomical changes [15–16]. These studies were conducted using only the region-of-interest images by extracting lung tumors from 2D slice images. Specifically, Wang et al used a method to flatten features extracted from CNNs and forwarded these to the 1D-gated recurrent unit (GRU), whereas Zhang et al used 2D Convolution-LSTM for longitudinal analysis [15–16].
Rather than predicting future 2D images (possibly noisy/artifact-ridden) as was done in the previous works, we predict future 3D displacement field (DF) which can easily help in dose accumulation and contour propagation. We think reasonable ground-truth DFs (validated on the dice overlap of the propagated and manual contours), that record the movements of image voxels are a more suitable representation to analyze longitudinal deformations than just the images. In this paper, we used an encoder-decoder framework [24–26] with 3D convolution GRUs [23] for supervised training and prediction of 3D DFs.
2. Materials & Methods
2.1. HN cancer imaging dataset
Sixty-three HN cancer patients treated with volumetric modulated arc therapy (VMAT) of 70Gy in 35 fractions were retrospectively studied. All the patient data was anonymized. Each patient dataset contained the pCT, planning contours, and the weekly cone beam Computed Tomography (CBCTs). Among the 63 patients, 43 had up to week 5 and 33 had up to week 6 CBCTs. We used 10 patients data containing up to week 6 CBCTs as the testing set and the rest of the data was used for training. During the training, the training set was split into 5-folds and 5-folds cross-validation was conducted to decide the model. After training the model with the training dataset, we predicted test data’s week 4 to 6 DFs by feed forwarding the patient’s week 1 to 3 DFs. Since we used DF representation, we resampled the voxel sizes to make sure all the datasets had identical spatial information. To focus on the head and neck region and improve the effectiveness of deep learning training, we cropped the images to mask out the background and cropped the images to exclude irrelevant regions.
2.2. Deformable image registration
To train the longitudinal deformation prediction network using DFs, we computed DFs between week 1-6 CBCT (moving) and the pCT (fixed) using multi-resolution B-spline and Demon deformable image registration (DIR) algorithms available in Plastimatch, an open-source image registration software [27]. For deciding the hyperparameters of DIR algorithms, we choose the hyperparameters from preset values and validated the DIR accuracy with normalized cross-correlation (NCC) and DICE overlays of propagated contours from 3 patient cases. Table 1 shows the NCC and DICE obtained from the preset hyperparameters. The selected optimal hyperparameters for both B-spline and Demon were able to get relatively high scores above 0.96 and 0.88 in both NCC and DICE respectively.
Table 1.
Hyperparameter for generating DFs by B-spline and Demon
| B-spline | Demon | ||||||
|---|---|---|---|---|---|---|---|
| Grid size | Regularization | NCC | DICE | Sub-sampling | Kernel size | NCC | DICE |
|
| |||||||
| 32/16/8 | 0.005/0.05/0.5 | 0.97 | 0.90 | 2 | 3 | 0.96 | 0.89 |
| 28/14/7 | 0.005/0.05/0.5 | 0.96 | 0.89 | 2 | 4 | 0.96 | 0.88 |
| 36/18/9 | 0.004/0.04/0.4 | 0.97 | 0.89 | 3 | 4 | 0.96 | 0.88 |
2.3. Deep learning model
Figure 1 illustrates our proposed model in detail. The Encoder consists of three 3D convolutional layers and 9 residual blocks; the Decoder includes three 3D deconvolution layers; and the recurrent block contains 3D convolutional gated recurrent units (Conv-GRU). The role of CNNs is to extract features of weekly volumetric DFs using the convolutional encoder and to restore the predicted DF using the convolutional decoder. The RNNs built with GRU analyze the longitudinal sequential feature embeddings from the CNN. The output of the RNN then is fed to the decoder to predict DFs of a future week. In the case of week 4 prediction, output features from the first GRU were fed to the convolutional decoder to predict the week 4 DF. To predict the DF of a week later than week 4, the input of the GRU not only include the feature embeddings from week 1 to 3, but also the feature embeddings, learned by another CNN encoder of the predicted DF from the previous week. Mathematically, the process can be written as the following equation:
| (1) |
where is the feature embeddings from week 1 to week k (k = 3 in this study) gt is the encoder, GRU, and decoder for predicting week t DF,
Figure 1.
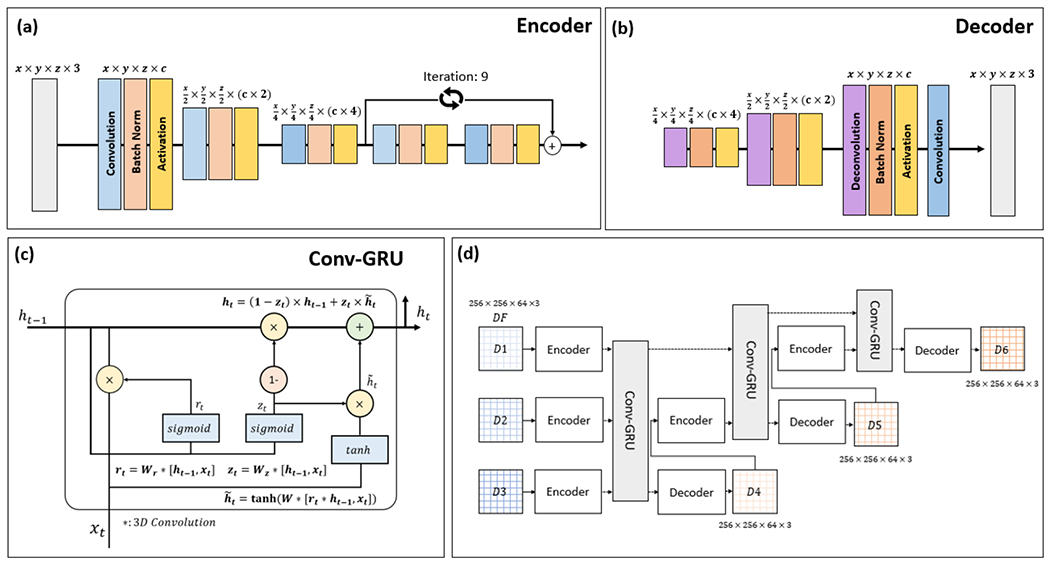
Schematic diagram for the proposed deep neural network. The network combines 3D convolutional encoder (a) and decoder (b) - and GRUs (c). For precise feature extraction of weekly DFs, we added residual building blocks to the convolutional encoder. Longitudinal sequential feature embeddings of weekly DFs were analyzed using GRUs. The overall architecture of the network is shown in (d).
The loss function for training includes two terms: a l2-norm loss between the predicted DF and the DIR DF and a Jacobian loss that penalizes the difference in volume changes. A 3 × 3 Jacobian matrix and its determinant were calculated from the DFs. The volume change can be computed using the Jacobian integral. And the absolute difference between the Jacobian integral of DIR DFs and predicted DFs were used for regularization.
We weighted the l2-norm loss for previous weeks for predictions later than week 4. The loss function is defined as following:
| (2) |
| (3) |
where J is the Jacobian loss and λq is the weight for week q.
The models were validated with 5 folds cross-validation. We trained the proposed model up to 300 epochs with adaptive momentum estimation (ADAM) optimizer and the learning rate was 0.001. Finally, we reconstructed the warped PG contour using the predicted DFs and invert warp function.
2.4. Geometrical matching evaluation.
The purpose of the geometrical matching evaluation is to assess the ability of the proposed approach to predict anatomical deformation between pCT and weekly CBCT. We propagated the PG contours using predicted DF and evaluated the dice coefficient (DICE) and volume difference (ΔV) between the manual and the predicted contours. The manual contours were obtained by two clinical planners. Also, we evaluated similarity between warped images (pCT → weekly CBCT) by DIR and proposed method by structure similarity index measure (SSIM) [28].
2.5. Accumulate dose evaluation.
One of the significant advantages of predicting DFs is that the predicted DF can be used to derive predicted dose distributions for the fractions not yet treated. Given a CBCT and a DF that maps the planning CT to the CBCT, there are two ways to obtain a delivered dose distribution: 1) generating a warped planning CT using the DF, calculating dose from the warped image, and deforming the calculated dose back to the planning CT using the DF, or 2) deforming the planning dose with the DF [29–32] Studies have shown the dose from the two approaches are not significantly different [33–34] In this study, we used the latter approach for both delivered weekly dose (by using DFs from DIR) and predicted weekly dose (by using predicted DFs.)
Let Di be the dose distribution of week I calculated using the DF from DIR and Pi be the predicted dose distribution calculated using the predicted DF. The delivered dose accumulation, DDAk, and the predictive dose accumulation, PDAk, up to week k, k > 3, are calculated as following
We compared the dose-volume histogram (DVHs) and the mean dose of DDA and PDA.
Further, we tested whether we can predict significant dose deviation using the triggers derived from literature. Wu Q. et. al.[42] reported that without re-planning, the mean dose to PG will be 10% higher than those in the initial plan. Since our physicians expressed that any additional sparing could be significant, we also included 7.5% and 5% triggers for detecting dose deviation that could warrant a re-planning. The detection accuracy was analyzed through receiver operating characteristic (ROC) and area under the curve (AUC).
3. Results
3.1. Convergence of the network training
Figure 2 (a-c) shows the convergence of the training with respect to the loss observed during the training processes for week 4-6 predictions, respectively. The loss dropped quickly and then stabilizes after 150 epochs. We decided to choose the model at 200 epochs by considering early stopping strategy for preventing model overfitting.
Figure 2.
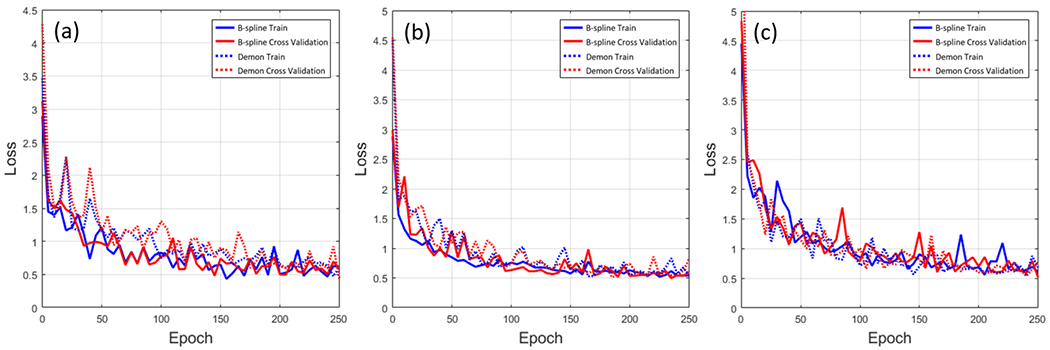
The loss function of week 4 prediction (a), week 5 prediction(b), and week 6 prediction (c). The solid line is the loss function of the trained model by B-spline DFs and the dotted line is the loss function of the trained model by Demon DFs. The blue line is training loss, the red line is a cross-validated loss.
3.2. Predictions of contours and volumes
In this section, we refer to the results from B-spline DIR and Demon DIR as DIRB and DIRD respectively. Similarly, we refer to the results from our prediction models trained with B-spline DFs and Demon DFs as PDMB and PDMD respectively.
Figure 3 shows two examples of contours propagated through DIR DFs and predicted DFs. The volume of propagated contours by DIRs and PDMs shrunk significantly compared to planning contours (red line) and the 3D shape agreed well with manual contours (green line). The contours derived by B-spline, including DIRB (blue line) and PDMB (yellow line), achieved closer agreement to manual contours than the contours derived from Demon. The contours derived from Demon, including DIRD (cyan line) and PDMD (black line), tended to produce less deformation than the actual deformation of the PG, thus their contours were bigger than manual contours.
Figure 3.
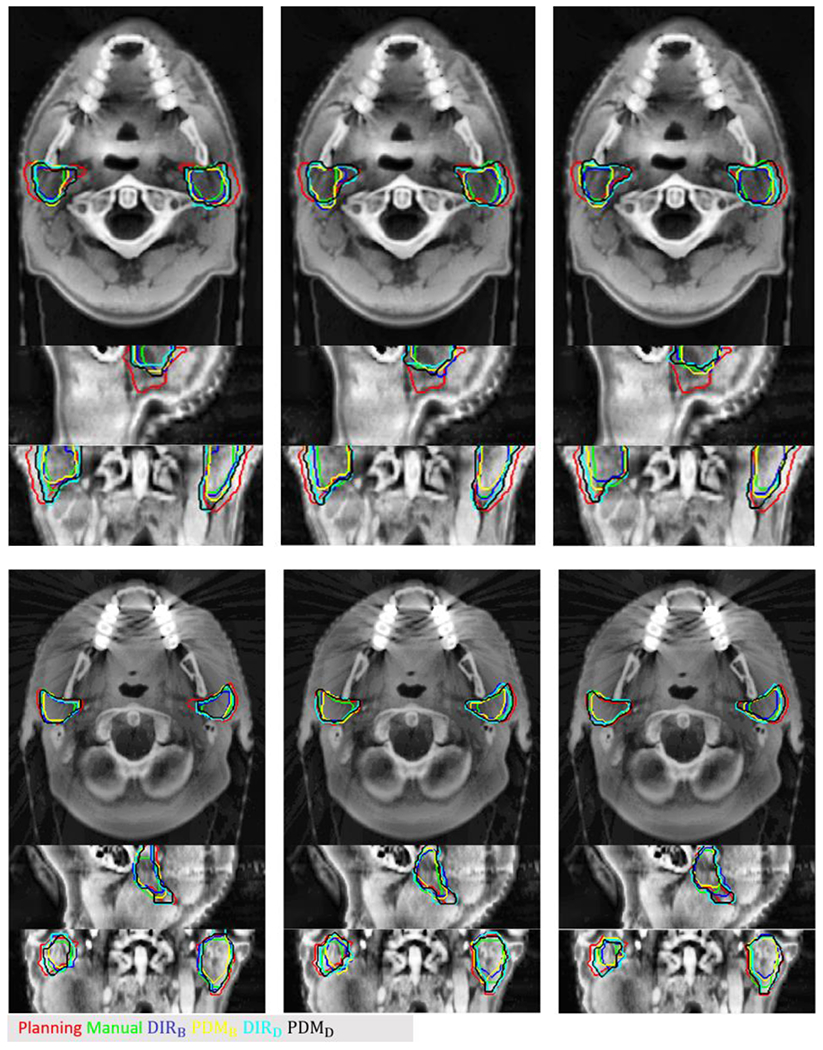
Two examples of testing cases. Red contour is the planning contour, the green contour is the manual contour at weekly CBCT, the blue and cyan contour is propagated contour by B-spline, and Demon and yellow (PDMB) and black contour (PDMD) are predicted contours by the trained model with B-spline and Demon DFs, respectively
Figure 4 shows the box plot of DICE results. The DICE of ipsilateral PG (iPG) and contralateral PG (cPG) were measured, separately. The DICE of iPG was lower than cPG, because much more deformation occurred at the iPG due to higher radiation exposure. The predicted results differ depending on the DIR algorithms used for deep learning training. For example, predicted contours from PDMB had better similarity with manual contours than the contours from and PDMD.
Figure 4.

Results of the dice coefficient. (a) DICE of week 4 prediction, (b) DICE of week 5 prediction, and (c) DICE of week 6 prediction. blue boxes are DICE of iPG and yellow boxes are DICE of cPG.
Table 2 lists the mean and standard deviation of 10 patients’ DICE. The predicted contour showed high similarity with the manual contours on the weekly CBCTs, considering the absence of the image and anatomical information at the predicted time points. As predicting time points increase from week 4 to 6, the DICE dropped slightly, especially at iPG. In the case of cPG prediction, the proposed method showed relatively consistent performance at all prediction points.
Table 2.
Mean and standard deviation of DICE.
| Week4 | Week5 | Week6 | ||||
|---|---|---|---|---|---|---|
| iPG | cPG | iPG | cPG | iPG | cPG | |
|
| ||||||
| DIRB | 0.816 ±0.076 | 0.832 ±0.022 | 0.796 ±0.068 | 0.821 ±0.059 | 0.792 ±0.075 | 0.822 ±0.042 |
| PDMB | 0.809 ±0.071 | 0.814 ±0.044 | 0.792 ±0.064 | 0.814 ±0.045 | 0.776 ±0.058 | 0.818 ±0.024 |
| DIRD | 0.806 ±0.074 | 0.835 ±0.028 | 0.784 ±0.058 | 0.822 ±0.032 | 0.775 ±0.070 | 0.823 ±0.025 |
| PDMD | 0.784 ±0.082 | 0.825 ±0.031 | 0.771 ±0.072 | 0.823 ±0.036 | 0.753 ±0.072 | 0.819 ±0.023 |
Figure 5 shows the volume ratios to the planning contours from DIRB, PDMB and manual PGs contours (week 4 to week 6) available in our test data set. As treatment proceeded volume of PGs were decreased. PDMB predict volumes similar to DIRB (< 1% on average). There was from 3 to 5 % difference between DIRB and manual contours.
Figure 5.
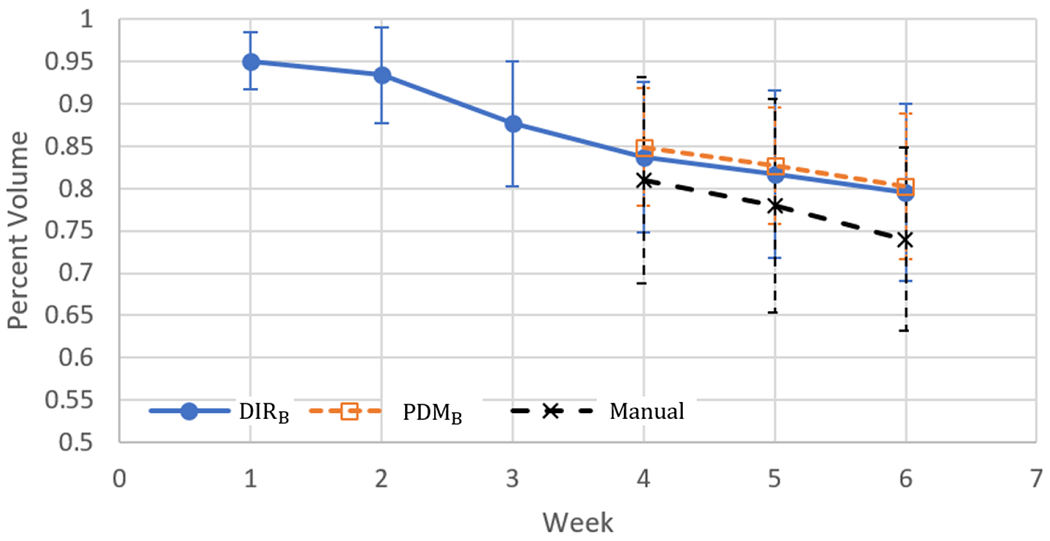
Volume ratios to the planning contours from the warped contours by DIRB, and PDMB. Blue solid line is the volume ratio of warped PG contours, Orange dotted line is the volume ratio of warped contours by PDMB and Black dotted line is the volume ratio of manual contours from the CBCT.
In terms of the volume differences (ΔV) of the PGs between manual contours and the contours propagated using DIRs and predicted DFs, the mean and standard deviation of ΔV was lower with B-spline than Demon and the mean ΔV of DIRB and PDMB were less than 2cc as shown in Table 3.
Table 3.
Mean and standard deviation of volume differences (cc) between manual contours and predicted contours.
| Week4 | Week5 | Week6 | ||||
|---|---|---|---|---|---|---|
| iPG | cPG | iPG | cPG | iPG | cPG | |
|
| ||||||
| DIRB | −0.24 ±2.00 | 0.66 ± 2.80 | 0.55 ±2.48 | 0.02 ±2.62 | 0.64±1.28 | 0.64±1,97 |
| PDMB | −0.62 ±1.82 | 0.60 ± 2.06 | 0.54 ±1.89 | 0.13 ±3.32 | 1.89±1.22 | 1.60±2.75 |
| DIRD | 2.71 ±3.23 | 1.55 ± 3.50 | 2.53±3.20 | 1.03±0.03 | 3.38±1.94 | 2.01±2.49 |
| PDMD | 4.43 ±3.28 | 3.62 ± 3.36 | 4.44±2.12 | 1.86±3.31 | 6.25±2.58 | 2.89±0.02 |
3.3. Predictions of images
Figure 6 is two examples of week 4th warped images (pCT → weekly CBCT) by DIR and PDM. To transform planning CT to CBCT, DIR DFs and predicted DFs were inverted. The anatomical shape of warped images by both DIR and PDM were close to week 4th CBCT, especially DIRB and PDMB deformed both sides PG region’s shrinkage well. The average SSIM of 10 patients between DIRB and PDMB was 0.96±0.043 and between DIRD and PDMD was 0.959 ± 0.035.
Figure 6.
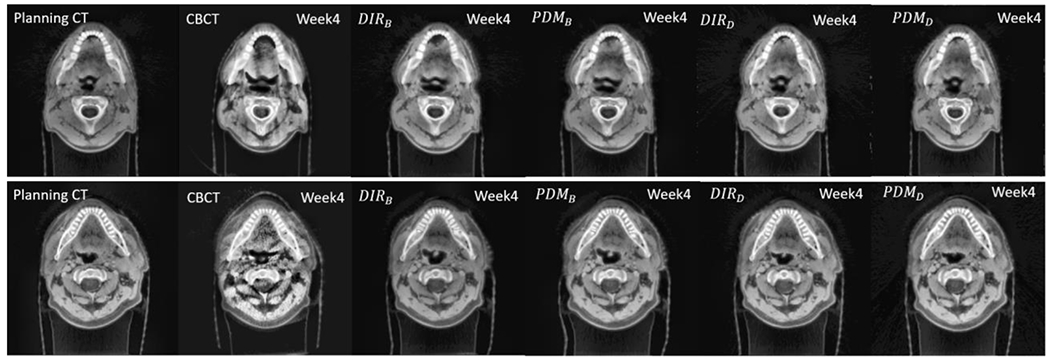
Comparison images of week 4th CBCT, Warped images from planning CT to CBCT by DIR, and predicted DF.
3.4. Predictions of accumulated dose
As described in Section 2.5, the predicted DFs can be used for dose accumulation for the untreated fractions even the CBCT images are not available yet. We compared the dose deviation from the plan dose using the accumulated dose derived from DIRs (DIRB and DIRD) and our predicted models (PDMB and PDMD). Table 4 shows the mean dose difference (ΔDmean and %ΔDmean) measured at recalculated dose by different DVF for each predicted week of the 10 test cases, and Figure 7 shows the difference for each case.
Table 4.
Mean dose difference and percent dose difference from the planned dose.
| Week 4 | Week 5 | Week 6 | ||||
|---|---|---|---|---|---|---|
| iPG | cPG | iPG | cPG | iPG | cPG | |
| ΔDmean | ΔDmean | ΔDmean | ΔDmean | ΔDmean | ΔDmean | |
| (%ΔDmean) | (%ΔDmean) | (%ΔDmean) | (%ΔDmean) | (%ΔDmean) | (%ΔDmean) | |
|
| ||||||
| DIRB | 0.79 ±1.43 | −0.15±0.87 | 1.04±1.95 | −0.13 ± 1.12 | 1.28±2.32 | −0.05±1.52 |
| (−4.78~18.35 %) | (−11.60~16.29 %) | (−5.48~21.23 %) | (−12.97~15.52 %) | (−5.48~21.48 %) | (−13.68~18.98 %) | |
| PDMB | 0.71±1.51 | −0.28±0.91 | 1.22±1.94 | −0.22±1.24 | 1.37±2.27 | −0.27±1.28 |
| (−5.60~19.54 %) | (−12.94~17.3%) | (−4.01~22.73 %) | (−14.02~19.91%) | (−5.18~20.84%) | (−14.41~13.83%) | |
| DIRD | 0.86±1.57 | 0.39±0.87 | 1.17±2.18 | 0.58±1.09 | 1.54±2.74 | 0.84±1.44 |
| (−3.72~20.13 %) | (−8.28~15.85 %) | (−2.97~16.11 %) | (−6.62~12.68 %) | (−3.98~23.50 %) | (−8.77~17.94 %) | |
| PDMD | 0.70±1.70 | 0.32±0.81 | 1.07±1.87 | 0.48±1.11 | 1.41±2.60 | 0.67±1.31 |
| (−5.66~20.52 %) | (−8.93~11.79 %) | (−3.27~19.03 %) | (−8.76~14.39 %) | (−4.19~21.67 %) | (−8.08~15.67 %) | |
Figure 7.
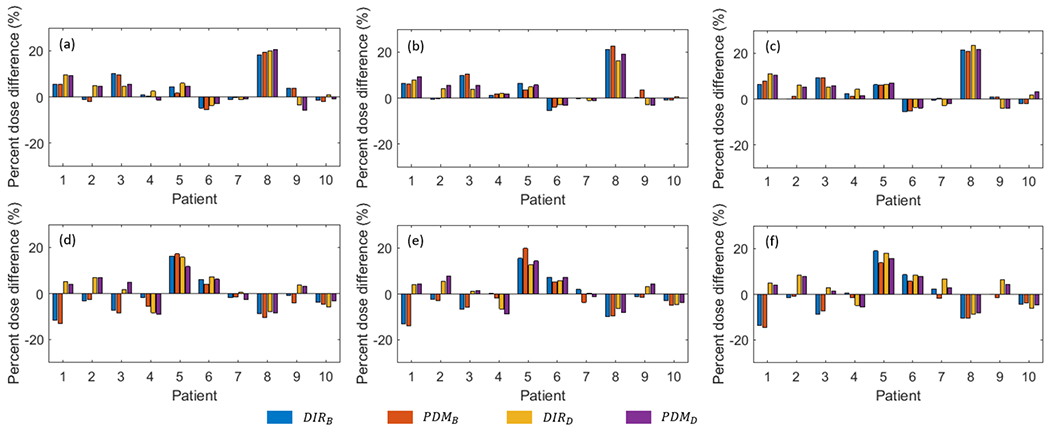
The percent mean dose difference (%ΔDmean) of each patient. (a-c) are %ΔDmean of the ipsilateral parotid gland, and (d-f) are %Dmean of the contralateral parotid gland. The first column is %ΔDmean at week 4 accumulated dose, the second column is week 5 and the third column is week 6.
To estimate the uncertainty of the predicted accumulated dose, at each predicted week, for each voxel, we found the minimum and maximum dose from the predicted accumulated dose from PDMB and PDMD, resulting in 2 additional predicted minimum and maximum dose volumes. We plotted a band DVH using the predicted minimum and maximum dose volumes, and 2 predicted DVHs from the models which are encapsulated inside the min/max band DVH representing the uncertainty of our predictions as shown in Figure 8.
Figure 8.
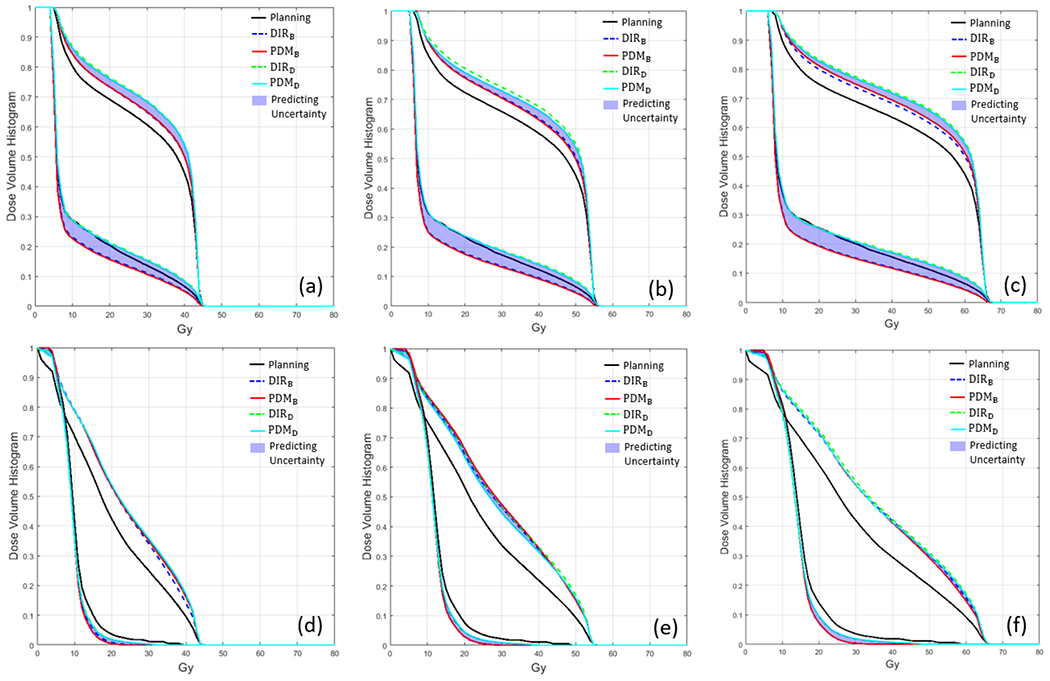
Dose-volume histogram of two examples of testing data. (a-c) are DVH of first examples testing data and (d-f) are DVH of the second example testing data in Figure 3. The black solid line is DVH of planning, the blue dotted line is DVH of accumulated dose derived by DIRB, the red solid line is DVH derived by as PDMB, the green dotted line is DVH derived by DIRD, and cyan solid line is DVH derived by PDMD.
3.5. Detecting candidate patient for adaptive radiotherapy (ART)
We studied different criteria in deviation of the planned dose which will trigger re-planning. Currently, we do not have a clinical protocol in place to adapt a plan based on the volume shrinkage or dose deviation of parotids. We experimented with 3 triggers: if the accumulated mean dose deviation is more than 5%, 7.5%, and 10% in any given predicting week. The accumulated dose obtained from DIRB served as the ground truth delivered dose. The receiver operating characteristic (ROC) analysis was done for detection accuracy. The results are shown in Figure 9. For week 4, 5, and 6, PDMB achieved an area under the curve (AUC) above 0.97 for all 3 weeks. The AUC of all predictions was over 0.90 which suggests that the proposed method can detect ART candidates at an earlier treatment stage.
Figure 9.

The receive operating characteristic (ROC) and area under the curve (AUC) of ART candidate detection. (a) is the detection accuracy of PDMB and PDMD at week 4, (b) is at week 5, and (c) is at week 6. The triggers for re-planning were 5, 7.5, and, 10%.
Figure 10 shows a case where dose deviation is over 10 % at week 4, 5, and 6. As the treatment progressed, PG shrank and slightly moved toward the medial side. The proposed method can predict the change of mean dose well with the predicted PGs. The mean dose differences between manual contours and PDMB was less than 1 %.
Figure 10.

An example of pCT and weekly (Week 4-6) CBCT (a), in which dose deviation between planned and delivered dose over 10 %. Red contour is planning contour and yellow, blue contours are predicted and manual contour at week 4th to 6th CBCT, respectively. The blue and yellow boxes in the low part of the figure are percent volume changes of the parotid (left/right) of manual and predicted, respectively. The mean dose difference from the initial plan of manual and PDMB. The red dotted line is a 10 % mean dose difference which is considered as a trigger for re-planning.
4. Discussions
Clinical impact of our study
In HN cancer RT, xerostomia and hyposalivation are common side effects, which include problems in swallowing, speaking, and loss of taste and hence carries with it a direct impact on patient quality of life (QOF). Xerostomia and hyposalivation are considered as one of the most common toxicities to the patient [36–37]. According to Jaguar et al, 2017 approximately 70 % of patients receiving HN cancer RT develop hyposalivation with significant alternation in volume. The degree of xerostomia is largely dependent on the radiation dose and the volume of salivary glands that lie in the radiation field [36–37].
PG is one of the most deformable OARs during the RT. Therefore, to minimize significant degradation of the patient’s QOF (driven by excessive radiation dose delivery to PG due to PG anatomical and geometrical changes), it is necessary to adjust treatment planning. From this point of view, we proposed a deep neural network that can provide the PG longitudinal anatomical changes of later treatment time points in advance.
Accuracy of DIR
Unlike previous studies with deep learning in the field of medical imaging, we used DFs for training the proposed deep learning model. To increase the accuracy of DIR, we optimized hyperparameters of DIR by considering DICE between propagated contour (manual contour at CBCT → pCT) and planning contours, mean Jacobian of DFs and the metric for DIR.
The novelty of proposed deep learning model
In contrast to the previous studies on longitudinal prediction in medical imaging, we used the 3D CNN and RNN architectures. Considering that the imaging modality used in the field on radiation therapy is 3-D, using a 3D based deep learning architecture has the advantage that it can be readily deployed. We used Jacobian as a regularization of the loss function with respect to volume change [38–40]. Since DF can be used to derive other valuable information in the course of radiotherapy, we used DFs alone for end-to-end training and prediction so that the predicted DF has similar magnitude and direction to the DF obtained from registration of real images.
Geometrical accuracy
As can be shown in figure 4 and table 3, the accuracy of geometric prediction is significantly affected by the accuracy of DFs used for deep learning training. The improvement in DF accuracy for training is essential for further improving the performance of the proposed method. Between the B-spline and Demon, B-spline showed much better geometrical accuracy in predicting the future anatomical shape and volume of PGs. Since B-spline uses mutual information as the metric, it is more appropriate for multi-modality registration between CBCT and CT than the intensity-based DIR such as Demon.
Variability of Parotid glands’ volume during the RT
According to previous clinical researches, there are noticeable changes in the patient anatomy in HN during the RT, observed by the daily or weekly imaging during the treatment course. The deviation of dose to the PG is the highest compare to the target and the other OARs [41–42]. Therefore, volume and anatomy changes of PG is an important biomarker for deciding re-planning. And the re-planning will largely benefit the sparing of the PG. In this study to investigate the variable of PG, we evaluated the volume of PG during the RT. Figure 5 is the quantitative evaluation of 10 patient’s PG volume ratio from the volume of planning contours. The volume of PG was gradually shrunk as treatment proceeded. Our proposed method predicted a very similar volume with DIR, but there was 3-5 % error compared to manual contour. And the error was increased as the time point of treatment was increase from week 4 to 6. In addition, our institution proceeded to the clinical investigation of PG volume changes during the RT with an additional 15 oropharynx cancer patient data who received the ART [41]. The decision to re-planning was made based on weekly MR assessment of nodal target and plans were adapted between fractions 5 and 30. The average volume changes of PG were −12.2 % and the mean dose to the PG changed 3.7 % [43].
Error in DF due to vanishing voxels
The patients undergoing HN RT have significant weight loss as many other studies also showed and, in this case, vanishing voxels/volume loss may cause errors in DF. However, some studies showed that local shrinkage/expansion can be characterized by one-to-many mapping of the corresponding points in transformations of free-form DIRs [4,44]. This introduces a free-form elasticity to the converging/diverging vectors creating a sink/source point that is mapped to many points in its vicinity and represents a morphological shrinkage/expansion for the regions with volume loss/gain [4, 44].
We clarify this using an example of pCT (Figure 11 top) to w6 CBCT (Figure 11 middle) DF of a patient having significant shrinkage in Left and Right PG. Figure 11 middle shows considerable shrinkage in both left (sagittal & coronal) and right (coronal) PGs compared to planning CT. Figure 11 bottom shows converging DF (one-to-many mapping) created a sink point from boundaries toward the center of both left/right PGs representing morphological shrinkage/volume loss. To verify the shrinkage, we calculated the Jacobian map (J) of DF showed in the background of DFs overlaid on pCT in Figure 11 bottom. J measures local volume changes (voxel-wise) between the two volumetric structures where if J>1 it represents local volume expansion (red color), 0≤J<1 shrinkage (blue), and J=1 no change (light green) [4, 44], Here, Jacobians in PGs were much smaller than 1 (dark blue) where the converging vectors generated a sink point indicating large shrinkages. Quantitatively, in both PGs majority of voxels (97%) were shrinking with average Jacobian of 0.74 and 0.66, indicating overall a 26% and 34% local shrinkage in the right and left PG volumes, respectively. Left PG had larger shrinkage due to being vicinity to the tumor and higher radiation toxicities. Uncertainty of J depends on the accuracy of DIR which we thoroughly validated in the paper using optimized parameters. This experiment shows that local shrinkages and volume loss can be characterized by a well-optimized free-form DF, hence dose mapping resulting from the DF would be reliable if geometrically and dosimetrically validated.
Figure 11.
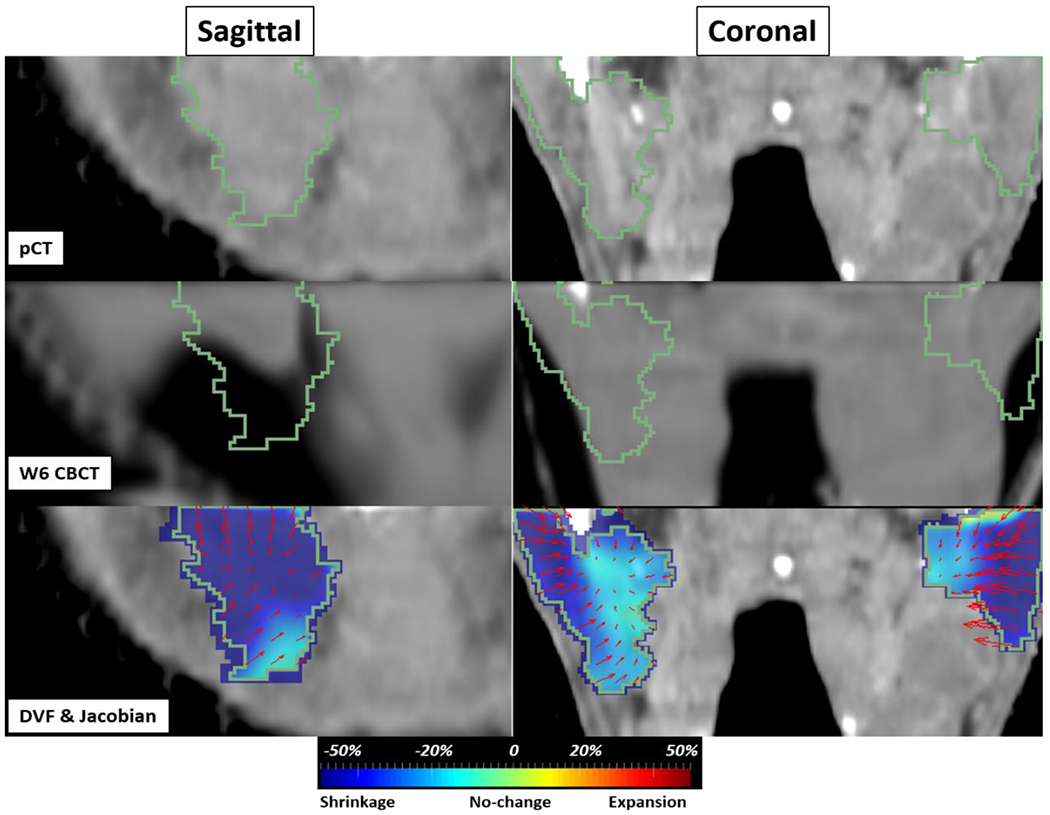
pCT to w6 CBCT example of a patient with volume loss in PGs in sagittal (left PG) and coronal (left and right PG) views. (top) pCT (middle) w6 CBCT with shrinkage inside both PGs (bottom) DF and Jacobian map overlaid on pCT. The color map visually shows the amount of local shrinkage (blue) to expansion (red).
Dose evaluation
ΔDmean and %ΔDmean varies depending on the patient. In extreme cases, we observed differences of approximately 20%. The prediction of future dose distribution through the proposed method was very accurate with respect to the results predicted by the DIR with less than 1 %ΔDmean differences. As can be seen from the DVH curves in figure 9, the proposed method predicted clinical outcomes well, and hence, it is expected that clinically useful information can be provided in advance for early re-planning decision. We compared the accuracy of ART decision making between B-spline, which is widely used in clinical practice, and the proposed method. The accuracy of the proposed method was over 0.9 AUC at all time point predictions. Through these results, it is expected that the proposed method can be a great help in the ART process by making re-planning decisions earlier than the current workflow.
Trigger of re-planning
Deciding the trigger threshold for re-planning is an ongoing part of our efforts and beyond the scope of the current manuscript. Instead, we tested whether we can predict significant dose deviation using the trigger derived from literature. Wu Q. et al [42]. reported that without re-planning, the mean dose to PG will be 10% higher than those in the initial plan. Since our physician expressed that any additional sparing could be significant, we also included 7.5 % and 5 % triggers for detecting dose deviation that could warrant a re-planning.
Limitations and further studies
Nevertheless, we demonstrated that our proposed network can predict accurate longitudinal PG volumes and anatomical changes, more training, and verification process with different datasets are needed for clinical applications [45]. In this study, we investigated anatomical changes of parotid glands because the research protocol initially was design for tracking parotid shrinkage and the associated dosimetric changes evaluated with the manual contours of PG. However, the proposed method predicts whole DFs at later time points of RT therefore our method can be applied to GTV as well as the other OAR.
In this study, we only used DF for analyzing longitudinal anatomical changes. We expect better predictability from our model when we incorporate images along with DF in our future work.
5. Conclusion
The proposed method, which combines CNN and RNN can effectively predict future anatomical changes of the PG, which is commonly considered an organ-at-risk exhibiting significant shrinkage for HN cancer patients undergoing the RT. The prediction of anatomical changes of parotid glands and accumulated dose prediction was clinically acceptable and thus, it is expected that the proposed method can contribute to establishing a treatment strategy such as re-planning to reduce radiation-induced toxicities and improve treatment outcomes.
Acknowledgment
Supported by master research agreement between Memorial Sloan Kettering Cancer Center and Varian Medical Systems; Partially supported by NCI/NIH P30 CA 008748
Footnotes
Conflict of interest
We have no conflict of interest to declare
Reference
- [1].Johnston M, Clifford S, Bromley R, Back M, Oliver L, Eade T, 2011Volumetric-modulated Arc Therapy in Head and Neck Radiotherapy: A planning Comparison using Simultaneous Integrated Boost for Nasopharynx and Oropharynx Carcinoma Clinical Oncology 23(8) 503–511. [DOI] [PubMed] [Google Scholar]
- [2].Baskar R, Kuo Lee KA, Yeo R, Yeoh K-W 2012Cancer and Radiation Therapy: Current Advances and Future Directions International Journal of Medical Sciences 9(3) 193–199. [DOI] [PMC free article] [PubMed] [Google Scholar]
- [3].Hong TS, Tomé WA, Chappell RJ, Chinnaiyan P, Mehta MP, and Harari PM 2005The impact of daily setup variations on head-and-neck intensity-modulated radiation therapy International Journal of Radiation Oncology Biology Physics 61(3) 779–788. [DOI] [PubMed] [Google Scholar]
- [4].Alam S, Thor M, Rinner A, Tyagi N, Zhang SY, Kuo LC, Nadeem Saad, Lu W, Hu YC, Yorke E, Zhang P 2020Quantification of accumulated dose and associated anatomical changes of esophagus using weekly Magnetic Resonance Imaging acquired during radiotherapy of locally advanced lung cancer 2020 Journal of Physics and Imaging in Radiation Oncology 1336–43. [DOI] [PMC free article] [PubMed] [Google Scholar]
- [5].Castadot P, Lee JA, Parraga A, Geets X, Macq B, Grégorie V 2008Comparison of 12 deformable registration strategies in adaptive radiation therapy for the treatment of head and neck tumors Radiotherapy and Oncology 89(1) 1–12. [DOI] [PubMed] [Google Scholar]
- [6].Wu Q, Manning M, Schmidt-Ullrich R, Mohan R 2000The potential for sparing of parotids and escalation of biologically effective dose with intensity-modulated radiation treatments of head and neck cancers: a treatment design study International Journal of Radiation Oncology Biology Physics 46(1) 195–205. [DOI] [PubMed] [Google Scholar]
- [7].Trotti A 2000Toxicity in head and neck cancer: a review of trends and issues International Journal of Radiation Oncology Biology Physics 47(1) 1–12. [DOI] [PubMed] [Google Scholar]
- [8].Cooper JS, Fu K, Marks J, Silverman S 1995Late effects of radiation therapy in the head and neck region International Journal of Radiation Oncology Biology Physics 31(5) 1141–1164. [DOI] [PubMed] [Google Scholar]
- [9].Wu Q, Chi Y, Chen PY, Krauss DJ, Yan D, Martinez A 2009Adaptive Replanning Strategies Accounting for Shrinkage in Head and Neck IMRT 75(3) 924–932. [DOI] [PubMed] [Google Scholar]
- [10].Daniel JC, Garden AS, Schwartz DL, Wang H, Ang KK, Ahamad A, Rosenthal DI, Morrison WH, Asper JA, Zhang L, Tung SM, Mohan R, Dong L 2007Parotid Gland Dose in Intensity-Modulated Radiotherapy for Head and Neck Cancer: Is What You Plan What you Get? International Journal of Radiation Oncology Biology Physics 69(4) 1290–1296. [DOI] [PMC free article] [PubMed] [Google Scholar]
- [11].Ricchetti F, Wu B, McNutt T, Wong J, Forastiere A, Marur S, Starmer H, Sanguineti G 2011Volumetric change of selected organs at risk during IMRT for oropharyngeal cancer International Journal of Radiation Oncology Biology Physics 80(1) 161–168. [DOI] [PubMed] [Google Scholar]
- [12].Nishimaura Y, Nakamatsu K, Shibata T, Kanamori S, Koike R, Okumura M 2005Importance of the initial volume of parotid glands in xerostomia for patients with head and neck cancer treated with IMRT Japanese Journal of Clinical Oncology 35(3) 375–379. [DOI] [PubMed] [Google Scholar]
- [13].Manning MA, Wu Q, Cardinale RM, Mohan Rm Lauve AD, Kavanagh BD, Morris MM, Schmidt-Ullrich RK 2001The effect of setup uncertainty on normal tissue sparing with IMRT for head-and-neck cancer International Journal of Radiation Oncology Biology Physics 51(5) 1400–1409. [DOI] [PubMed] [Google Scholar]
- [14].Schwartz DL, Garden AS, Shah SJ, Chronowski G, Sejpal S, Rosenthal DI, Chen Y, Zhang Y, Zhang L, Wong P-F, Garcia JA, Ang KK, Dong L 2013Adaptive radiotherapy for head and neck cancer-Dosimetric results from a prospective clinical trial, Radiotherapy and Oncology 106(1) 80–84. [DOI] [PubMed] [Google Scholar]
- [15].Zang L, Lu L, Wang X, Robert MZ, Bagheri M, Summers RM, Yao J 2020Spatio-Temporal Convolutional LSTMs for Tumor Growth prediction by learning 4D Longitudinal Patient Data, IEEE Transactions on Medical Imaging 39(4) 1114–1126. [DOI] [PMC free article] [PubMed] [Google Scholar]
- [16].Wang C, Rimner A, Hu YC, Tyagi N, Jiang Jm Yorke E, Riyahi S, Mageras G, Deasy JO, Zhang P 2019Toward predicting the evolution of lung tumors during radiotherapy observed on a longitudinal MR imaging study via a deep learning algorithm Medical Physics 46(10) 4699–4797. [DOI] [PMC free article] [PubMed] [Google Scholar]
- [17].Böck M, Eriksson K, Forsgren A, Hårdemark B 2017Toward robust adaptive radiation therapy strategies, Medical Physics 44(6) 2054–2065. [DOI] [PubMed] [Google Scholar]
- [18].Lei Yu, and Wu Q 2010A hybrid strategy of offline adaptive planning and online image guidance for prostate cancer radiotherapy Physics in Medicine and Biology 55(8) 2221–2234. [DOI] [PMC free article] [PubMed] [Google Scholar]
- [19].Schwartz DL, Garden AS, Thomas J, Chen Y, Zhang Y, Lewin J, Chambers MS, Dong L 2012Adaptive Radiotherapy for Head-and-Neck Cancer: Initial Clinical Outcomes From a Prospective Trial, International Journal of Radiation Oncology Biology Physics 83(3) 986–993. [DOI] [PMC free article] [PubMed] [Google Scholar]
- [20].Lee JG, Jun S, Cho Y-W, Lee H, Kim GB, Seo JB, Kim NG, Deep learning in Medical Imaging: General Overview 2017 Korean Journal of Radiology 18(4) 570–584. [DOI] [PMC free article] [PubMed] [Google Scholar]
- [21].Srivastava N, Mansimov E, and Salakhudinov R 2015Unsupervised learning of video representation using LSTMs, International Conference on Machine Learning, 37, 843–852, Lille France. [Google Scholar]
- [22].Liang X, Lee L, Dai W, and Xing PE 2017Dual motion GAN for future flow embedded video prediction, International Conference on Computer Vision, 1744–1752, IEEE, Seoul, South Korea. [Google Scholar]
- [23].Cho K, Merrienboer BV, Bahdanau D, Bengio Y 2014On the properties of neural machine translation: Encoder-Decoder Approaches, Proceeding of Eighth Workshop on Syntax, Semantics and Structures in Statistical Translation, 103–111, Doha Qatar. [Google Scholar]
- [24].Akilan T, Wu AJ, Safaei A, Huo J, Yang Y 2020A 3D CNN-LSTM Based Image-to-Image Foreground Segmentation. IEEE Transactions on Intelligent Transportation Systems 21(3) 959–971. [Google Scholar]
- [25].Choy CB, Xu D, Gwak J, Chen K, Savarese S 20163D-R2N2: A Unified Approach for single and Multi-view 3D object Reconstruction. European Conference on computer vision9912628–644. [Google Scholar]
- [26].Yao G, Liu X, Lei T 2018Action Recognition with 3D ConvNet-GRU Architecture. International Conference on Robotics208–213. [Google Scholar]
- [27].Plastimatch Homepage, https://www.plastimatch.org/, last accessed 2020/05/15.
- [28].Alian H, Djemel Z, 2010Image quality metric: PSNR vs SSIM, 2010 20th International Conference on Pattern Recognition, 2366–2369. [Google Scholar]
- [29].Veiga C, McClelland J, Moinuddin S, Lourenço A, Ricketts K, Annkah J, Modat M, Ourselin S, D’Souza D, Royle G 2014Toward adaptive radiotherapy for head and neck patients: Feasibility study on using CT-to-CBCT deformable registration for “dose of the day” calulations. Medical Physics 41(3) 031703. [DOI] [PubMed] [Google Scholar]
- [30].Veiga C, Lourenço A, Mouinuddin S, Herk MV, Modat M, Ourselin S, Royle G, McClelland JR. 2015. Toward adaptive radiotherapy for head and neck patients: Uncertainties in dose warping due to the choice of deformable registration algorithm. Medical Physics 42(2) 760–769. [DOI] [PubMed] [Google Scholar]
- [31].Chetty IJ, Rosu-Bubulac M 2019Deformable Registration for Dose Accumulation. Seminal in Radiation Oncology 29(3) 198–208. [DOI] [PubMed] [Google Scholar]
- [32].Fortunati V, Verhaart RF, Angeloni F, Lugt Avd, Niessen WJ, Veenland JF, Paulides MM, Walsum Tv 2014Feasibility of Multimodal Deformable Registration for Head and Neck Tumor Treatment Planning. International Journal of Radiation Oncology Biology Physics 90(1) 85–93. [DOI] [PubMed] [Google Scholar]
- [33].Sharma M, Weiss E, Siebers JV 2012Dose deformation-invariance in adaptive prostate radiation therapy: Implication for treatment simulations Radiotherapy and Oncology 105(2) 207–213. [DOI] [PMC free article] [PubMed] [Google Scholar]
- [34].Pukala J, Staton R, Langen K 2012What is the importance of Dose Recalculation for Adaptive Radiotherapy Dose Assessment? Annual meeting of the American association of physicists in medicine 393699. [DOI] [PubMed] [Google Scholar]
- [35].McCulloch MM, Lee C, Rosen BS, Kamp JD, Lockhart CM, Lee JY et al. , 2019Predictive Models to Determine Clinically Relevant Deviations in Delivered Dose for Head and Neck Cancer, Practical Radiation Oncology, 9(4) e422–e431. [DOI] [PMC free article] [PubMed] [Google Scholar]
- [36].Jaguar GC, Prado JD, Campanha D, Alves FA 2017Clinical features and preventive therapies of radiation-induced xerostomia in head and neck cancer patient: a literature review. Applied Cancer Research 37(31). [Google Scholar]
- [37].Teshima K, Murakami R, Tomitaka E, Nomura T, Toya R, Hiraki A, Nakayama H, Hirai T, Shinohara M, Oya N, Yamahita Y 2009Radiation-induced Parotid Gland Changes in Oral Cancer Patients: Correlation Between Parotid Volume and Saliva production. Japanese Journal of Clinical Oncology 40(1) 42–46. [DOI] [PubMed] [Google Scholar]
- [38].Hoffman J, Roberts DA, Yaida S, Robust Learning with Jacobian Regularization, arXiv:1908.02729. [Google Scholar]
- [39].Nie W, Patel A, Towards a Better Understanding and Regularization of GAN Training Dynamics, aarXiv:1806.09235. [Google Scholar]
- [40].Mok TCW, Chung ACS 2020Fast Symmetric Diffeomorphic Image Registration with Convolutional Neural network arXiv:2003.09514. [Google Scholar]
- [41].Hunter KU, Fernandes LL, Vineberg KA, McShan D, Antonuk AE, et al. , 2013Parotid Glands Dose-Effect Relationships Based on Their Actually Delivered Dose: Implications for Adaptive Replanning in Radiation Therapy of Head-and-Neck Cancer, Int. J Radiat. Oncol. Biol. Phys, 87(4), 676–682. [DOI] [PMC free article] [PubMed] [Google Scholar]
- [42].Wu Q, Chi Y, Chen PY, Krauss DJ, Yan D, Martinez A, 2009Adaptive Replanning Strategies Accounting for Shrinkage in Head and Neck IMRT, Int. J Radiat. Oncol. Biol. Phys, 75(3), 924–932. [DOI] [PubMed] [Google Scholar]
- [43].Aristophanous M, Caringi A, Allgood N, Zhang P, Hu Y, Cervino L, et al. , 2020Dosimetric changes of the Parotid as a Result of Head and Neck Adaptive Radiotherapy, The Americ. Associat. Of Physic In Medic., Accepted abstract in AAPM 2020. [Google Scholar]
- [44].Riyahi-Alam S, Choi W, Liu C, Zhong H, Wu A, Mechalakos J, et al. , 2018Quantifying local tumor morphological changes with Jacobian map for prediction of pathologic tumor response to chemo-radiotherapy in locally advanced esophageal cancer. Phys Med Biol.63(14), 145020. [DOI] [PMC free article] [PubMed] [Google Scholar]
- [45].Wang C, Alam SR, Zhang S, Yu-Chi Hu, Nadeem S, Tyagi N, Rimmer A, Lu W, Thor Maria, and Zhang P, Predicting spatial esophageal changes in a multimodal longitudinal imaging study via a convolutional recurrent neural network, Physics [DOI] [PMC free article] [PubMed] [Google Scholar]


