Abstract
Background/Aim: Body fluids are considered to be a rich source of disease biomarkers. Proteins in many body fluids have potential clinical applications for disease diagnostic and prognostic purposes. The aim of this study was to establish an in-depth multi-body fluid proteome. Materials and Methods: Ten body fluids associated with 8 types of cancers collected from 23 patients involved in 19 common diseases underwent liquid chromatography tandem mass spectrometry (MS) analysis after gel-based protein separation (SDS-PAGE) or peptide-based fractionations. Bioinformatic analysis, including principal component analysis (PCA), consensus clustering, and hierarchical clustering analysis were also performed. The biological function was determined using the Database for Annotation, Visualization and Integrated Discovery (DAVID). Results: We profiled the proteome of ten body fluids, including ascites, bile, cerebrospinal fluid (CSF), hydrothorax, knee joint fluid (KJF), plasma, saliva, serum, tears, and urine. A total of 3,396 nonredundant proteins were identified, of which 304 were shared among ten body fluids, with common functions in focal adhesion and complement/coagulation cascades. A total of 41.5% (1,409) of the proteins were detected in only one body fluid and were closely related to their adjacent tissues by function. The functional analysis of the remaining 1,683 proteins showed that similar functions might be shared among different body fluids, which further highlighted the close connection of body fluids in the human body. Conclusion: A deep proteome of multi-body fluids originated from patients diagnosed with 19 common diseases provides a valuable data resource, and might indicate the potential application of body fluids for biomarker discovery.
Keywords: Body fluids, proteomics, mass spectrometry analysis, biomarkers, gel-based protein separation
Human body fluids are considered rich sources of potential disease biomarkers because they are in direct contact with a variety of living tissues, which include plasma/serum, saliva, urine, cerebrospinal fluid (CSF), tear fluid, ascites, bile, hydrothorax and knee joint fluid (KJF). It is widely accepted that human body fluids contain disease-associated proteins that are secreted, shed, and emanated from pathological tissues across the body (1). In disease, highly altered protein expression profiles in body fluids may generate undeniable signatures and unwrapped fingerprints, which may provide insight into disease mechanisms. Therefore, body fluids have potential applicability for the early detection of disease, for the monitoring of its progression, and for therapeutic drug efficacy, especially for their adjacent diseased tissue.
Proteomics is a powerful method for biomedical research. With the significant advances in mass spectrometry (MS) and proteomics technologies (2,3), protein biomarker discovery has become one of the central applications of proteomics. In terms of disease diagnosis and prognosis, compared to tissue biopsy, human body fluids (e.g. blood, urine, tears, or saliva) appear to be more easy and attractive because of several key advantages, including low invasiveness, minimum cost, and the ease of sample collection and processing (4). The application of modern proteomic tools in body fluids (5) raised some major issues related to the standardization of sample collection, separation, and processing for qualitative proteomics [such as two-dimensional gel electrophoresis (2-DE) (6-8) and multiple liquid chromatography (LC) techniques (9)] or quantitative proteomics [such as 2D difference gel electrophoresis (10), isotope-coded affinity tag (11), stable isotope labeling by amino acids in cell culture (12,13) and isobaric tags for relative and absolute quantification (14-17)]. The ion intensity-based label-free quantitative approach has gradually gained more popularity and provides an alternative powerful tool to resolve and identify thousands of proteins from a complex biological sample (18,19).
Body fluid proteomes have been investigated for more than 10 years, beginning with the Human Plasma Proteome Project in 2002 (20). The emergence of high-accuracy and high-resolution mass spectrometers in 2006 led to large-scale analyses of tear-duct fluid (21), urine (22), and seminal plasma (23) from Mann’s group, which were considered the first high-accuracy proteome maps of human body fluids. With the rapid development of MS technology, the large-scale MS-based draft of the human proteome was presented in 2014 (24), including the proteomes of human tissues, cell lines, and body fluids. Among them, the proteomic datasets from eight body fluids (urine, seminal plasma, blood, vitreous humor, CSF, synovial fluid, saliva, and milk) were assembled to contribute to the whole proteome map of humans (24).
Urine with less complexity than serum and relatively high thermodynamic stability is a promising study medium for discovery of novel biomarkers in many human diseases, such as bladder and prostate cancer, and renal diseases (25-27). CSF is secreted from several different central nervous system (CNS) structures, and the change in the protein composition of CSF is considered a sensitive indicator for the analysis of neurodegenerative or other CNS disorders (28,29). As for saliva, the related salivary protein markers (such as glycoproteins) (30) have been well demonstrated to be important for the diagnosis of Sjogren’s syndrome (SS), an autoimmune disease characterized by xerostomia (dry mouth) and xerophthalmia (dry eyes). Tear fluid analysis is also a noninvasive approach in early diagnosis and study of pathogenesis of eye-related diseases such as dry eye syndrome.
In this study, we collected 10 body fluids from 23 patients diagnosed with 19 common diseases, obtained 157 MS raw files, and conducted a proteomic comparison using high-resolution MS. All of the proteomic data from ascites, bile, CSF, hydrothorax, KJF, plasma, saliva, serum, tears and urine were obtained using similar approaches and bioinformatics pipelines. For each body fluid, relative protein abundance was estimated using intensity-based algorithm quantitation (iBAQ) methods (31). A deep analysis was performed regarding the protein composition of ten body fluids, and the proteins were extensively characterized to provide functional annotation of the body fluid proteomes, novel insights into the relationships among these ten body fluids, and greater research utility for multiple diseases.
Materials and Methods
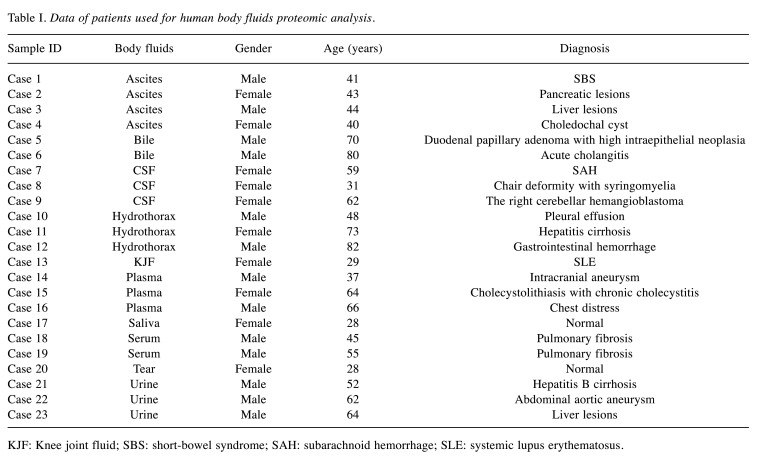
Body fluid samples. Prior to enrollment, all volunteers were provided with a verbal explanation of the study and signed a document of informed consent. The study was approved by the Institutional Research Ethics Committee of Zhongshan Hospital (B2019-200R). For the complex proteome database of human body fluids, we collected 10 body fluids (ascites, bile, CSF, hydrothorax, KJF, plasma, saliva, serum, tears and urine) from 23 patients diagnosed with 19 common diseases (10 females and 13 males, mean age of 52 years). The characteristics of the 23 patients are shown in Table I.
Table I. Data of patients used for human body fluids proteomic analysis.
KJF: Knee joint fluid; SBS: short-bowel syndrome; SAH: subarachnoid hemorrhage; SLE: systemic lupus erythematosus.
Sample preparation. All the samples were centrifuged at 12,000 × g, at 4˚C for 10 min to remove the cells and any debris. The supernatants were collected, and the protein concentration was determined using the Bradford assay (TaKaRa, Beijing, PR China). The samples were stored at −80˚C until further use.
Protein trypsin digestion and one-dimensional reversed-phase liquid chromatography (RPLC). Two strategies were adopted for further analysis. In the first strategy, ascites, bile, CSF, hydrothorax, KJF, plasma, serum, and urine samples were depleted of high-abundance proteins, fractioned on SDS-PAGE and in-gel tryptic digestion. Depletion of human serum albumin (HSA), albumin, IgG, IgA, IgM, IgD, IgE ĸB and λ light chains, α-1-acidic glycoprotein, α-1-antitrypsin, α-2-macroglobulin, apolipoprotein A1, fibrin, binding globin and transferrin from serum and plasma was carried out using High-Select™ Top14 Abundant Protein Depletion Mini Spin Columns (Thermo Fisher Scientific, Rockford, IL, USA) as per the manufacturer’s instructions. The depleted proteins were resolved on a 4%-20% gradient SDS-PAGE gel and the gel was stained using colloidal Coomassie blue. The dark-colored gel slices were excised and destained using 50 mM ammonium bicarbonate (ABC) in 40% methanol and then sequentially vibrated in 75% acetonitrile (ACN), HPLC/MS grade water, and 50 mM ABC. The sample was then subjected to reduction using 5 mM dithiothreitol (DTT) (60˚C for 45 min) followed by alkylation using 20 mM iodoacetamide (10 min at room temperature). In-gel digestion with trypsin was carried out at 37˚C for 12-16 h. Peptides were extracted from gel pieces sequentially using 100% ACN, 0.1% formic acid, and 100% ACN. The tryptic peptides were desalted by a home-made reverse-phase C18 column in a pipet tip, and eluted with acetonitrile (50%) and formic acid (0.1%). The peptide elution was dried in a vacuum concentrator (Concentrator plus, Eppendorf, Hamburg, Germany), and then analyzed by liquid chromatography tandem mass spectrometry (LC-MS/MS).
Alternatively, another strategy used for saliva and tear fluid was to perform direct in-solution digestion with trypsin; the resulting peptides were then fractionated by a home-made reverse-phase C18 column in a pipet tip. Peptides were eluted and separated into nine fractions using a stepwise gradient of increasing acetonitrile (6%, 9%, 12%, 15%, 18%, 21%, 25%, 30%, and 35%) at pH 10. The nine fractions were combined to three fractions (6%+15%+25%; 9%+18%+30%; 12%+21%+35%). The peptide elution was dried in a vacuum concentrator (Concentrator plus, Eppendorf), and then analyzed by LC-MS/MS.
LC-MS/MS analysis. Peptides from body fluids were detected by Orbitrap Fusion Lumos (Thermo Fisher Scientific). Orbitrap Fusion Lumos LC-MS/MS analyses were performed on an Easy-nLC 1000 liquid chromatography system (Thermo Fisher Scientific) coupled to an Orbitrap Fusion Lumos via a nano electrospray ion source (Thermo Fisher Scientific). Fractions from the first-dimension RPLC were dissolved with a loading buffer (5% methanol and 0.2% formic acid) and loaded onto a 360 μm ID × 2 cm, C18 trap column at a maximum pressure of 280 bar with 12 μl of solvent A (0.1% formic acid in water). Peptides were separated on a 150 μm ID × 14 cm column (C18, 1.9 μm, 120 Å, Dr. Maisch GmbH, Germany) over a 75-min gradient (Solvent A: 0.1 % formic acid in water; Solvent B: 0.1 % formic acid in 80 % ACN) at a constant flow rate of 600 Nl/min. The 75-min gradient was set as following: 4%-15% B in 10 min; 15%-30% B in 50 min; 30%-50% B in 9 min; 50%-100% B in 1 min; 100% B for 5 min. The eluted peptides were ionized under 2 kV and introduced into the mass spectrometer. MS was operated under a data-dependent acquisition mode. For the MS1 Spectra full scan, ions with m/z ranging from 300 to 1,400 were acquired by Orbitrap mass analyzer at a high resolution of 60,000. The automatic gain control (AGC) target value was set at 4.0E+05. The maximal ion injection time was 50 ms. MS2 Spectra acquisition was performed in quadrupole isolation mode with an isolation window of 1.6 m/z. Precursor ions were selected and fragmented with higher energy collision dissociation (HCD) with a normalized collision energy of 30%. Fragment ions were analyzed using an ion trap mass analyzer with an AGC target value of 5E+04 at a high resolution of 15,000, with a maximal ion injection time of 22 ms. Peptides that triggered MS/MS scans were dynamically excluded from further MS/MS scans for 18 s. All data were acquired using the Xcalibur software (Thermo Fisher Scientific).
Peptide identification and label-free-based protein quantification. MS raw files were searched against the NCBI human Refseq protein database (released on 04-07-2013; 32,015 entries) with MaxQuant software, using the integrated Andromeda search engine with the false discovery rate (FDR) <1% at peptide and protein levels. The mass tolerances were 20 ppm for the precursor and 0.5 Da for productions collected by Fusion Lumos. The proteolytic cleavage sites were K and R. Up to two missed cleavages were allowed. The database search considered cysteine carbamidomethylation as a fixed modification and N-acetylation and oxidation of methionine as variable modifications. All identified peptides were quantified in MaxQuant derived from their MS1 intensity. Peptide FDR was adjusted to 1%. For protein quantification, we used intensity-based label-free quantification, known as the iBAQ algorithm, which divided the protein abundance (derived from identified peptides’ intensities) by the number of theoretically observable peptides. A match between runs (MBR) (32) was enabled to transfer the identification between separate LC-MS/MS runs based on their accurate mass and retention time after retention time alignment. The z-score was calculated using the equation z=(x−μ)/σ, where μ stands for the mean of the samples’ iBAQ and σ stands for the standard deviation of the samples.
Bioinformatics and statistical analysis for MS data. Principal component analysis (PCA) of 10 body fluids was performed using the FactoMineR package (version 2.4) (33). The protein expression matrix of 10 body fluids was used to identify the proteomic clusters using the consensus clustering method implemented in the R package ConsensusClusterPlus v.3.8 (34). Consensus clustering analysis of the proteomic profiles identified four clusters of 10 body fluids based on the 1,500 most variable proteins (proteins with the top 44% standard deviations). The cluster analysis was performed using k-means, with the following setting: maxK=8, reps=10,000, pItem=0.8, pFeature=1, clusterAlg="hc", distance="pearson" for the clustering runs. Preferred cluster results were selected by considering the profiles of the consensus cumulative distribution function (CDF) and delta area under the CDF curve for clustering solutions between 2 and 8 clusters. The rank survey profiles of the consensus CDF and the delta area under the CDF curve indicated a four-cluster solution for 10 body fluids using the proteomic data. Hierarchical clustering was performed using the pheatmap (Pretty Heatmaps) function in the R package (pheatmap, version 1.0.8). The Gene Ontology (GO) biological process (GO-BP), the GO cellular component (GO-CC) and GO molecular function (GO-MF) terms, and the Kyoto Encyclopedia of Genes and Genomes (KEGG) pathways that were enriched in the sets of enriched genes were determined using the Database for Annotation, Visualization and Integrated Discovery (35) Bioinformatics Resource v 6.8. The values of p<0.05 and FDR<0.05 (adjusted by Bonferroni and Benjamini) were considered to determine the statistically significant results of GO-BP, GO-CC, GO-MF and KEGG enrichment. Pearson’s correlation analysis was used to calculate the correlation coefficients (r) among 10 body fluids.
Data availability. The accession number for the MS proteomics data reported in this paper is iProX repository (www.iprox.org) (36): Project ID IPX0002854000 and ProteomeXchange ID PXD024255.
Results
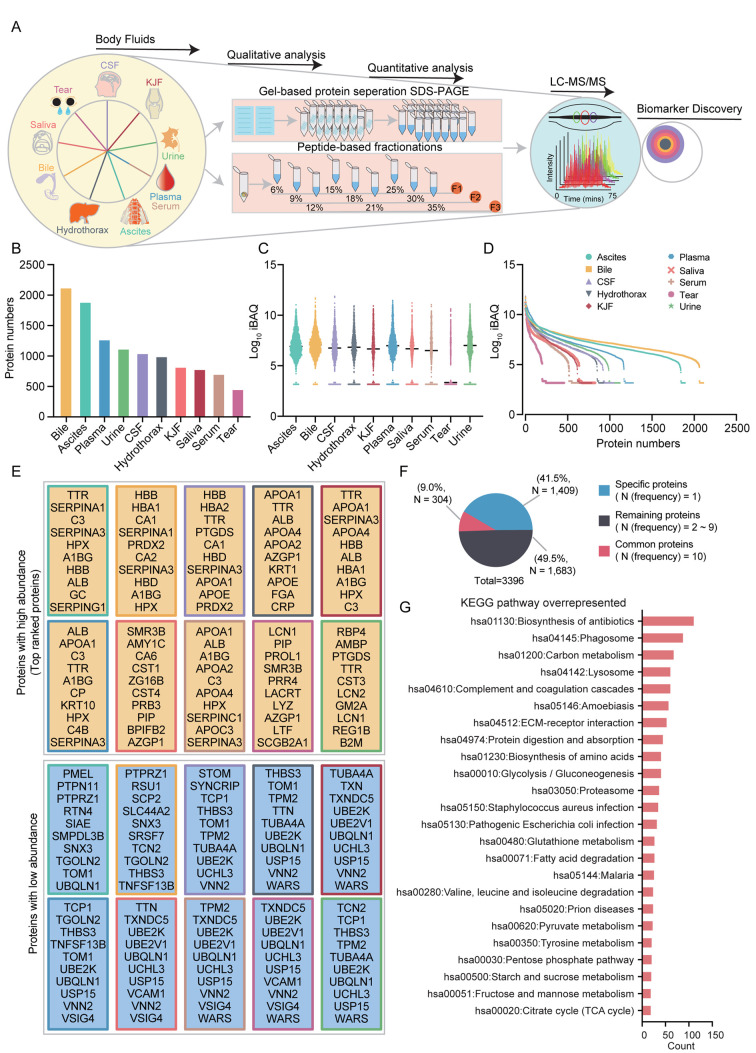
Proteomic analysis of 10 body fluids. In this study, we conducted proteome profiling of 10 human body fluids (ascites, bile, CSF, hydrothorax, KJF, plasma, saliva, serum, tears, and urine) through gel-based protein separation (SDS-PAGE) or peptide-based fractionations and then LC-MS/MS identification with Orbitrap Fusion Lumos (Figure 1A). For gel-based protein separation, we obtained the gel-band fractions of body fluids as follows: ascites (31 fractions), bile (12 fractions), CSF (17 fractions), hydrothorax (19 fractions), KJF (17 fractions), plasma (28 fractions), serum (18 fractions), and urine (9 fractions). For peptide-based fractionations, we combined the nine fractions into three fractions: F1 (6%+15%+25%), F2 (9%+18%+30%), and F3 (12%+21%+35%). Overall 157 raw files of body fluids were obtained. The high-resolution tandem mass spectra were searched against the human RefSeq protein database and then imported into the MaxQuant software to estimate the false discovery rates for the proteins. Matches between runs were adopted for fractions within one body fluid. The FDRs for protein identifications were controlled to less than 1%. A total of 3,396 proteins were identified from the MS raw data. For samples such as bile, ascites, and plasma that were separated with SDS-PAGE, the number of protein identifications was higher than the proteins identified in saliva and tears. A combined list of 2,109, 1,892, and 1,277 proteins were identified in the bile, ascites, and plasma, respectively. A total of 827 and 459 proteins were identified in the untreated saliva and tear fluid, respectively (Figure 1B).
Figure 1. Summary of the proteomic analysis of body fluids. (A) Schematic illustration of the experimental workflow. Two strategies for body fluids were adopted: in one, the proteins were separated on SDSPAGE and in-gel digested with trypsin; in the other, the proteins were digested in-solution. The peptides were then analyzed by liquid chromatography tandem mass spectrometry (LC-MS/MS) using an Orbitrap Fusion Lumos. (B) The bar plot indicates the number of proteins detected in ten body fluids. (C) The boxplot illustrates the protein abundance of ten body fluids. (D) Dynamic range of ten body fluids, based on protein abundance [Log 10 (iBAQ)]. (E) List of proteins with high abundance or low abundance of each body fluid. (F) Pie chart showing the protein identification among ten body fluids. (G) The KEGG pathways of all identified proteins in ten body fluids. KJF: Knee-joint fluid; CSF, cerebrospinal fluid; KEGG: Kyoto Encyclopedia of Genes and Genomes; TCA: tricarboxylic acid cycle.
Quantification of the body fluids proteome. Using the intensity-based absolute quantification (iBAQ) algorithm, we estimated the overall distribution of the protein abundance in 10 body fluids based on the original quantitative information detected by label-free quantification. The proteome quantification results of 10 body fluid experiments were relatively comparable, as their medians were on the same level (Figure 1C). In 10 body fluid proteomes, the iBAQ values varied by approximately 3 to 12 orders of magnitude, indicating a highly dynamic range (Figure 1D). The top 10 ranked proteins with high or low abundance of 10 body fluids are listed as shown in Figure 1E. We found that plasma and serum were enriched by plasma lipoproteins such as APOA1, APOA2, APOA3, and APOA4, and complement activation regulators such as C3 and C4B. In addition, the proteins involved in complement and coagulation cascades such as FGA, SERPINA1, SERPINC1, and SERPING1, were also overrepresented in other body fluids such as ascites, bile, and hydrothorax. The low abundance proteins of 10 body fluids were almost involved in immune system and immune response, e.g. UBE2V1, UBE2K, PTPN11, TNFSF13B, and VCAM1. For all 3,396 proteins identified by LC-MS/MS analysis, approximately 58.5% (1,987) were identified in at least two body fluids, of which 9.0% (304) were commonly identified in 10 body fluids, and the remaining 41.5% (1,409) of “specific” proteins were identified in only one body fluid (Figure 1F).
The overall proteomic characterization of body fluids. Gene Ontology (GO) annotation and Kyoto Encyclopedia of Genes and Genomes (KEGG) pathway analysis of the relative abundances of all identified proteins across 10 body fluids were performed. A total of 3,396 proteins were clustered into 262, 300, and 797 terms in the GO cellular component (GO-CC), molecular function (GO-MF), and biological process (GO-BP) categories, respectively. Among them, 125 (47.4%), 96 (32.0%), and 205 terms (25.7%) exhibited significance (p<0.001) as the overrepresented terms in GO-CC, GO-MF, and GO-BP, respectively. The overrepresented terms were filtered with a count of more than 20, enrichment greater than 2-fold, and FDR less than 0.001. In the GO-CC category, GO terms related to extracellular proteins such as extracellular exosome (1,695 proteins found), extracellular space (611), and extracellular matrix (202) were overrepresented. GO terms related to plasma membrane proteins (105, FDR=5.20E-12), blood microparticle (101, FDR=2.22E-37), and lysosome proteins (96, FDR=3.82E-16) were overrepresented. In the GO-MF category, most proteins (156, FDR=1.08E-38) were clustered into cadherin binding involved in cell-cell adhesion, as expected. As for the GO-BP category, the top ranked terms were platelet degranulation (81, FDR=3.10E-35), cell adhesion (206, FDR=3.10E-35), proteolysis (189, FDR=2.28E-21), cell-cell adhesion (140, FDR=4.04E-31), and extracellular matrix organization (105, FDR=1.86E-24). The KEGG pathway analysis identified 48 overrepresented terms, which were clustered into 2 major systems: immune system and metabolism system. The immune system included biosynthesis of antibiotics (112, FDR=1.03E-15), phagosome (89, FDR=3.08E-16), complement and coagulation cascades (62, FDR=5.57E-26), and extracellular matrix (ECM)-receptor interaction (54, FDR=7.51E-11). The metabolism system was composed of carbon metabolism (69, FDR=1.92E-13), glycolysis/gluconeogenesis (42, FDR=1.35E-8), glutathione metabolism (28, FDR=1.83E-4), fatty acid degradation (28, FDR=1.62E-6), pyruvate metabolism (24, FDR=1.38E-4), and tyrosine metabolism (22, FDR=1.36E-4) (Figure 1G). These findings presented a comprehensive molecular feature of multi-body fluids, pinpointing to the immune and metabolic systems as the main axes of biological function.
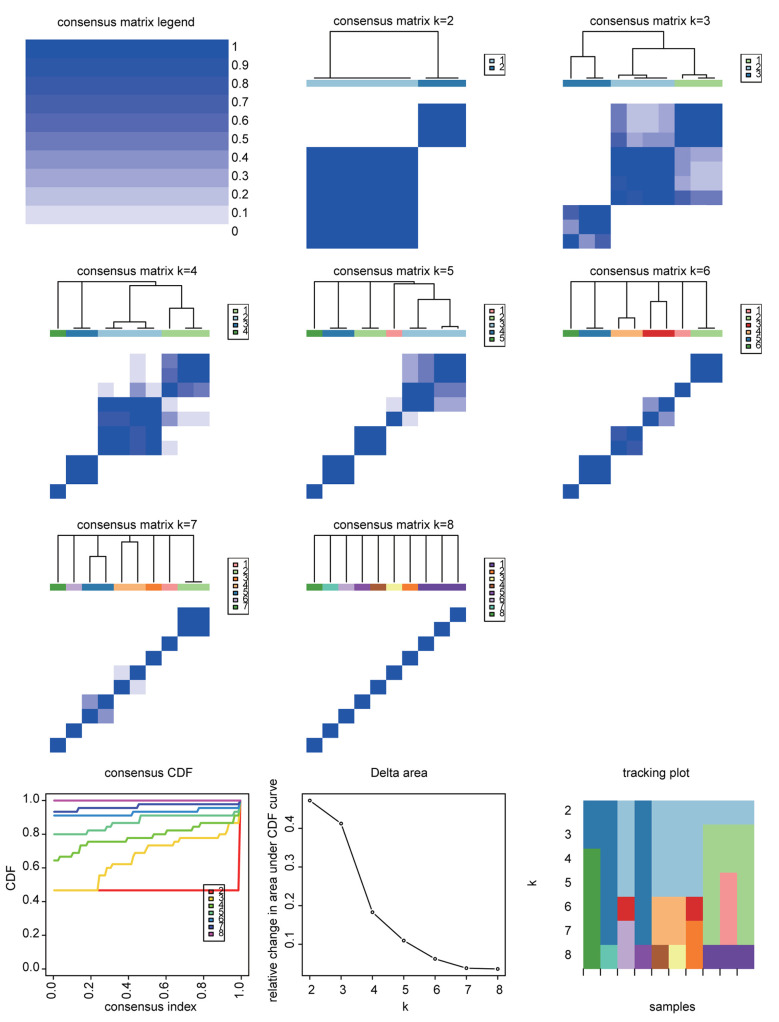
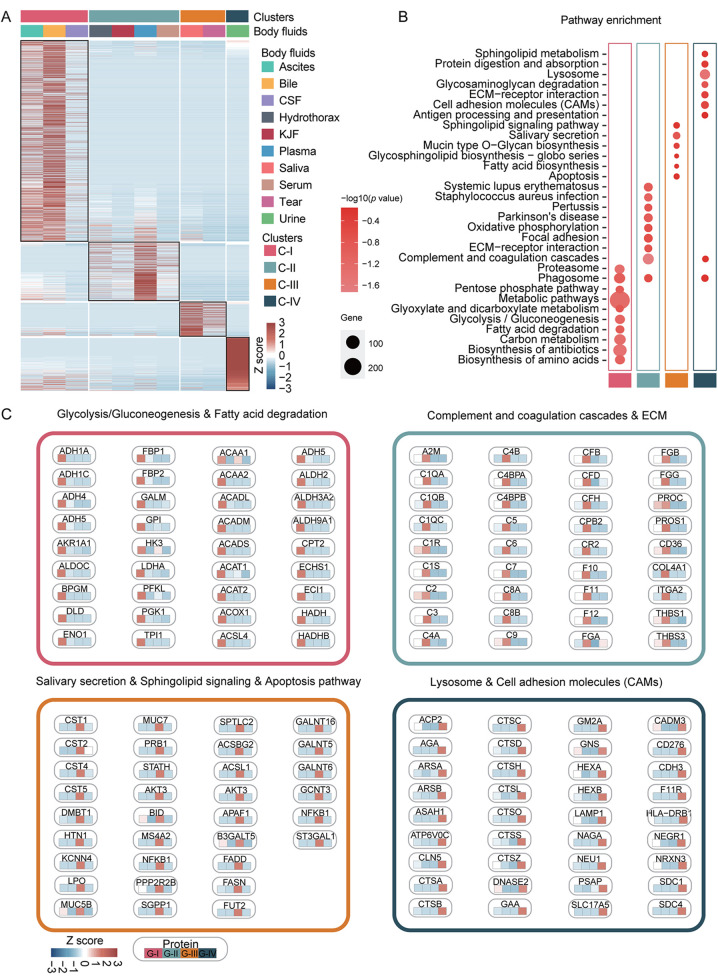
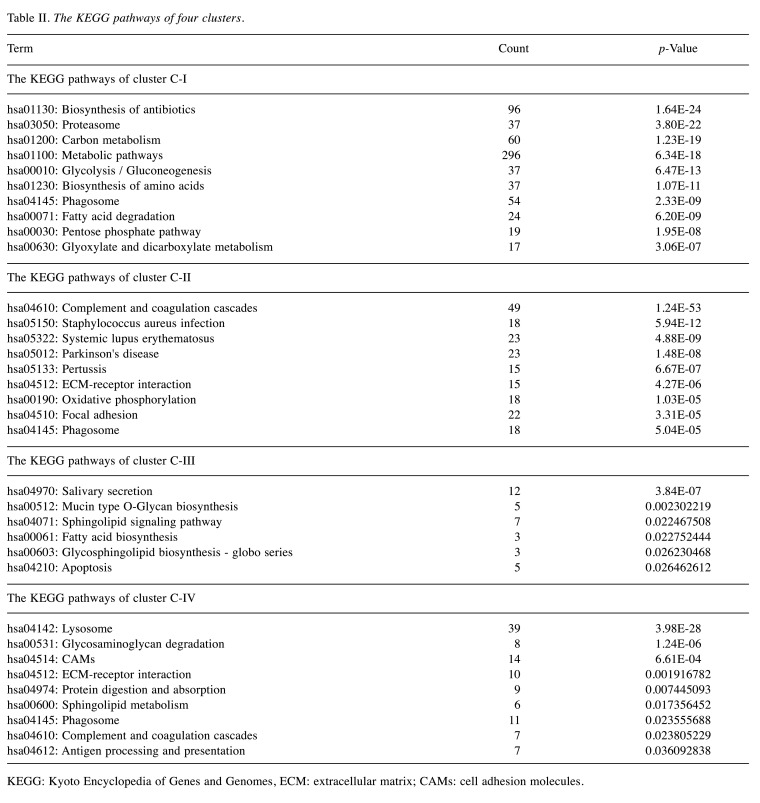
Consensus clustering analysis of 10 body fluids based on proteome. Consensus clustering analysis of the proteomic profiles identified four clusters of 10 body fluids based on the 1,500 most variable proteins (proteins with the top 44% standard deviations) (Figure 2). Ascites, bile, and CSF were grouped into cluster C-I, hydrothorax, KJF, plasma and serum were grouped into cluster C-II, while saliva and tears were grouped into cluster C-III; urine was solely grouped into cluster C-IV (Figure 3A and Table II). The consensus clustering result showed the similarity of biological function in each body fluid cluster. Next, we performed a functional enrichment analysis according to KEGG pathway annotations, and determined the dominant bioprocesses of each cluster (Figure 3B and 3C). The C-I cluster was associated with metabolic bioprocesses, including carbon metabolism (p=1.23E-19) (e.g. GPI, ENO1, G6PD, etc.), glycolysis/ gluconeogenesis (p=6.47E-13) (e.g. ADH1C, ADH1A, PGK1, etc.), fatty acid degradation (p=6.20E-9) (e.g. ACAA1, ACAT1, HADH, etc.), glyoxylate and dicarboxylate metabolism (p=3.06E-7) (e.g. MDH1, GRHPR, PGP, etc.). The C-II cluster, containing hydrothorax, KJF, plasma, and serum, was associated with metabolism-related oxidative phosphorylation (p=1.03E-5) (e.g. NDUFA8, UQCRB, COX7A2, etc.), as well as immune bioprocesses, including complement and coagulation cascades (p=1.24E-53) (e.g. C1QA, C1R, C1S, etc.), ECM-receptor interaction (p=4.27E-6) (e.g. THBS3, ITGA2, CD36, etc.), and focal adhesion (p=3.31E-5) (e.g. COL4A1, VWF, EGFR, etc.). The C-III cluster was characterized with salivary secretion (p=3.84E-7) (e.g. CST1, CST2, DMBT1, etc.), sphingolipid signaling pathway (p=2.25E-2) (e.g. PPP2R2B, SPTLC2, SGPP1, etc.), fatty acid biosynthesis (p=2.28E-2) (e.g. ACSL1, FASN, ACSBG2, etc.), and apoptosis (p=2.65E-2) (e.g. AKT3, FADD, BID, etc.). While in C-IV, the urinary proteome was enriched by lysosome related proteins (such as ATP6V0C, AGA, and CSTC), cell adhesion molecules (CAMs) (such as CD276, CDH3, and HLA-DRB1), and ECM receptors (such as LAMA5, LAMB2, and COL6A3) (Figure 3B and 3C).
Figure 2. The consensus clustering analysis of ten body fluids. The consensus clustering analysis of ten body fluids identified four clusters. k was tested from 2 to 8. Consensus matrices, as well as the consensus cumulative distribution function (CDF) plot, delta area (change in CDF area) plot, and tracking plot are shown.
Figure 3. Proteomic clustering of ten body fluids. (A) The consensus clustering analysis of ten body fluids identified four clusters. The heatmap depicts the relative abundance of the signature proteins in four subtypes (Z score of iBAQ). (B) A bubble plot of the KEGG pathway enrichment of C-I, C-II, C-III, and C-IV is shown. (C) Diagram summarizes the differentially expressed signatures and signaling cascades involved in C-I to CIV. The heatmap under each protein depicts the Z score of average protein abundance in each proteomic subtype. CSF: Cerebrospinal fluid; KJF: knee-joint fluid; ECM: extracellular matrix; KEGG: Kyoto Encyclopedia of Genes and Genomes; TCA: tricarboxylic acid cycle.
Table II. The KEGG pathways of four clusters.
KEGG: Kyoto Encyclopedia of Genes and Genomes, ECM: extracellular matrix; CAMs: cell adhesion molecules.
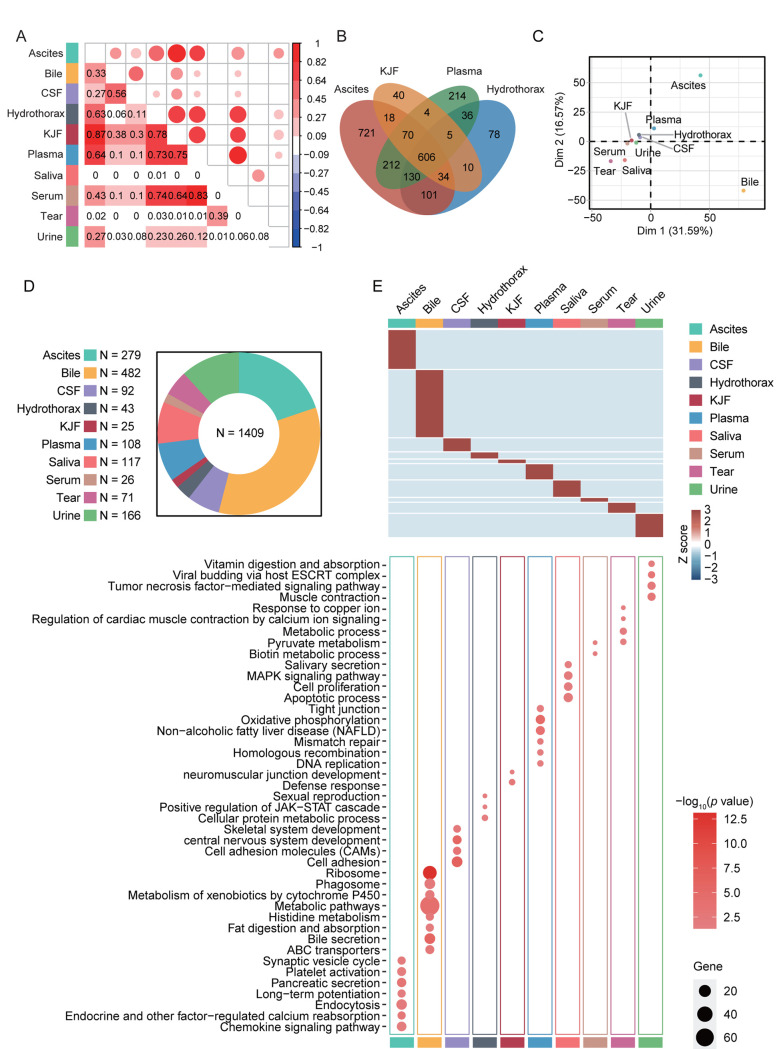
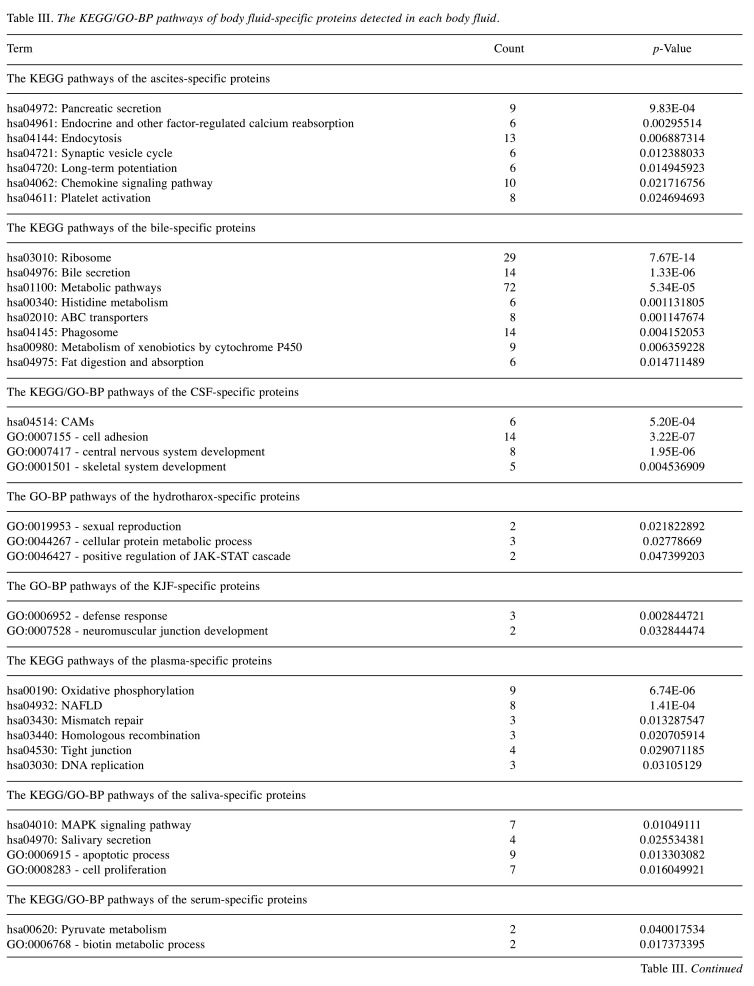
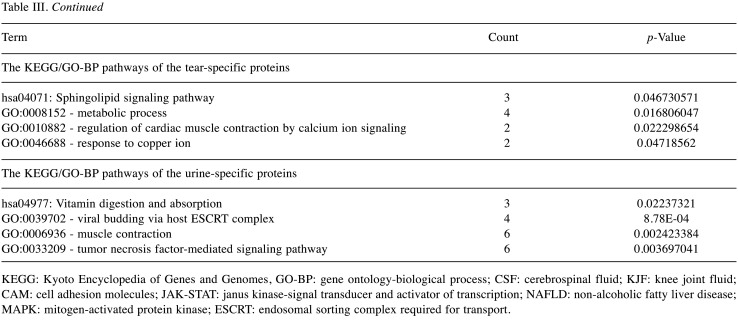
The specific protein components and functional features of 10 body fluids. Correlation coefficients (Pearson’s correlation) among 10 body fluids showed a broad range of 0 to 0.87 (Figure 4A). Among them, ascites showed higher correlation with hydrothorax, KJF, and plasma (r=0.63, 0.87 and 0.64, respectively), of which the latter three body fluids showed higher correlation with each other (r=0.78, 0.73 and 0.75, respectively). Serum highly correlated with hydrothorax, KJF, and plasma (r=0.74, 0.64 and 0.83, respectively). On the contrary, we found that bile showed very low correlation with hydrothorax (r=0.06) and urine (r=0.03). The overlapping protein numbers of ascites, hydrothorax, KJF, and plasma are also respectively shown in Figure 4B. PCA showed that the protein components of 10 body fluids were distinctive (Figure 4C). Furthermore, we performed a comparison of these body fluid proteome datasets. For all 3,396 proteins identified by LC-MS/MS analysis, approximately 58.5% (1,987) were identified in at least two body fluids and the remaining 41.5% (1,409) of “specific” proteins were identified in one body fluid, providing clues that the “specific” proteins can be used for biomarker discovery. In detail, the “specific” proteins identified in ascites, bile, CSF, hydrothorax, KJF, plasma, saliva, serum, tears, and urine were separately 279, 482, 92, 43, 25, 108, 117, 26, 71, and 166, respectively (Figure 4D). The GO and KEGG analysis of the body fluid-specific proteins revealed that the proteins were closely related to the tissues and their adjacent tissues by function (Figure 4E and Table III). For example, the specific proteins identified in ascites and bile were separately clustered into pancreatic secretion (p=9.83E-4) (such as PNLIPRP1, PNLIPRP2, CPA2, CELA2A, and CELA3B) and bile secretion (p=1.33E-6) (such as SCARB1, SLC5A1, ATP1B1, BAAT, and AQP1). Ascites was additionally enriched for long-term potentiation (p=1.49E-2) (e.g. PPP3R1, MAP2K2, PLCB2, etc.), chemokine signaling pathway (p=2.17E-2) (e.g. ROCK1, GRK6, GNB4, etc.), and platelet activation (p=2.47E-2) (e.g. APBB1IP, SYK, COL5A3, etc.). Bile was enriched for metabolic pathways (p=5.34E-5), such as histidine metabolism (p=1.13E-3) (e.g. ALDH3A2, MAOA, HNMT, etc.) and fat digestion and absorption (p=1.47E-2) (e.g. ABCG8, FABP2, NPC1L1, etc.). CSF was enriched for cell adhesion molecules (CAMs) (p=5.20E-4), including NFASC, CDH4, NRXN1, NRXN2, CNTN2, and LRRC4B. Plasma was characterized with oxidative phosphorylation (p=6.74E-6) (e.g. NDUFA8, UQCRB, ATP5I, etc.), mismatch repair and DNA replication (p=1.33E-2, 3.11E-2, respectively) (e.g. RPA1, RPA2, SSBP1, etc.), and tight junction (p=2.91E-2) (e.g. ACTN2, MYH8, ACTG1, etc.). As expected, salivary secretory proteins, including MUC7, KCNN4, CST5, and HTN1, were specifically overrepresented in saliva. In addition, we found that the MAPK signaling pathway (p=1.05E-2) (e.g. MAP2K3, EGF, NFKB1, etc.) was enriched in saliva, while apoptotic process and cell proliferation related bioprocesses were also significantly enriched (p<0.05). Some vitamin digestion- and absorption-related proteins (such as CUBN, LMBRD1, and RBP2) were identified in urine. In addition, tumor necrosis factor-mediated signaling related proteins (such as TNFRSF12A, CD27, RELT, and PSMA8) were also highly expressed in urine.
Figure 4. Correlation analysis among ten body fluids and their specific protein components and functional features. (A) The matrix of correlation plots revealed a highly varied correlation between the proteins’ intensities in ten body fluids. (B) Venn diagram showing proteins that were differentially expressed in these four body fluids (ascites, KJF, hydrothorax, and plasma); protein numbers and proportions in these body fluids are also shown. (C) Principal component analysis (PCA) of the proteome pattern in ten body fluids. (D) Pie chart showing protein identification among ten body fluids. (E) The heatmap depicts the relative abundance of the signature proteins in each body fluid (Z score of iBAQ) (above). A bubble plot of the KEGG pathway enrichment of each body fluid is shown (below). CSF: Cerebrospinal fluid; KJF: knee-joint fluid; ESCRT: Endosomal Sorting Complex Required for Transport; MAPK: mitogen-activated protein kinase; JAK-STAT: janus kinase-signal transducer and activator of transcription; KEGG: Kyoto Encyclopedia of Genes and Genome.
Table III. The KEGG/GO-BP pathways of body fluid-specific proteins detected in each body fluid.
KEGG: Kyoto Encyclopedia of Genes and Genomes, GO-BP: gene ontology-biological process; CSF: cerebrospinal fluid; KJF: knee joint fluid; CAM: cell adhesion molecules; JAK-STAT: janus kinase-signal transducer and activator of transcription; NAFLD: non-alcoholic fatty liver disease; MAPK: mitogen-activated protein kinase; ESCRT: endosomal sorting complex required for transport.
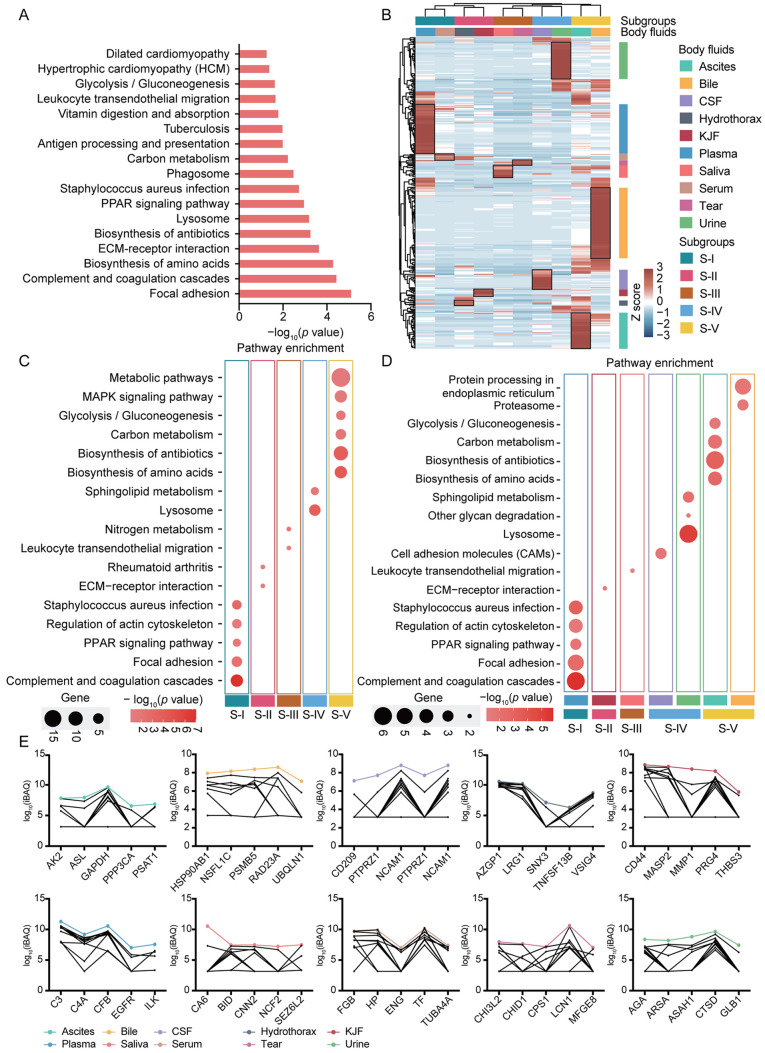
The differential proteins and features of 10 body fluids. A total of 304 proteins (9.0% of all identified proteins) were identified in all analyzed body fluids, which may indicate that these proteins were essential for various life activities. Accordingly, most of these common proteins in body fluids were complement and coagulation components (such as C3, C4A, CPB2, CFB, and FGB), apolipoproteins (such as CDC42, APOA1, and APOA2), and filament tropomyosin (such as TPM1, TPM2, DMTN, EPB41, and ANK1), which may partially be due to the material exchange among body fluids. The commonly identified proteins were functionally categorized based on universal KEGG pathway terms (Figure 5A). The top annotated pathways included focal adhesion (p=7.12E-6) (e.g. LAMA2, EGFR, THBS3, etc.), complement and coagulation cascades (p=3.32E-5) (e.g. FGB, C3, C4A, etc.), biosynthesis of amino acids (p=4.69E-5) (e.g. PKM, TPI1, CPS1, etc.), ECM-receptor interaction (p=2.08E-4) (e.g. LAMA2, COL5A1, COL6A2, etc.), biosynthesis of antibiotics (p=5.04E-4) (e.g. PGM1, PFKP, BCAT2, etc.), and lysosome (p=5.86E-4) (e.g. AGA, CTSD, CTSS, etc.). Metabolic pathways such as carbon metabolism (p=5.40E-3), vitamin digestion and absorption (p=1.47E-2) and glycolysis/gluconeogenesis (p=2.13E-2) were also highly activated.
Figure 5. The differential features of common proteins identified in ten body fluids. (A) Bar plots depict KEGG pathways of commonly identified proteins among ten body fluids. (B) Hierarchical clustering based on the iBAQ quantification. (C) A bubble plot of the KEGG pathway enrichment of S-I, S-II, S-III, S-IV and S-V is shown. (D) A bubble plot of the KEGG pathway enrichment of some body fluids is shown. (E) The line charts of overrepresented proteins of ten body fluids. PPAR: Peroxisome proliferator-activated receptor; ECM: extracellular matrix; CSF: cerebrospinal fluid; KJF: knee joint fluid; MAPK: mitogen-activated protein kinase; KEGG: Kyoto Encyclopedia of Genes and Genome.
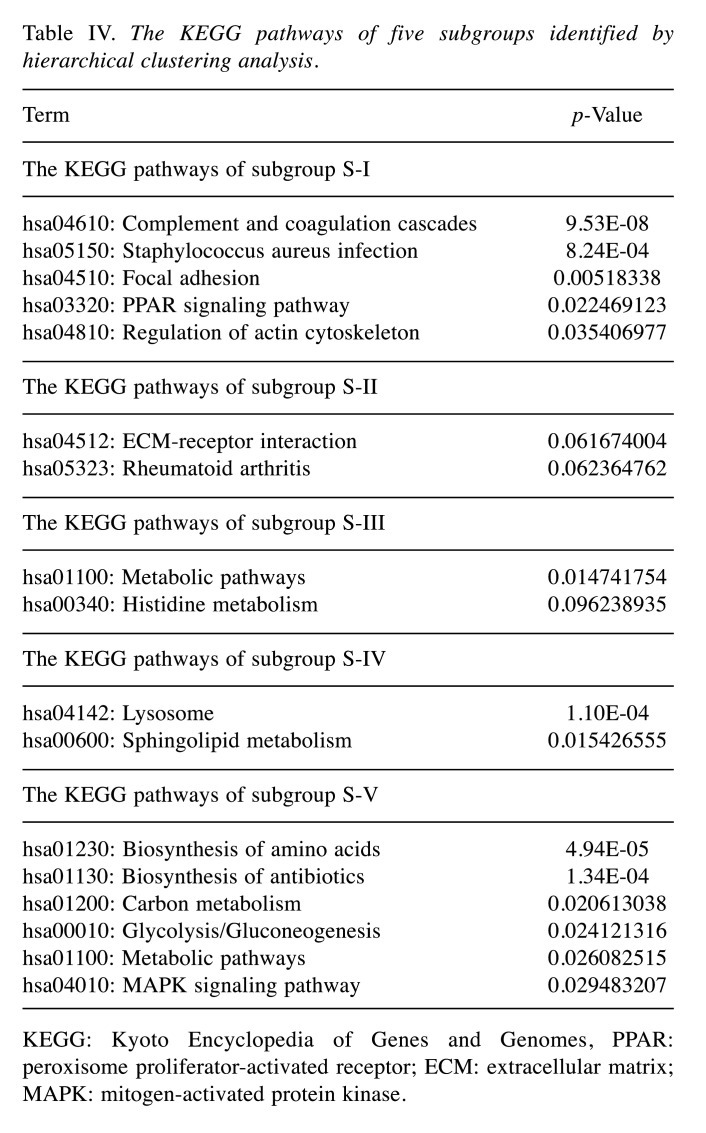
The above enrichment results enabled us to classify the data into categories by a cluster analysis (Figure 5B). Based on an unsupervised hierarchical clustering analysis, the plasma and serum (S-I), hydrothorax and KJF (S-II), saliva and tears (S-III), CSF and urine (S-IV), ascites and bile (S-V), were separately clustered into five subgroups; the five subgroups were identified as significantly different compared with each other. Furthermore, the KEGG pathway enrichment analysis showed the most dominant features among the five subgroups. For example, complement and coagulation cascades (p=9.53E-8), lysosome (p=1.10E-4), and metabolic pathways (p=2.61E-2) were separately dominant in S-I, S-IV, and S-V (Figure 5C and Table IV). We further explored the main functional feature of body fluids corresponding to one subgroup. The KEGG enrichment analysis showed that in the S-IV subgroup, urine was associated with lysosome (p=8.10E-6) and sphingolipid metabolism (p=5.82E-3), while in CSF, CAMs (p=1.71E-2) were enriched. In another example, in subgroup S-V, ascites was associated with metabolism-related pathways, such as biosynthesis of amino acids (p=1.90E-3), biosynthesis of antibiotics (p=6.98E-4), carbon metabolism (p=6.79E-3), and glycolysis/gluconeogenesis (p=2.25E-2); bile was characterized by protein processing in endoplasmic reticulum (p=1.48E-2) and proteasome (p=2.55E-2) (Figure 5D and Table IV). The features of body fluids were consistent with the features of the respective subgroup. In Figure 5E, the overrepresented proteins of 10 body fluids are listed; C3, C4A, CFB, EGFR, and ILK were highly expressed in plasma; AGA, ARSA, ASAH1, CTSD, and GLB1 were enriched in urine.
Table IV. The KEGG pathways of five subgroups identified by hierarchical clustering analysis.
KEGG: Kyoto Encyclopedia of Genes and Genomes, PPAR: peroxisome proliferator-activated receptor; ECM: extracellular matrix; MAPK: mitogen-activated protein kinase.
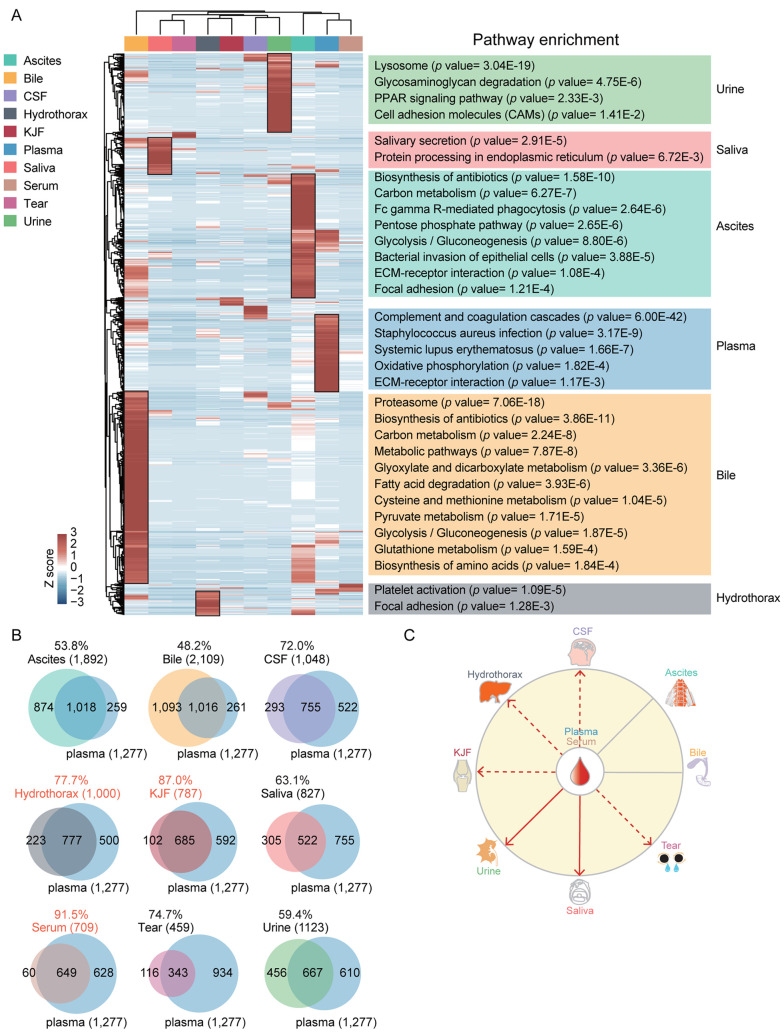
For the 1,683 proteins (49.5% of all identified proteins), which were identified in at least two body fluids, we performed the same unsupervised hierarchical clustering analysis, and arrived at a similar clustering result, of which saliva and tears, hydrothorax and KJF, CSF and urine, and plasma and serum, were clustered into one subgroup, respectively (Figure 6A). Regarding these proteins, the KEGG enrichment result revealed the differential functions of each body fluid. Specifically, urine-enriched proteins were mainly related to lysosome, saliva-enriched proteins were mainly involved in salivary secretion, ascites-enriched and bile-enriched proteins were important in metabolic bioprocesses, hydrothorax-enriched proteins were mainly involved in platelet activation and focal adhesion pathways, while plasma-enriched proteins in the immune and complement system.
Figure 6. Possible association between the different body fluids. (A) Hierarchical clustering based on the iBAQ quantification. (B) Venn diagram showing proteins that were differentially expressed in the plasma and other nine body fluids, the protein numbers and proportions in other nine body fluids are also shown. (C) The model illustrating the association among body fluids. The solid lines indicate known relationships among different body fluids, whereas dashed lines are used for our proposed relationships. CSF: Cerebrospinal fluid; KJF: knee joint fluid.
The possible connection between different body fluids. Blood (plasma or serum) plays a central role in circulation, while the other 8 body fluids might connect with blood directly or indirectly. The comparisons between plasma and other 9 body fluids revealed that the overlap between plasma and KJF was the second high (87.0%) after serum (91.5%) (Figure 6B). In addition, we also found the hydrothorax, tears, and CSF showed a larger overlap proportion with plasma (77.7%, 74.7%, and 72.0%, respectively). The KEGG pathways of plasma and CSF were similar to each other, mainly the ones related to immune function (complement and coagulation cascades, and platelet activation) (Figure 6A). As shown in Figure 6C, a model was built for illustrating the possible connection between different body fluids based on previous reports (37) and the results in this study. The protein compositions and functional annotations showed that the plasma, hydrothorax, and KJF were more similar than the other fluids, suggesting that a great deal of material exchanges occurred among them.
Discussion
Human body fluids have been an important material for disease diagnosis, having many advantages including minimum cost, noninvasiveness, and ease of sample collection. Therefore, measuring biomolecules in body fluids or tissues for diagnosis, monitoring, and prognostic purposes is key to help clinicians and guide decision making for treatment, patient management, and the development of drugs and prevention strategies. Recently, several large-scale proteomic studies of body fluids were conducted. The Plasma Proteome Database (PPD; http://www.plasmaproteomedatabase.org/) (38,39) contains information on 10,546 proteins detected in serum/plasma linked to 509 scientific articles, 3,784 of which were reported in at least two research articles in the 2014 updated version. In addition, Mann’s group reported that the human urinary proteome contains more than 1,500 proteins which include a large proportion of membrane proteins. The latest largest-scale human CSF proteome identified 3,256 nonredundant proteins (40). Compared with plasma/serum, urine, CSF, saliva, bile, tears and ascites, the proteomes of hydrothorax and KJF are less studied. Even though the open-access online repositories of some human body fluids such as plasma (http://www.plasmaproteomedatabase.org/) (38,39), urine (http://urineproteomics.org/databases.html) (41), and saliva (https://www.jcvi.org/research/saliva-proteome-database) (42), have been described. The characterization of sample matrices taken from other human body fluids is still not fully comprehensive.
With the development of LC-MS/MS technology, protein biomarker discovery has become one of the main applications of proteomics. Considering the advantages of body fluids, analysis of human body fluid proteomes has become one of the most promising approaches to discover biomarkers for human diseases.
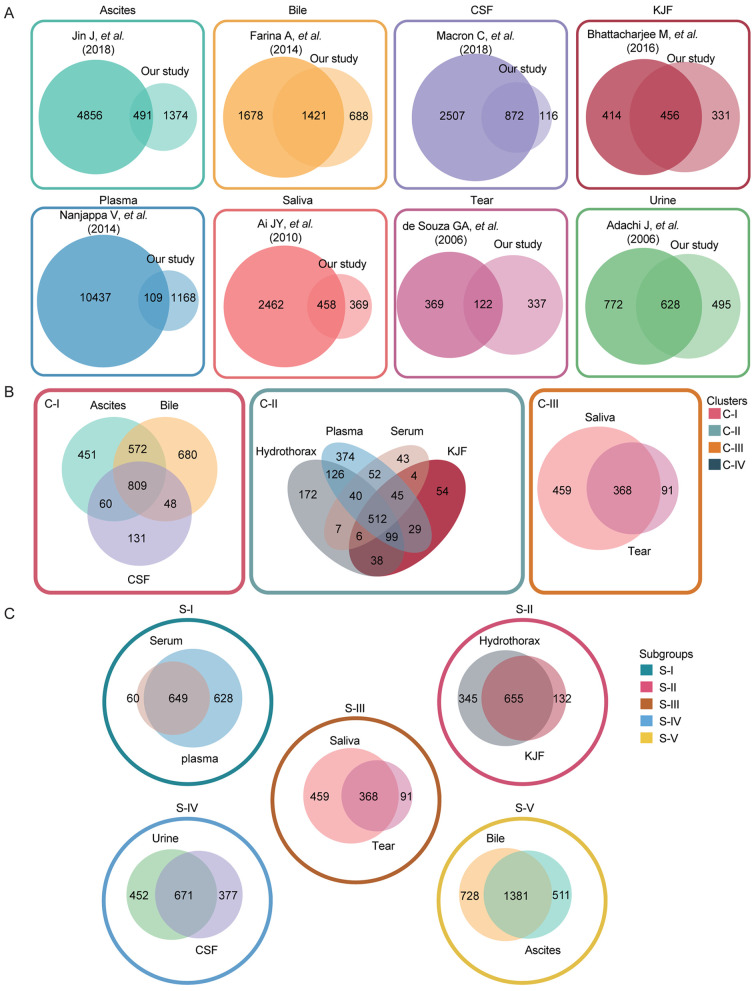
Here, we performed a label-free proteomic analysis on ten body fluids from 23 patients diagnosed with 19 common diseases, and identified a total of 3,396 nonredundant proteins. The body fluids in the study included ascites, bile, CSF, hydrothorax, KJF, plasma, saliva, serum, tear fluid and urine. In our study, we found 1,374, 688, 116, 331, 1,168, 369, 337 and 495 proteins in ascites, bile, CSF, KJF, plasma, saliva, tear fluid and urine, respectively, that were not reported in previously published proteomic datasets of body fluids (Figure 7A). Nevertheless, some of the proteins that we identified had also been included in previous studies. Specifically, Jin et al. identified 4,856 specific proteins in the ascitic fluids from gastric cancer; 491 of these proteins were also detected in ascites, in the present study (43). Farina et al. identified 1,678 bile-specific proteins, 1,421 of which were common with our results (44). Macron et al. identified 3,379 proteins in CSF samples from normal human. Compared with normal CSF proteome, our study identified 872 commonly shared proteins (such as OMG, SNCA, APOA1, APOE, APOM) in the CSF (45). The additional 116 proteins specifically identified in our study might provide potential biomarkers for the diagnosis of subarachnoid hemorrhage (SAH), chair deformity with syringomyelia, and the right cerebellar hemangioblastoma. Bhattacharjee et al. identified 870 proteins in total in synovial fluid and among them, 456 proteins overlapped with the proteome of KJF in our study (46). Nanjappa et al. updated the PPD in 2014 and identified 10,546 proteins of plasma in total; among them, 109 proteins were also identified in the current study. Compared with the published saliva proteome data, our study identified 458 overlapping proteins, which accounted for 15.7% of the 2,462 proteins identified by Ai et al. in 2010 (47). Mann’s group researchers, de Souza et al. and Adachi et al. identified 491 and 1,500 proteins in tear fluid proteome (48) and urinary proteome (22) of healthy donors separately, of which, 122 and 628, respectively, were commonly identifiable in our study. Compared with the published proteomic data, 495 urinary proteins were specific identified in our study, which might be associated with these diseases, such as hepatitis B cirrhosis, abdominal aortic aneurysm, and liver lesions.
Figure 7. Venn diagram comparing the proteome of body fluids. (A) The protein datasets of eight body fluids including ascites, bile, CSF, KJF, plasma, saliva, tear and urine in this study were compared to the published proteome data of eight body fluids. (B) Venn diagram showing proteins differentially expressed in three clusters (C-I, C-II, and C-III); protein numbers and proportions are also shown. (C) Venn diagram showing proteins differentially expressed in five subgroups (S-I, S-II, S-III, S-IV, and S-V); protein numbers and proportions are also shown. SCF: Cerebrospinal fluid; KJF: knee joint fluid.
We presented a comprehensive proteome landscape, and consensus clustering identified four clusters (C-I to C-IV) with distinct proteome features: C-I (glycolysis/gluconeogenesis and fatty acid degradation), C-II (complement/coagulation cascades and ECM), C-III (salivary secretion, sphingolipid pathway, and apoptosis) and C-IV (lysosome and cell adhesion molecules). The consensus clustering analysis revealed the high similarity of proteome profiles among body fluids within one cluster, such as ascites, bile, and CSF within C-I cluster (Figures 2 and 3A). The overlap among body fluids within one cluster is shown in Figure 7B, implying the exchange of many proteins among these body fluids. We determined the body fluid-specific proteins and biological function, which might be applicable for disease diagnosis. For example, bile-enriched proteins were mainly involved in bile secretion and saliva-enriched proteins in salivary secretion. We also observed the obvious enrichment of metabolic pathways such as histidine metabolism and fat digestion/absorption in bile, revealing its metabolic function.
In addition, we made a multi-dimensional analysis based on the body fluid-common proteins. The hierarchical clustering analysis of the commonly identified proteins in ten body fluids revealed five subgroups, and the overlap of two body fluids within one subgroup (S-I to S-V) are shown in Figure 7C. The subgrouping of common proteins (304) in ten body fluids revealed the shared function; for example, the major biological function of plasma and serum was immune-related complement/coagulation cascades, as expected. The functional analysis of the remaining 1,683 proteins demonstrated a similar function clustering.
Human plasma has innumerable links with other body fluids, which has a potentially important impact on the human body. Taking this into consideration, we proposed a model illustrating the possible connection of plasma with these body fluids, which provided an additional layer for a deep understanding of the human body. We supposed that KJF may enter the plasma through an unknown mechanism due to 87% overlap between KJF and plasma, implying the potential application of plasma biomarkers in KJF. Additionally, combined with previous studies related to multiple sclerosis, we also proposed a possible clue between CSF and plasma. The focus of many research works has been to expand the pool of available biomarkers in precision medicine and personalized nutrition for many years. The integrated proteomic profiling of ten body fluids provided an overall cognition and understanding of the associations and differences among these fluids. Identification of specificity and commonality of these samples at the molecular level may also facilitate with biomarker discovery and their use in the clinical setting.
The present study provides a rich resource for the proteome of human body fluids. The development of new biomarkers may improve the accuracy of diagnosis and therapy of many diseases, including cancer; thus, allowing clinical oncology to enter the area of precision medicine. CSF is a source of brain tumor biomarkers. Brain tumor can cause hemorrhage; it has been reported that the incidence of hemorrhage from pituitary adenoma is higher than other brain tumors (49). In this study, we included one SAH patient and identified 116 new proteins in CSF that have not been reported in previous studies. The differences between proteomes of SAH and brain tumor with hemorrhage may increase the accuracy of CSF biomarkers for brain tumor diagnosis. Further larger studies are needed to establish a proteome baseline of CSF.
In addition, urine is also a desirable material for the diagnosis and classification of diseases and can prove useful in biomarker discovery. As shown in Table V, we searched our urinary proteome data for common disease-associated urine markers and found 23 markers associated with arthritis. These included ACAN, ADAMTS1, ADAMTS2, ANXA5, BSG, CD5L, CILP, COMP, CRP, CSTA, FLG, GPI, HLA-DRB1, IL1RN, ITIH1, ITIH3, LCN2, MMP9, ORM2, PRTN3, S100A8, S100A9 and TIMP1. Besides that, we also identified 13 markers associated with myositis, such as CANX, DES, HLA-A, HLA-DRB1, ICAM1, KRT10, KRT6A, KRT9, MB, MYOM1, PCDHB12, PRNP and SERPINA3. In our study, diabetes-related urine markers DPP4, REG1A and REG1B were also detected.
Table V. Common diseases and their associated body fluids markers.
In conclusion, a comprehensive proteome draft of ten human body fluids, including ascites, bile, CSF, hydrothorax, KJF, plasma, saliva, serum, tear fluid, and urine, was obtained using MS-based shotgun proteomics. The proteome profiling revealed the common functions in focal adhesion and complement/ coagulation cascades, and body-specific protein and function features, and the unknown associations among body fluids. The result provides an original shared data resource, contributing to the understanding of human body fluids.
Conflicts of Interest
The Authors have no conflicts of interest to declare.
Authors’ Contributions
Conceptualization, Li Y. and Ding C.; Investigation, Xun D., Li L. and Wang B.; Resources, Lv J., Liu H. and Chen X.; Data Curation, Xun D., Lv J., Zhu L., Ma F., and Tian S.; Writing, Li Y. and Ding C.; Funding Acquisition, Ding C.
Acknowledgements
This work is supported by the Chinese Ministry of Science and Technology (2016YFA0502500), National International Cooperation Grant (2014DFB30010), National Program on Key Basic Research Project (973 Program, 2012CB910300, 2014CBA02000), National High-tech R&D Program of China (863 program, 2014AA020201), National Natural Science Foundation of China (31270822) and Beijing Natural Science Foundation (Z131100005213003). We thank Dr. Shen Nan from Shanghai Children’s Medical Center, Shanghai Jiao Tong University School of Medicine for revising the manuscript.
References
- 1.Peffers MJ, McDermott B, Clegg PD, Riggs CM. Comprehensive protein profiling of synovial fluid in osteoarthritis following protein equalization. Osteoarthritis Cartilage. 2015;23(7):1204–1213. doi: 10.1016/j.joca.2015.03.019. [DOI] [PMC free article] [PubMed] [Google Scholar]
- 2.Aebersold R, Mann M. Mass spectrometry-based proteomics. Nature. 2003;422(6928):198–207. doi: 10.1038/nature01511. [DOI] [PubMed] [Google Scholar]
- 3.Yates JR 3rd. Mass spectral analysis in proteomics. Annu Rev Biophys Biomol Struct. 2004;33:297–316. doi: 10.1146/annurev.biophys.33.111502.082538. [DOI] [PubMed] [Google Scholar]
- 4.Veenstra TD, Conrads TP, Hood BL, Avellino AM, Ellenbogen RG, Morrison RS. Biomarkers: mining the biofluid proteome. Mol Cell Proteomics. 2005;4(4):409–418. doi: 10.1074/mcp.M500006-MCP200. [DOI] [PubMed] [Google Scholar]
- 5.Schulze WX, Usadel B. Quantitation in mass-spectrometry-based proteomics. Annu Rev Plant Biol. 2010;61:491–516. doi: 10.1146/annurev-arplant-042809-112132. [DOI] [PubMed] [Google Scholar]
- 6.Gygi SP, Corthals GL, Zhang Y, Rochon Y, Aebersold R. Evaluation of two-dimensional gel electrophoresis-based proteome analysis technology. Proc Natl Acad Sci USA. 2000;97(17):9390–9395. doi: 10.1073/pnas.160270797. [DOI] [PMC free article] [PubMed] [Google Scholar]
- 7.Margolis J, Kenrick KG. 2-dimensional resolution of plasma proteins by combination of polyacrylamide disc and gradient gel electrophoresis. Nature. 1969;221(5185):1056–1057. doi: 10.1038/2211056a0. [DOI] [PubMed] [Google Scholar]
- 8.Tang J, Gao M, Deng C, Zhang X. Recent development of multi-dimensional chromatography strategies in proteome research. J Chromatogr B Analyt Technol Biomed Life Sci. 2008;866(1-2):123–132. doi: 10.1016/j.jchromb.2008.01.029. [DOI] [PMC free article] [PubMed] [Google Scholar]
- 9.Zhao YY, Lin RC. UPLC-MS(E) application in disease biomarker discovery: the discoveries in proteomics to metabolomics. Chem Biol Interact. 2014;215:7–16. doi: 10.1016/j.cbi.2014.02.014. [DOI] [PubMed] [Google Scholar]
- 10.Unlü M, Morgan ME, Minden JS. Difference gel electrophoresis: a single gel method for detecting changes in protein extracts. Electrophoresis. 1997;18(11):2071–2077. doi: 10.1002/elps.1150181133. [DOI] [PubMed] [Google Scholar]
- 11.Gygi SP, Rist B, Gerber SA, Turecek F, Gelb MH, Aebersold R. Quantitative analysis of complex protein mixtures using isotope-coded affinity tags. Nat Biotechnol. 1999;17(10):994–999. doi: 10.1038/13690. [DOI] [PubMed] [Google Scholar]
- 12.Hoedt E, Zhang G, Neubert TA. Stable isotope labeling by amino acids in cell culture (SILAC) for quantitative proteomics. Adv Exp Med Biol. 2014;806:93–106. doi: 10.1007/978-3-319-06068-2_5. [DOI] [PubMed] [Google Scholar]
- 13.Hoedt E, Zhang G, Neubert TA. Stable isotope labeling by amino acids in cell culture (SILAC) for quantitative proteomics. Adv Exp Med Biol. 2019;1140:531–539. doi: 10.1007/978-3-030-15950-4_31. [DOI] [PubMed] [Google Scholar]
- 14.Ross PL, Huang YN, Marchese JN, Williamson B, Parker K, Hattan S, Khainovski N, Pillai S, Dey S, Daniels S, Purkayastha S, Juhasz P, Martin S, Bartlet-Jones M, He F, Jacobson A, Pappin DJ. Multiplexed protein quantitation in Saccharomyces cerevisiae using amine-reactive isobaric tagging reagents. Mol Cell Proteomics. 2004;3(12):1154–1169. doi: 10.1074/mcp.M400129-MCP200. [DOI] [PubMed] [Google Scholar]
- 15.De Bock M, de Seny D, Meuwis MA, Chapelle JP, Louis E, Malaise M, Merville MP, Fillet M. Challenges for biomarker discovery in body fluids using SELDI-TOF-MS. J Biomed Biotechnol. 2010;2010:906082. doi: 10.1155/2010/906082. [DOI] [PMC free article] [PubMed] [Google Scholar]
- 16.Tolstikov VV, Lommen A, Nakanishi K, Tanaka N, Fiehn O. Monolithic silica-based capillary reversed-phase liquid chromatography/electrospray mass spectrometry for plant metabolomics. Anal Chem. 2003;75(23):6737–6740. doi: 10.1021/ac034716z. [DOI] [PubMed] [Google Scholar]
- 17.Vitorino R, Guedes S, Manadas B, Ferreira R, Amado F. Toward a standardized saliva proteome analysis methodology. J Proteomics. 2012;75(17):5140–5165. doi: 10.1016/j.jprot.2012.05.045. [DOI] [PubMed] [Google Scholar]
- 18.Bantscheff M, Schirle M, Sweetman G, Rick J, Kuster B. Quantitative mass spectrometry in proteomics: a critical review. Anal Bioanal Chem. 2007;389(4):1017–1031. doi: 10.1007/s00216-007-1486-6. [DOI] [PubMed] [Google Scholar]
- 19.Neilson KA, Ali NA, Muralidharan S, Mirzaei M, Mariani M, Assadourian G, Lee A, van Sluyter SC, Haynes PA. Less label, more free: approaches in label-free quantitative mass spectrometry. Proteomics. 2011;11(4):535–553. doi: 10.1002/pmic.201000553. [DOI] [PubMed] [Google Scholar]
- 20.Omenn GS. The Human Proteome Organization Plasma Proteome Project pilot phase: reference specimens, technology platform comparisons, and standardized data submissions and analyses. Proteomics. 2004;4(5):1235–1240. doi: 10.1002/pmic.200300686. [DOI] [PubMed] [Google Scholar]
- 21.Schmidt A, Aebersold R. High-accuracy proteome maps of human body fluids. Genome Biol. 2006;7(11):242. doi: 10.1186/gb-2006-7-11-242. [DOI] [PMC free article] [PubMed] [Google Scholar]
- 22.Adachi J, Kumar C, Zhang Y, Olsen JV, Mann M. The human urinary proteome contains more than 1500 proteins, including a large proportion of membrane proteins. Genome Biol. 2006;7(9):R80. doi: 10.1186/gb-2006-7-9-R80. [DOI] [PMC free article] [PubMed] [Google Scholar]
- 23.Pilch B, Mann M. Large-scale and high-confidence proteomic analysis of human seminal plasma. Genome Biol. 2006;7(5):R40. doi: 10.1186/gb-2006-7-5-r40. [DOI] [PMC free article] [PubMed] [Google Scholar]
- 24.Wilhelm M, Schlegl J, Hahne H, Gholami AM, Lieberenz M, Savitski MM, Ziegler E, Butzmann L, Gessulat S, Marx H, Mathieson T, Lemeer S, Schnatbaum K, Reimer U, Wenschuh H, Mollenhauer M, Slotta-Huspenina J, Boese JH, Bantscheff M, Gerstmair A, Faerber F, Kuster B. Mass-spectrometry-based draft of the human proteome. Nature. 2014;509(7502):582–587. doi: 10.1038/nature13319. [DOI] [PubMed] [Google Scholar]
- 25.Goodison S, Rosser CJ, Urquidi V. Urinary proteomic profiling for diagnostic bladder cancer biomarkers. Expert Rev Proteomics. 2009;6(5):507–514. doi: 10.1586/epr.09.70. [DOI] [PMC free article] [PubMed] [Google Scholar]
- 26.Li C, Zang T, Wrobel K, Huang JT, Nabi G. Quantitative urinary proteomics using stable isotope labelling by peptide dimethylation in patients with prostate cancer. Anal Bioanal Chem. 2015;407(12):3393–3404. doi: 10.1007/s00216-015-8569-6. [DOI] [PubMed] [Google Scholar]
- 27.Øvrehus MA, Zürbig P, Vikse BE, Hallan SI. Urinary proteomics in chronic kidney disease: diagnosis and risk of progression beyond albuminuria. Clin Proteomics. 2015;12(1):21. doi: 10.1186/s12014-015-9092-7. [DOI] [PMC free article] [PubMed] [Google Scholar]
- 28.Ditzen C, Tang N, Jastorff AM, Teplytska L, Yassouridis A, Maccarrone G, Uhr M, Bronisch T, Miller CA, Holsboer F, Turck CW. Cerebrospinal fluid biomarkers for major depression confirm relevance of associated pathophysiology. Neuropsychopharmacology. 2012;37(4):1013–1025. doi: 10.1038/npp.2011.285. [DOI] [PMC free article] [PubMed] [Google Scholar]
- 29.Stoop MP, Coulier L, Rosenling T, Shi S, Smolinska AM, Buydens L, Ampt K, Stingl C, Dane A, Muilwijk B, Luitwieler RL, Sillevis Smitt PA, Hintzen RQ, Bischoff R, Wijmenga SS, Hankemeier T, van Gool AJ, Luider TM. Quantitative proteomics and metabolomics analysis of normal human cerebrospinal fluid samples. Mol Cell Proteomics. 2010;9(9):2063–2075. doi: 10.1074/mcp.M900877-MCP200. [DOI] [PMC free article] [PubMed] [Google Scholar]
- 30.Ramachandran P, Boontheung P, Xie Y, Sondej M, Wong DT, Loo JA. Identification of N-linked glycoproteins in human saliva by glycoprotein capture and mass spectrometry. J Proteome Res. 2006;5(6):1493–1503. doi: 10.1021/pr050492k. [DOI] [PubMed] [Google Scholar]
- 31.Schwanhäusser B, Busse D, Li N, Dittmar G, Schuchhardt J, Wolf J, Chen W, Selbach M. Global quantification of mammalian gene expression control. Nature. 2011;473(7347):337–342. doi: 10.1038/nature10098. [DOI] [PubMed] [Google Scholar]
- 32.Tyanova S, Temu T, Cox J. The MaxQuant computational platform for mass spectrometry-based shotgun proteomics. Nat Protoc. 2016;11(12):2301–2319. doi: 10.1038/nprot.2016.136. [DOI] [PubMed] [Google Scholar]
- 33.Lambert I, Paysant-Le Roux C, Colella S, Martin-Magniette ML. DiCoExpress: a tool to process multifactorial RNAseq experiments from quality controls to co-expression analysis through differential analysis based on contrasts inside GLM models. Plant Methods. 2020;16:68. doi: 10.1186/s13007-020-00611-7. [DOI] [PMC free article] [PubMed] [Google Scholar]
- 34.Wilkerson MD, Hayes DN. ConsensusClusterPlus: a class discovery tool with confidence assessments and item tracking. Bioinformatics. 2010;26(12):1572–1573. doi: 10.1093/bioinformatics/btq170. [DOI] [PMC free article] [PubMed] [Google Scholar]
- 35.Marouga R, David S, Hawkins E. The development of the DIGE system: 2D fluorescence difference gel analysis technology. Anal Bioanal Chem. 2005;382(3):669–678. doi: 10.1007/s00216-005-3126-3. [DOI] [PubMed] [Google Scholar]
- 36.Ma J, Chen T, Wu S, Yang C, Bai M, Shu K, Li K, Zhang G, Jin Z, He F, Hermjakob H, Zhu Y. iProX: an integrated proteome resource. Nucleic Acids Res. 2019;47(D1):D1211–D1217. doi: 10.1093/nar/gky869. [DOI] [PMC free article] [PubMed] [Google Scholar]
- 37.Yan W, Apweiler R, Balgley BM, Boontheung P, Bundy JL, Cargile BJ, Cole S, Fang X, Gonzalez-Begne M, Griffin TJ, Hagen F, Hu S, Wolinsky LE, Lee CS, Malamud D, Melvin JE, Menon R, Mueller M, Qiao R, Rhodus NL, Sevinsky JR, States D, Stephenson JL, Than S, Yates JR, Yu W, Xie H, Xie Y, Omenn GS, Loo JA, Wong DT. Systematic comparison of the human saliva and plasma proteomes. Proteomics Clin Appl. 2009;3(1):116–134. doi: 10.1002/prca.200800140. [DOI] [PMC free article] [PubMed] [Google Scholar]
- 38.Muthusamy B, Hanumanthu G, Suresh S, Rekha B, Srinivas D, Karthick L, Vrushabendra BM, Sharma S, Mishra G, Chatterjee P, Mangala KS, Shivashankar HN, Chandrika KN, Deshpande N, Suresh M, Kannabiran N, Niranjan V, Nalli A, Prasad TS, Arun KS, Reddy R, Chandran S, Jadhav T, Julie D, Mahesh M, John SL, Palvankar K, Sudhir D, Bala P, Rashmi NS, Vishnupriya G, Dhar K, Reshma S, Chaerkady R, Gandhi TK, Harsha HC, Mohan SS, Deshpande KS, Sarker M, Pandey A. Plasma Proteome Database as a resource for proteomics research. Proteomics. 2005;5(13):3531–3536. doi: 10.1002/pmic.200401335. [DOI] [PubMed] [Google Scholar]
- 39.Nanjappa V, Thomas JK, Marimuthu A, Muthusamy B, Radhakrishnan A, Sharma R, Ahmad Khan A, Balakrishnan L, Sahasrabuddhe NA, Kumar S, Jhaveri BN, Sheth KV, Kumar Khatana R, Shaw PG, Srikanth SM, Mathur PP, Shankar S, Nagaraja D, Christopher R, Mathivanan S, Raju R, Sirdeshmukh R, Chatterjee A, Simpson RJ, Harsha HC, Pandey A, Prasad TS. Plasma Proteome Database as a resource for proteomics research: 2014 update. Nucleic Acids Res. 2014;42(Database issue):D959–D965. doi: 10.1093/nar/gkt1251. [DOI] [PMC free article] [PubMed] [Google Scholar]
- 40.Zhang Y, Guo Z, Zou L, Yang Y, Zhang L, Ji N, Shao C, Sun W, Wang Y. A comprehensive map and functional annotation of the normal human cerebrospinal fluid proteome. J Proteomics. 2015;119:90–99. doi: 10.1016/j.jprot.2015.01.017. [DOI] [PubMed] [Google Scholar]
- 41.Kentsis A, Monigatti F, Dorff K, Campagne F, Bachur R, Steen H. Urine proteomics for profiling of human disease using high accuracy mass spectrometry. Proteomics Clin Appl. 2009;3(9):1052–1061. doi: 10.1002/prca.200900008. [DOI] [PMC free article] [PubMed] [Google Scholar]
- 42.Lin YH, Eguez RV, Torralba MG, Singh H, Golusinski P, Golusinski W, Masternak M, Nelson KE, Freire M, Yu Y. Self-assembled STrap for global proteomics and salivary biomarker discovery. J Proteome Res. 2019;18(4):1907–1915. doi: 10.1021/acs.jproteome.9b00037. [DOI] [PubMed] [Google Scholar]
- 43.Jin J, Son M, Kim H, Kim H, Kong SH, Kim HK, Kim Y, Han D. Comparative proteomic analysis of human malignant ascitic fluids for the development of gastric cancer biomarkers. Clin Biochem. 2018;56:55–61. doi: 10.1016/j.clinbiochem.2018.04.003. [DOI] [PubMed] [Google Scholar]
- 44.Farina A, Delhaye M, Lescuyer P, Dumonceau JM. Bile proteome in health and disease. Compr Physiol. 2014;4(1):91–108. doi: 10.1002/cphy.c130016. [DOI] [PubMed] [Google Scholar]
- 45.Macron C, Lane L, Núñez Galindo A, Dayon L. Deep dive on the proteome of human cerebrospinal fluid: A valuable data resource for biomarker discovery and missing protein identification. J Proteome Res. 2018;17(12):4113–4126. doi: 10.1021/acs.jproteome.8b00300. [DOI] [PubMed] [Google Scholar]
- 46.Bhattacharjee M, Balakrishnan L, Renuse S, Advani J, Goel R, Sathe G, Keshava Prasad TS, Nair B, Jois R, Shankar S, Pandey A. Synovial fluid proteome in rheumatoid arthritis. Clin Proteomics. 2016;13:12. doi: 10.1186/s12014-016-9113-1. [DOI] [PMC free article] [PubMed] [Google Scholar]
- 47.Ai J, Smith B, Wong DT. Saliva Ontology: an ontology-based framework for a Salivaomics Knowledge Base. BMC Bioinformatics. 2010;11:302. doi: 10.1186/1471-2105-11-302. [DOI] [PMC free article] [PubMed] [Google Scholar]
- 48.de Souza GA, Godoy LM, Mann M. Identification of 491 proteins in the tear fluid proteome reveals a large number of proteases and protease inhibitors. Genome Biol. 2006;7(8):R72. doi: 10.1186/gb-2006-7-8-R72. [DOI] [PMC free article] [PubMed] [Google Scholar]
- 49.Wakai S, Yamakawa K, Manaka S, Takakura K. Spontaneous intracranial hemorrhage caused by brain tumor: its incidence and clinical significance. Neurosurgery. 1982;10(4):437–444. doi: 10.1227/00006123-198204000-00004. [DOI] [PubMed] [Google Scholar]


