

Abstract
Background:
Tibial bone stress injuries are common among the athletic adolescent population. A thorough patient history and clinical examination are essential to identify the location and extent of injury. However, there has been little description or any validation of clinical tests to help guide clinicians. Consequently, a formal diagnosis is usually dependent on results from proper imaging.
Hypothesis:
Clinical examinations will be both highly sensitive and specific determining the incidence, grade, and location of tibial bone stress injury as compared with magnetic resonance imaging (MRI).
Study Design:
Case-control.
Level of Evidence:
Level 2.
Methods:
A total of 80 consecutive athletic adolescents, from various sports, with greater than 1-week history of shin pain were enrolled in this institutional review board–approved study. Exclusion criteria were age >19 years and history of traumatic injury. Patients underwent a standardized clinical examination, which included a fulcrum test (FT), tap/percussion test (TT), vibration test (VT) utilizing a 128-Hz tuning fork, weight bearing lunge test (WBLT) to determine degree of dorsiflexion range of motion (ROM), and vertical single leg hop test (VSLHT) for height, landing, and pain. Bilateral lower extremity MRI was completed on the same day as clinical evaluation and served as the injury reference. Sensitivity, specificity, positive predictive value (PPV) and negative predictive value (NPV) were calculated to evaluate each clinical examination for its ability to identify a bone stress injury.
Results:
A total of 159 tibiae in 80 patients were evaluated. No single test or combination of tests was both highly sensitive and specific. Individual clinical tests demonstrated sensitivity ranging from 0.11 to 0.72 and specificity ranging from 0.37 to 0.93. The VSLHT noting an increase in pain was the most sensitive test (0.72; 95% CI, 0.62-0.78); however, its specificity was only 0.37 (95% CI, 0.19-0.55), with a PPV of 0.84 (95% CI, 0.78-0.91) and NPV of 0.20 (95% CI, 0.089-0.31). The WBLT demonstrated a mean ROM of 8 cm, with side-to-side differences (range 0-4 cm) not influencing incidence of injury. Combinations of tests demonstrated low sensitivity (0.03-0.40), with better specificity (0.63-1.0). When considering ability to identify higher grades of injury (grade III/IV), all tests had a high NPV indicating that if clinical tests were negative, there was a high likelihood that the patient did not have a grade III or IV injury.
Conclusion:
No single test or combination of tests was both highly sensitive and specific. Clinicians cannot solely rely on clinical examination for determining extent or severity of bone stress injury in the athletic adolescent population, but when combinations of tests are negative, there is likely not a high-grade bone stress injury.
Clinical Relevance:
Clinical tests utilized in the evaluation of adolescent tibial bone stress injury may help indicate the presence or absence of higher grade tibial bone stress injury.
Keywords: clinical examination, bone stress injury, adolescents, tibia
Lower leg pain is a common1 presenting complaint among adolescent athletes. As many as 84% of these athletes identify as having bone stress injury (BSI),21,24,35 with the most frequently reported site being the tibia.18,23,32 Clinically, the cause of lower leg pain can be difficult to diagnose and troublesome to manage because of the wide range of potential diagnoses,9,25 including BSI, exertional compartment syndrome, muscular, neurologic, and vascular injury. Consequently, there is confusion among clinicians, and there are various nomenclatures utilized in the literature to describe lower leg pain in athletes.1 Common terminology used by clinicians includes stress fracture, shin splints, medial tibial stress syndrome, and stress reaction. With the advent of magnetic resonance injury (MRI), stress-related tibial pain can be visualized as a spectrum of injury. Consequently, to reduce confusion among clinicians, we advocate for the use of the term BSI, which is an all-encompassing term first utilized by Markey16 and used to describe a range of bone injury from periostitis, stress reaction, and marrow edema to complete stress fracture, which demonstrates a frank cortical fracture. Patients are often symptomatic long before radiographic identifiable fracture occurs. This makes the clinician’s clinical assessment important, as making an early diagnosis of BSI has been shown to result in improved outcomes.30,33 Ohta-Fukushima et al22 found significantly better outcomes for patients with BSI diagnosed within 3 weeks of the initiation of symptoms versus those diagnosed later. Therefore, the ability of clinical tests to diagnose a BSI early is of significant clinical benefit.
Description and validation of clinical examinations is lacking in existing literature.30 Consequently, clinicians often rely on results of imaging to make a definitive diagnosis of BSI and determine appropriate prognosis for return to sports. A specific aim of this study is to evaluate the sensitivity, specificity, positive predictive value (PPV), and negative predictive value (NPV) for various clinical tests for diagnosis of tibial BSI by describing 5 commonly utilized clinical tests. The other specific aim is to compare these clinical tests and combinations of them with the grade of BSI determined by MRI. Our hypothesis is that the accuracy of clinical examinations or combination of examinations is comparable with the MRI diagnosis of BSI.
Methods
Patients presenting to an orthopaedic practice with a chief complaint of sports-related, atraumatic shin pain were considered for participation in this institutional review board–approved study. Athletes who were >19 years and who reported a traumatic event with no preexisting symptoms were excluded from this study. Patients who demonstrated numbness, radiating pain into the foot, or symptoms suggestive of a compartment syndrome, compression neuropathy, or other neurovascular injury were excluded from the study.
In total, 80 patients were enrolled in this study. After consent was obtained, a history and physical examination was performed on 80 high school athletes with >1-week history of shin pain. Examination was performed by 1 of 4 sports medicine fellowship–trained orthopaedic surgeons who recorded the results of the clinical examination prior to completion of MRI. On completion of the physical examination, routine radiographs and MRI of both tibiae were obtained on the same day as the examination. Prior to the beginning of the study, each physician was instructed on how to perform each examination. MRI was reviewed by an experienced independent musculoskeletal radiologist who graded BSI utilizing a 4-grade grading scale described by Fredericson et al8: grade I—periosteal edema on T2 images, grade II—marrow edema on T2, grade III—marrow edema moderate to severe on T1 and T2 images, and grade IV—severe marrow edema with visible cortical fracture line on T1 and T2 images. Results of clinical examination underwent statistical analysis to determine sensitivity, specificity, PPV, and NPV. Linear regression analysis was also performed to determine the optimal combination of clinical examinations using SAS29 (Version 9.4; 2013).
Description of Clinical Examination
This study evaluated the effectiveness of 5 tests intended to identify location and/or presence of BSI. Tests included a fulcrum test (FT),6,9,26 tap/percussion test (TT),19,25,31,33 vibration test (VT; utilizing a tuning fork),5,30 assessment of range of motion (ROM) utilizing the weight bearing lunge test (WBLT),10,14 and vertical single leg hop test (VSLHT).8,31
Fulcrum Test
The examiner applied a valgus force to the tibia. This test was performed at the distal 1/3, middle, and at the proximal 1/3 of the tibia with a moderate hand pressure. A positive test was recorded when the patient expressed increased pain or discomfort at any of the 3 sites.
Tap or Percussion Test
The test was performed utilizing 2 fingers to tap along the entire tibia. The intensity of finger tapping was approximately a 1-pound force generated from 1 to 2 inches above the bone. A positive test and location were noted when the patient expressed increased pain with tapping. The location of the painful site was recorded.
Vibration Testing
VT was completed utilizing a vibrating 128-Hz tuning fork placed over the identified site of pain for 5 seconds. If the patient remarked that there was increased pain or discomfort associated with the vibration, the test was considered positive. This test was performed at the distal third, middle, and proximal third of the tibia, as well as the site of perceived pain.
The Vertical Single Leg Hop Test
Hopping has been noted to be of clinical value in the assessment of lower leg BSI, but specific description has been lacking. We chose to define and review the VSLHT. The patient was instructed to perform vertical hopping × 10 repetitions with a maximum effort. A positive vertical test was noted in 2 ways. The vertical hop test was analyzed for decreasing height over the 10 repetitions, increasing landing time (time on the ground) as evidenced by increased knee flexion and prolonged time between hops, and the remark of increased pain by an increased pain score with hopping. The hop height and landing were compared with testing of the contralateral side. Though a formal measurement was not made, a general notation of diminished hop height and increased landing was relatively easy to determine over repetitions and when compared with the contralateral side. Notation of a pain score (0-10; 0 = no pain, 10 = severe pain) with hopping was also recorded.
Weight Bearing Lunge Test
Loss of ankle dorsiflexion has been noted to be a contributing factor in BSI and we chose to utilize the WBLT as a functional assessment for ankle ROM. The test was performed by instructing patients to face a wall with the foot placed perpendicular to the wall while they moved their knee over a fixed foot in a lunging motion until the knee could make contact with the wall with the heel flat on the ground. This motion was progressively repeated several times until the maximal dorsiflexion ROM was achieved without the heel rising from the floor. A measurement was made between the tip of the big toe and the wall in centimeters (Figure 1).
Figure 1.
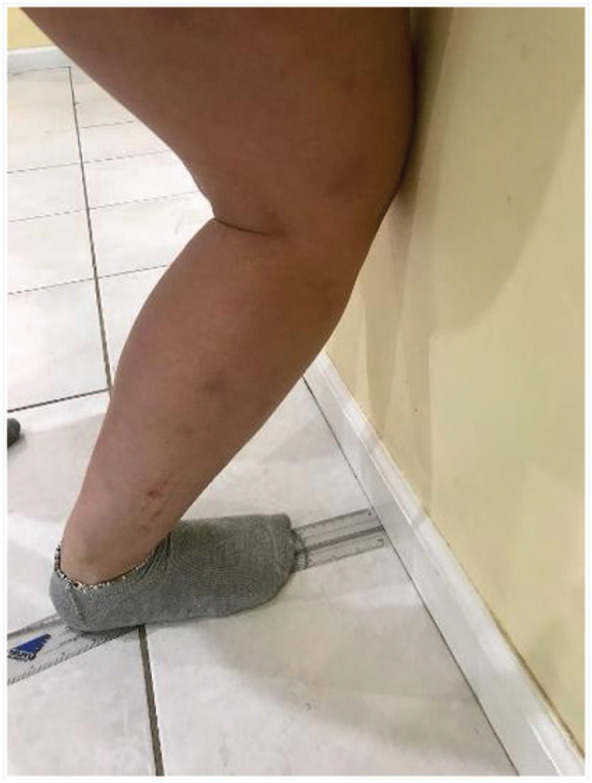
Weight bearing lunge test with the heel on the floor and the knee touching the wall. A measurement was made from the tip of the great toe to the wall in cm.
Statistical Analysis
Data were analyzed using 2-by-2 contingency tables, which were created to calculate sensitivity, specificity, PPV, and NPV for different combinations of clinical tests when compared with MRI data utilizing the Fredericson et al8 grading scale to classify degree of BSI. SAS software was utilized for analysis.29
Results
Eighty athletic adolescents participating in multiple sports including cross-country, track and field, soccer, lacrosse, and basketball volunteered for this institutional review board–approved study (52 girls, 28 boys; age 14-18 years). A total of 159 tibiae underwent evaluation. One patient opted only to evaluate 1 leg. MRI was positive in 84% (133 of 159) of tibiae evaluated. Fredericson grading demonstrated 26 grade 0, 19 grade I, 80 grade II, 29 grade III, and 5 grade IV. All grade IV injuries occurred on the posterior medial cortex of the proximal/middle tibia.
No single test or combination of tests was both highly sensitive and specific (Table 1). Individual clinical tests demonstrated sensitivity ranging from 0.11 to 0.72 and specificity ranging from 0.37 to 0.93. Pain with VSLHT was the most sensitive test (0.72; 95% CI, 0.62-0.78); however, its specificity was only 0.37 (95% CI, 0.19-0.55), with a PPV of 0.84 (95% CI, 0.78-0.91) and NPV 0.20 (95% CI, 0.089-0.31). The FT and VT demonstrated the highest specificity, but both demonstrated a low sensitivity. (0.12 and 0.16). Combinations of tests demonstrated low sensitivity (0.03-0.40), with better specificity (0.63-1.0). When 2 exams were combined (Table 2), such as the TT + VSLHT for pain, moderate results were found. Three tests in combination yielded poor sensitivity, but excellent specificity and PPV (Table 3). The WBLT demonstrated a median measurement of 8 cm (mean 8.12 cm, minimum 2.0 cm, maximum 16.0 cm; SD, 2.6106) with side-to-side differences (range, 0-4 cm), which were found to not correlate with MRI (P = 0.55; >0.05). There was no statistically significant correlation between side-to-side ROM difference and MRI grade.
Table 1.
Statistical performance of individual clinical tests for identifying all grades of MRI
| Test | Positive | Negative | Total | Sensitivity, % | Specificity, % | PPV, % | NPV, % |
|---|---|---|---|---|---|---|---|
| Fulcrum test | 12.12 (6.55-17.69) | 92.59 (82.71-100.00) | 88.89 (74.37-100.00) | 17.73 (11.43-24.03) | |||
| MRI+ | 16 | 116 | 132 | ||||
| MRI− | 2 | 25 | 27 | ||||
| Total | 18 | 141 | 159 | ||||
| Tap test | 51.52 (42.99-60.04) | 55.56 (36.81-74.30) | 85 (77.18-92.82) | 18.99 (10.34-27.64) | |||
| MRI+ | 68 | 64 | 132 | ||||
| MRI− | 12 | 15 | 27 | ||||
| Total | 80 | 79 | 159 | ||||
| Vibration test (tuning fork) | 15.91 (9.67-22.15) | 92.59 (82.71-100.00) | 91.3 (79.79-100.00) | 18.38 (11.87-24.89) | |||
| MRI+ | 21 | 111 | 132 | ||||
| MRI− | 2 | 25 | 27 | ||||
| Total | 23 | 136 | 159 | ||||
| Hop test: increased pain | 69.7 (61.86-77.54) | 37.04 (18.82-55.25) | 84.04 (77.59-91.21) | 20 (8.91-31.09) | |||
| MRI+ | 92 | 40 | 132 | ||||
| MRI− | 17 | 10 | 27 | ||||
| Total | 109 | 50 | 159 | ||||
| Hop test: increased landing | 31.06 (23.17-38.95) | 74.07 (57.54-90.60) | 85.41 (75.43-95.40) | 18.02 (10.87-25.17) | |||
| MRI+ | 41 | 91 | 132 | ||||
| MRI− | 7 | 20 | 27 | ||||
| Total | 48 | 111 | 159 | ||||
| Hop test: decreased height | 38.6 (30.33-46.94) | 70.37 (53.15-87.59) | 86.44 (77.70-95.18) | 19 (11.31-26.69) | |||
| MRI+ | 51 | 81 | 132 | ||||
| MRI− | 8 | 19 | 27 | ||||
| Total | 59 | 100 | 159 |
MRI, magnetic resonance imaging; NPV, negative predictive value; PPV, positive predictive value.
Table 2.
Best performance of 2 clinical tests in combination to identify all grades of MRI
| Test | Positive | Negative | Total | Sensitivity, % | Specificity, % | PPV, % | NPV, % |
|---|---|---|---|---|---|---|---|
| Fulcrum + hop test (Pain) | |||||||
| MRI+ | 2 | 130 | 132 | 1.52 | 100 | 100 | 20 |
| MRI− | 0 | 27 | 27 | ||||
| Total | 2 | 157 | 159 | ||||
MRI, magnetic resonance imaging; NPV, negative predictive value; PPV, positive predictive value.
Table 3.
Best performance of 3 clinical tests in combination for identification of all MRI grades
| Test | Sensitivity, % | Specific, % | PPV, % | NPV, % |
|---|---|---|---|---|
| Fulcrum + tap + vibration | 3.03 | 100 | 100 | 17.42 |
| Fulcrum +tap + hip test (pain) | 1.52 | 100 | 100 | 17.42 |
| Fulcrum + tap + hop test (increased landing) | 3.79 | 100 | 100 | 17.53 |
| Fulcrum + vibration + hop test (increased landing) | 1.52 | 100 | 100 | 17.19 |
| Fulcrum + vibration + hop test (decreased height) | 2.27 | 100 | 100 | 17.31 |
MRI, magnetic resonance imaging; NPV, negative predictive value; PPV, positive predictive value.
When considering the predictive value of an individual test for identification of a higher grade of injury (grade III/IV injuries) (Table 4), the VSLHT with pain performed with good sensitivity, but relatively poor specificity. Utilizing a combination of tests to identify higher MRI grade (grade III/IV), the FT + VSLHT with pain rated 7 to 10, and FT + VT + VSLHT with pain or decreased height had poor sensitivity, but excellent specificity and NPV (Table 5), suggesting that if all 3 of these clinical tests are negative, there is a high likelihood that the patient does not have a significant BSI injury.
Table 4.
Ability of individual tests to identify more significant BSI (grade III/IV)
| Test | Positive | Negative | Total | Sensitivity, % (95% CI) | Specificity, % (95% CI) | PPV, % (95% CI) | NPV, % (95% CI) |
|---|---|---|---|---|---|---|---|
| Fulcrum test | 2.78 (0.00-8.15) | 86.18 (80.08-92.8) | 5.56 (0.00-16.16) | 75.18 (68.05-82.31) | |||
| MRI+ | 1 | 35 | 36 | ||||
| MRI− | 17 | 106 | 123 | ||||
| Total | 18 | 141 | 159 | ||||
| Tap test | 58.33 (42.23-74.44) | 52.03 (43.20-60.86) | 26.25 (16.61-35.89) | 81.09 (72.36-89.66) | |||
| MRI+ | 21 | 15 | 36 | ||||
| MRI− | 59 | 64 | 123 | ||||
| Total | 80 | 79 | 159 | ||||
| Vibration test (tuning fork) | 13.89 (2.59-25.19) | 85.37 (79.12-91.61) | 21.74 (4.88-38.60) | 77.21 (70.16-84.26) | |||
| MRI+ | 5 | 31 | 36 | ||||
| MRI− | 18 | 105 | 123 | ||||
| Total | 23 | 136 | 159 | ||||
| Hop test: increased pain | 72.2(57.59-86.85) | 32.52 (24.24-40.80) | 22.94 (15.85-31.85) | 80 (68.91-91.09) | |||
| MRI+ | 26 | 10 | 36 | ||||
| MRI− | 83 | 40 | 123 | ||||
| Total | 109 | 50 | 159 | ||||
| Hop test: increased landing | 50 (33.67-66.33) | 75.61 (68.02-83.20) | 37.5 (23.80-51.02) | 83.78 (76.93-90.64) | |||
| MRI+ | 18 | 18 | 36 | ||||
| MRI− | 30 | 93 | 27 | ||||
| Total | 48 | 111 | 159 | ||||
| Hop test: decreased height | 55.56 (39.32-71.79) | 68.29 (60.07-71.79) | 33.9 (21.82-45.98) | 84 (76.81-91.19) | |||
| MRI+ | 20 | 16 | 36 | ||||
| MRI− | 39 | 84 | 123 | ||||
| Total | 59 | 100 | 159 |
BSI, bone stress injury; MRI, magnetic resonance imaging; NPV, negative predictive value; PPV, positive predictive value.
Table 5.
Best combinations to identify >MRI grade (grade III/IV)
| Test | Positive | Negative | Total | Sensitivity, % (95% CI) | Specificity, % (95% CI) | PPV, % (95% CI) | NPV, % (95% CI) |
|---|---|---|---|---|---|---|---|
| Fulcrum + tap + vibration | 0.00 | 96.75 (93.61-99.88) | 0.00 | 76.77 (70.13-83.42) | |||
| MRI+ | 0 | 36 | 36 | ||||
| MRI− | 4 | 119 | 123 | ||||
| Total | 4 | 155 | 159 | ||||
| Fulcrum + tap + hop (pain 7-10) | 0.00 | 99.19 (97.60-100.00) | 0.00 | 77.22 (70.67-83.76) | |||
| MRI+ | 0 | 36 | 36 | ||||
| MRI− | 1 | 122 | 123 | ||||
| Total | 1 | 158 | 159 | ||||
| Fulcrum + vibration + hop (pain 7-10) | 0.00 | 100.00 | 0.00 | 77.36 (70.85-83.86) | |||
| MRI+ | 0 | 36 | 36 | ||||
| MRI− | 0 | 123 | 123 | ||||
| Total | 0 | 159 | 159 | ||||
| Tap + vibration + hop test (pain 7-10) | 0.00 | 98.37 (96.114-100.00) | 0.00 | 77.07 (70.49-83.65) | |||
| MRI+ | 0 | 36 | 36 | ||||
| MRI− | 2 | 121 | 123 | ||||
| Total | 2 | 157 | 159 | ||||
| Fulcrum +tap + increased landing | 2.78 (0.00-8.15) | 96.75 (93.61-99.88) | 20 (0.00-55.06) | 77.3 (70.65-83.89) | |||
| MRI+ | 1 | 35 | 36 | ||||
| MRI− | 4 | 119 | 123 | ||||
| Total | 5 | 154 | 159 | ||||
| Fulcrum + vibration + increased landing | 0.00 | 98.37 (96.14-100.00) | 100.00 | 77.1 (70.49-83.65) | |||
| MRI+ | 0 | 36 | 36 | ||||
| MRI− | 2 | 121 | 123 | ||||
| Total | 2 | 157 | 159 | ||||
| Tap + vibration + increased landing | 2.78 (0.00-8.15) | 95.12 (91.32-98.93) | 14.29 (0.00-40.21) | 76.97 (70.28-83.67) | |||
| MRI+ | 1 | 35 | 36 | ||||
| MRI− | 6 | 117 | 123 | ||||
| Total | 7 | 152 | 159 | ||||
| Fulcrum + tap + decreased height | 2.78 (0.00-8.15) | 95.12 (91.32-98.93) | 14.29 (0.00-40.21) | 76.97 (70.28-83.67) | |||
| MRI+ | 1 | 35 | 36 | ||||
| MRI− | 6 | 117 | 123 | ||||
| Total | 7 | 152 | 159 | ||||
| Fulcrum + vibration + decreased height | 0.00 | 97.56 (94.83-100.00) | 100.00 | 76.92 (70.31-83.53) | |||
| MRI+ | 0 | 36 | 36 | ||||
| MRI− | 3 | 123 | 123 | ||||
| Total | 3 | 156 | 159 | ||||
| Tap + vibration+ decreased height | 2.78(0.00-8.15) | 94.31 (90.21-98.40) | 12.5 (0.00-35.42) | 76.82 (70.09-83.55) | |||
| MRI+ | 1 | 35 | 36 | ||||
| MRI− | 7 | 116 | 123 | ||||
| Total | 8 | 151 | 159 |
MRI, magnetic resonance imaging; NPV, negative predictive value; PPV, positive predictive value.
Discussion
Our results did not show a single test or combination of tests that demonstrated both high sensitivity and high specificity for predicting tibial BSI, further highlighting the importance of early imaging in the diagnostic process.
Although often anecdotal, selective research has for decades suggested the ability of nonradiographic tests to diagnose BSI.31 The literature notes that a remark of localized bone tenderness and particularly pain with palpation is thought to be suggestive of BSI.2,3,5,6,13,15,19 Matheson et al17 studied 320 stress fractures and found that localized tenderness was evident in 65.9% (P = 0.74) of individuals with BSI and swelling only in 24.6% (P = 0.40). They noted that presence or absence of tenderness or swelling did not influence time to diagnosis or recovery.17 Pain on loading,6,26 activity-related pain,17 and night pain15 have been found to be significant predictors of BSI. Edwards et al7 proposed the use of an algorithm for determining the cause of leg pain and determined that pain at rest and pain with palpation was suggestive of a BSI. A pain score of >6/10 has been associated with occurrence of BSI,20 and pain with nonsports activity is a sign of higher grade bone injury.11 In addition, to consideration of pain, Edwards et al, Reeder et al,28 and Touliopolous and Hershman34 noted that a thorough patient history and clinical examination are important for determining extent and location of injury.
The WBLT4 has been validated for assessment of ankle dorsiflexion ROM10,27 and has been shown to have a high correlation with reference standard for dorsiflexion of the ankle.10,14 Restricted dorsiflexion has been identified as a contributing factor in overuse injuries of the lower leg,12 but to what extent limitation of motion plays a role in diagnosing BSI is not well-understood. Our results did not support the value of an assessment of dorsiflexion ROM using the WBLT to predict BSI.
Use of VT utilizing a tuning fork has been reported to have moderate sensitivity (72%) and specificity (67%) for detecting a BSI30; however, our results demonstrated a much lower sensitivity (16%) and higher specificity (93%). In a meta-analysis, Schneiders et al30 found that there was insufficient evidence to support the use of a tuning fork as a stand-alone diagnostic test. Our results would support that finding. Percussion has been noted to induce pain in patients with BSI31 and we found that the TT had only moderate sensitivity and specificity as a stand-alone test. Batt et al1 noted pain with hopping as indicative of injury, but noted that only 21 of 46 patients studied with lower leg pain had a positive hop test. Hop testing can be performed with 1 or 2 legs and usually accompanied by an assessment of height, distance, dysfunction, and significance of pain. Our study defined a positive VSLHT in 3 ways and was considered positive if the patient had (1) pain with hopping determined by a pain score, (2) demonstrated decreased hop height as compared with the opposite side and over the course of 10 hops, and (3) increased hop landing, which we found to be a common finding among adolescents with BSI. The VSLHT is easy to perform in the office setting and, with a sensitivity of 72% when noting pain, provides a good functional assessment of the impact of BSI. Because of only moderate sensitivity and specificity, use of the VSLHT alone for differential diagnosis is not sufficient. However, our findings support the use of a VSLHT as a screening tool, but only in combination with other tests.
Nussbaum et al20 created the shin pain scoring system (SPSS) based on a 29-point scale to clinically predict the incidence and severity of tibial BSI. The SPSS combines the findings from a patient questionnaire and clinical examination to classify tibial BSI into 1 of 3 categories of BSI: category I (MRI grade I), category II (MRI grade II), and category III (MRI grade II/IV), which has been previously investigated with reliable but mixed results (sensitivity 96%, specificity 26%, PPV 76%, and NPV 71%).
Statistical analysis of our results demonstrates that when certain clinical examinations are negative, the likelihood of a more significant BSI is less. These findings coupled with a negative radiograph could be particularly important for athletes who wish to continue to compete while reducing overall training activity. As long as symptoms of pain are not increasing, clinicians should feel relatively confident that the athlete does not have a more significant injury. Therefore, when contemplating return to sport, close monitoring of clinical changes with serial examinations and radiographs, in lieu of obtaining advanced imaging, is recommended.
An interesting finding in our study occurred when we analyzed a combination of 3 tests for predicting a more significant (grade III or IV) BSI (Table 5). The analysis showed a number of combinations to be highly specific and 2 combinations to have a high PPV. In particular, the FT + VT + hop test/increased landing time was 100% specific and had a PPV of 100%, indicating the value of utilizing multiple tests in a clinical examination. However, this combination of tests lacked sensitivity and had a low NPV and consequently should be considered with caution.
This is the first study to evaluate the effectiveness of the clinical tests utilized in a formal physical examination for athletes with suspected tibial BSI in the adolescent athletic population. Understanding the value of individual clinical examinations helps the clinician improve interpretation of clinical findings and to communicate this to patients.
Limitations
This study was done with only adolescent patients and results cannot be generalized to the adult population. Additionally, this study involved clinical evaluation by 1 of 4 fellowship-trained and experienced orthopaedic surgeons who underwent clinical evaluation training prior to the study in order to establish a consistent clinical examination. A clinical recording sheet accompanied each patient and helped to guide each physician’s evaluation, but it is fair to note that there exists an inherent variability in any clinical assessment as there is variability in how hard one taps during the TT, pushes during the FT, or interprets increased landing or decreased jump height during the hop test. It is also fair to note that we did not utilize a control group for either the clinical tests or MRI in this study.
Conclusion
Our findings refute our hypothesis as no single examination or combination of examinations was both highly sensitive and specific for the presence of any form of BSI or more severe tibial BSI based on MRI grading. Clinicians should interpret clinical findings with caution but maintain a high level of suspicion when an athlete notes pain of the tibia and vertical single-leg hopping generates pain. Negative findings with a combination of tests are a significant finding in this study. In particular, this finding can support a clinician’s judgment against advanced imaging in light of clinical findings and may support the judgment utilizing serial clinical examination follow-up and radiographs to monitor recovery. However, in those patients who show at least 2 positive clinical examinations, use of advanced imaging should be utilized early in the process to determine formal diagnosis and severity of injury and to improve outcomes. Further study and testing should be considered to improve clinical evaluation of adolescents with BSI.
Footnotes
The authors report no potential conflicts of interest in the development and publication of this article.
This study was approved by the Rutgers University, New Brunswick, Health Sciences Institutional Review Board (study No. Pro20140000950).
References
- 1.Batt ME, Ugalde V, Anderson MW, Shelton DK.A prospective controlled study of diagnostic imaging for acute shin splints. Med Sci Sports Exerc. 1998;30:1564-1571. [DOI] [PubMed] [Google Scholar]
- 2.Beck B.Can therapeutic ultrasound accurately detect bone stress injuries in athletes? Clin J Sport Med. 2013;23:241-242. [DOI] [PubMed] [Google Scholar]
- 3.Bennell K, Matheson G, Meeuwisse W, Brukner P.Risk factors for stress fractures. Sports Med. 1999;28:91-122. [DOI] [PubMed] [Google Scholar]
- 4.Bennell K, Talbot R, Wajswelner H, Techovanich W, Kelly D, Hall A.Intra-rater and inter-rater reliability of a weight-bearing lunge measure of ankle dorsiflexion. Aust J Physiother. 1998;44:175-180. [DOI] [PubMed] [Google Scholar]
- 5.Brukner P, Bennell K.Stress fractures in female athletes. Diagnosis, management and rehabilitation. Sports Med. 1997;24:419-429. [DOI] [PubMed] [Google Scholar]
- 6.Courtenay BG, Bowers DM.Stress fractures: clinical features and investigation. Med J Aust. 1990;153:155-156. [DOI] [PubMed] [Google Scholar]
- 7.Edwards PH, Jr, Wright ML, Hartman JF.A practical approach for the differential diagnosis of chronic leg pain in the athlete. Am J Sports Med. 2005;33:1241-1249. [DOI] [PubMed] [Google Scholar]
- 8.Fredericson M, Bergman AG, Hoffman KL, Dillingham MS.Tibial stress reaction in runners. Correlation of clinical symptoms and scintigraphy with a new magnetic resonance imaging grading system. Am J Sports Med. 1995;23:472-481. [DOI] [PubMed] [Google Scholar]
- 9.Fredericson M, Wun C.Differential diagnosis of leg pain in the athlete. J Am Podiatr Med Assoc. 2003;93:321-324. [DOI] [PubMed] [Google Scholar]
- 10.Hall EA, Docherty CL.Validity of clinical outcome measures to evaluate ankle range of motion during the weight-bearing lunge test. J Sci Med Sport. 2017;20:618-621. [DOI] [PubMed] [Google Scholar]
- 11.Harrast MA, Colonno D.Stress fractures in runners. Clin Sports Med. 2010;29:399-416. [DOI] [PubMed] [Google Scholar]
- 12.Hughes LY.Biomechanical analysis of the foot and ankle for the predisposition to developing stress fractures. J Orthop Sports Phys Ther. 1985;7:96-101. [DOI] [PubMed] [Google Scholar]
- 13.James SL, Bates BT, Osternig LR.Injuries to runners. Am J Sports Med. 1978;6:40-50. [DOI] [PubMed] [Google Scholar]
- 14.Kang MH, Lee DK, Park KH, Oh JS.Association of ankle kinematics and performance on the Y-balance test with inclinometer measurements on the weight-bearing-lunge test. J Sport Rehabil. 2015;24:62-67. [DOI] [PubMed] [Google Scholar]
- 15.Lohrer H, Malliaropoulos N, Korakakis V, Padhiar N.Exercise-induced leg pain in athletes: diagnostic, assessment, and management strategies. Phys Sportsmed. 2019;47:47-59. [DOI] [PubMed] [Google Scholar]
- 16.Markey KL.Stress fractures. Clin Sports Med. 1987;6:405-425. [PubMed] [Google Scholar]
- 17.Matheson GO, Clement DB, McKenzie DC, Taunton JE, Lloyd-Smith DR, MacIntyre JG.Stress fractures in athletes. A study of 320 cases. Am J Sports Med. 1987;15:46-58. [DOI] [PubMed] [Google Scholar]
- 18.McBryde AM.Stress fractures in runners. Orthopedics. 1982;5:1040-1072. [DOI] [PubMed] [Google Scholar]
- 19.Newman P, Adams R, Waddington G.Two simple clinical tests for predicting onset of medial tibial stress syndrome: shin palpation test and shin oedema test [published correction appears in Br J Sports Med. 2013;47:991]. Br J Sports Med. 2012;46:861-864. [DOI] [PubMed] [Google Scholar]
- 20.Nussbaum ED, Bjornaraa J, Gatt CJ., Jr.Identifying factors that contribute to adolescent bony stress injury in secondary school athletes: a comparative analysis with a healthy athletic control group. Sports Health. 2019;11:375-379. [DOI] [PMC free article] [PubMed] [Google Scholar]
- 21.Nussbaum ED, Gatt CJ, Jr, Epstein R, et al. Validation of the shin pain scoring system: a novel approach for determining tibial bone stress injuries. Orthop J Sports Med. 2019;7:2325967119877803. [DOI] [PMC free article] [PubMed] [Google Scholar]
- 22.Ohta-Fukushima M, Mutoh Y, Takasugi S, Iwata H, Ishii S.Characteristics of stress fractures in young athletes under 20 years. J Sports Med Phys Fitness. 2002;42:198-206. [PubMed] [Google Scholar]
- 23.Orava S.Stress fractures. Br J Sport Med. 1980;14:40-44. [DOI] [PMC free article] [PubMed] [Google Scholar]
- 24.Orava S, Puranen J.Athletes’ leg pains. Br J Sports Med. 1979;13:92-97. [DOI] [PMC free article] [PubMed] [Google Scholar]
- 25.Papalada A, Malliaropoulos N, Tsitas K, et al. Ultrasound as a primary evaluation tool of bone stress injuries in elite track and field athletes. Am J Sports Med. 2012;40:915-919. [DOI] [PubMed] [Google Scholar]
- 26.Patel DR.Stress fractures: diagnosis and management in the primary care setting. Pediatr Clin N Am. 2010;57:819-827. [DOI] [PubMed] [Google Scholar]
- 27.Powden CJ, Hoch JM, Hoch MC.Reliability and minimal detectable change of the weight-bearing lunge test: a systematic review. Man Ther. 2015;20:524-532. [DOI] [PubMed] [Google Scholar]
- 28.Reeder MT, Dick BH, Atkins JK, Pribis AB, Martinez JM.Stress fractures. Current concepts of diagnosis and treatment. Sports Med. 1996;22:198-212. [DOI] [PubMed] [Google Scholar]
- 29.SAS. Version 9.4. SAS; 2013. Accessed January 15, 2020. www.sas.com
- 30.Schneiders AG, Sullivan SJ, Hendrick PA, et al. The ability of clinical tests to diagnose stress fractures: a systematic review and meta-analysis. J Orthop Sports Phys Ther. 2012;42:760-771. [DOI] [PubMed] [Google Scholar]
- 31.Shindle MK, Endo Y, Warren RF, et al. Stress fractures about the tibia, foot, and ankle. J Am Acad Orthop Surg. 2012;20:167-176. [DOI] [PubMed] [Google Scholar]
- 32.Sullivan D, Warren RF, Pavlov H, Kelman G.Stress fractures in 51 runners. Clin Orthop Relat Res. 1984;187:188-192. [PubMed] [Google Scholar]
- 33.Tenforde AS, Kraus E, Fredericson M.Bone Stress injuries in runners. Phys Med Rehabil Clin N Am. 2016;27:139-149. [DOI] [PubMed] [Google Scholar]
- 34.Touliopolous S, Hershman EB.Lower leg pain. Diagnosis and treatment of compartment syndromes and other pain syndromes of the leg. Sports Med. 1999;27:193-204. [DOI] [PubMed] [Google Scholar]
- 35.Zwas ST, Elkanovitch R, Frank G.Interpretation and classification of bone scintigraphic findings in stress fractures. J Nucl Med. 1987;28:452-457. [PubMed] [Google Scholar]