Abstract
Background:
We have previously described mosaic mutations in the RNase IIIb domain of DICERlthat display global developmental delays, lung cysts, somatic overgrowth, macrocephaly and Wilms tumor. This constellation of phenotypes was classified as GLOW syndrome. Due to the phenotypic overlap between GLOW and syndromes caused by mutations in the PI3K/AKT/mTOR pathway, we hypothesized that alterations in miRNA regulation of this pathway cause its specific constellation of phenotypes.
Objective:
To test the hypothesis that DICER1 “hot spot” mutations associated with GLOW syndrome activate PI3K/AKT/mTOR signaling.
Methods:
We developed HEK293T cells with loss of exon 25 in DICER1, a genetic modification that is synonymous with the “hot spot” RNAseIIIb mutations that cause GLOW syndrome. We assayed the cells for activation of the PI3K/AKT/mTOR signaling pathway.
Results:
We observed activation of the PI3K/AKT/mTOR pathway as demonstrated by increased pS6Kinase, p4EBP1 and pTSC2 levels. Additionally, these cells demonstrate a striking cellular phenotype, with the ability to form spheres when the serum is removed from their growth medium. The cells in these spheres are Oct4 and Sox2 positive and exhibit the property of reversion with the addition of serum. We queried miRNA expression data and identified a population of miRNAs that increase due to these mutations and target negative regulators of the PI3K/AKT/mTOR pathway.
Conclusion:
This work identifies the delicate and essential role for miRNA control of the PI3K/AKT/mTOR pathway. We conclude that the phenotypes observed in the GLOW syndrome are the result of PI3K/AKT/mTOR activation.
Keywords: Cancer, DICER1, micoRNA, overgrowth, PI3K/AKT/mTOR, hot spot
1. INTRODUCTION
1.1. DICER1 Structure and Function
The DICER1 gene is located on chromosome 14 and contains 27 exons, which when faithfully spliced encodes for the DICER1 protein. This protein is 1,922 amino acids in length and 220kDa in weight. DICER1 contains multiple functional domains which include but are not limited to the two helicase domains, a double-stranded RNA (dsRNA) binding domain, the RNAseIIIa and the RNAseIIIb domains [1, 2]. DICER1 is essential for the generation of mature microRNAs. Specifically, DICER1 resides in the cytoplasm where it processes premature microRNAs (pri-miRNAs). During this process two populations of microRNAs are produced, the 3p and 5p miRNAs.
These small 15-20bp single-stranded RNA molecules combine with the RNA Induced Silencing Complex (RISC) wherein a sequence-specific manner they target and regulate the translation of complementary-sequence-specific mRNAs. miRNAs have far-reaching implications and associations with numerous biological and developmental processes [3, 4].
1.2. 3p/5p microRNAs
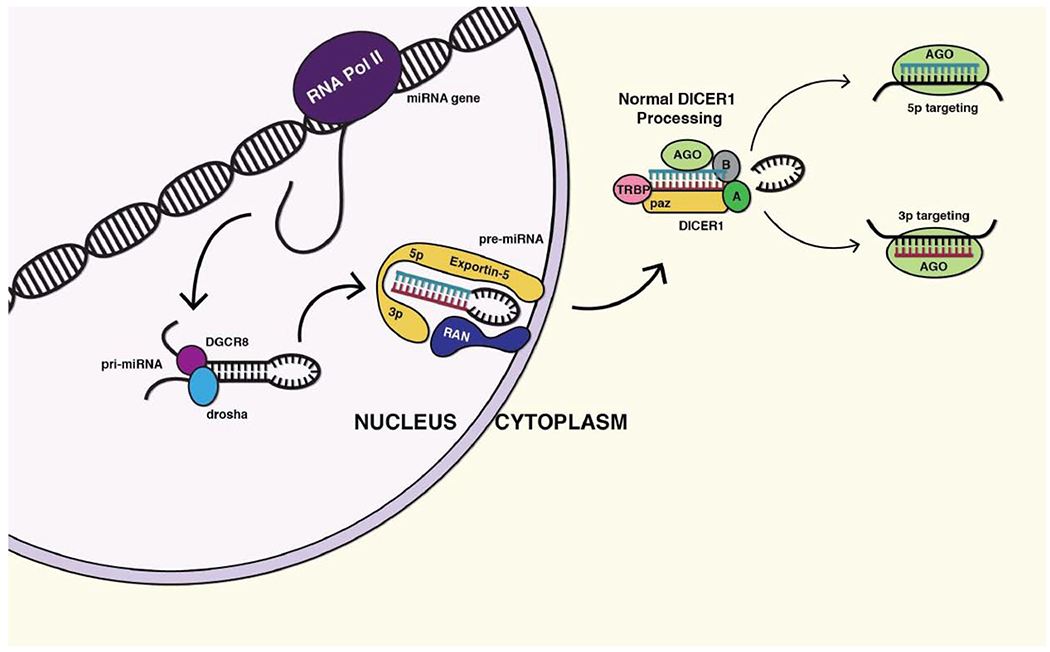
pri-mRNAsare transcribed by RNA polymerase II (RNA Pol II) and form dsRNA-hairpin looped structures which are actively exported from the nucleus. Once in the cytoplasm, they dock to the DICER1 protein, which recognizes their dsRNA hairpin motif. Once bound, DICER1 magnesium-dependent exonuclease domains make two distinct cuts liberating the hairpin and producing two populations of miRNAs. These populations of miRNAs are named based upon which end of the pri-miRNA they originated. The “5p” miRNA population arises from the 5 prime ends of the hairpin and the “3p” miRNA population from the 3 prime ends (Fig. 1). These two mature miRNAs are complementary to one another, however most commonly have unrelated targets, as the mRNAs they silence are single-stranded and complementation is not a concern.
Fig. (1).
Normal function of DICER1. DICER1 resides in the cytoplasm where it receives pri-miRNAs that are actively transported from the nucleus. Upon recognition of their dsRNA hairpin motif, DICER1 makes two single-stranded nicks that liberate two distinct populations of miRNAs: the 3p and 5p microRNAs. These then associate with Argonaute and inhibit the translation of specific miRNAs. (A higher resolution/colour version of this figure is available in the electronic copy of the article).
1.3. The DICER1 Syndrome
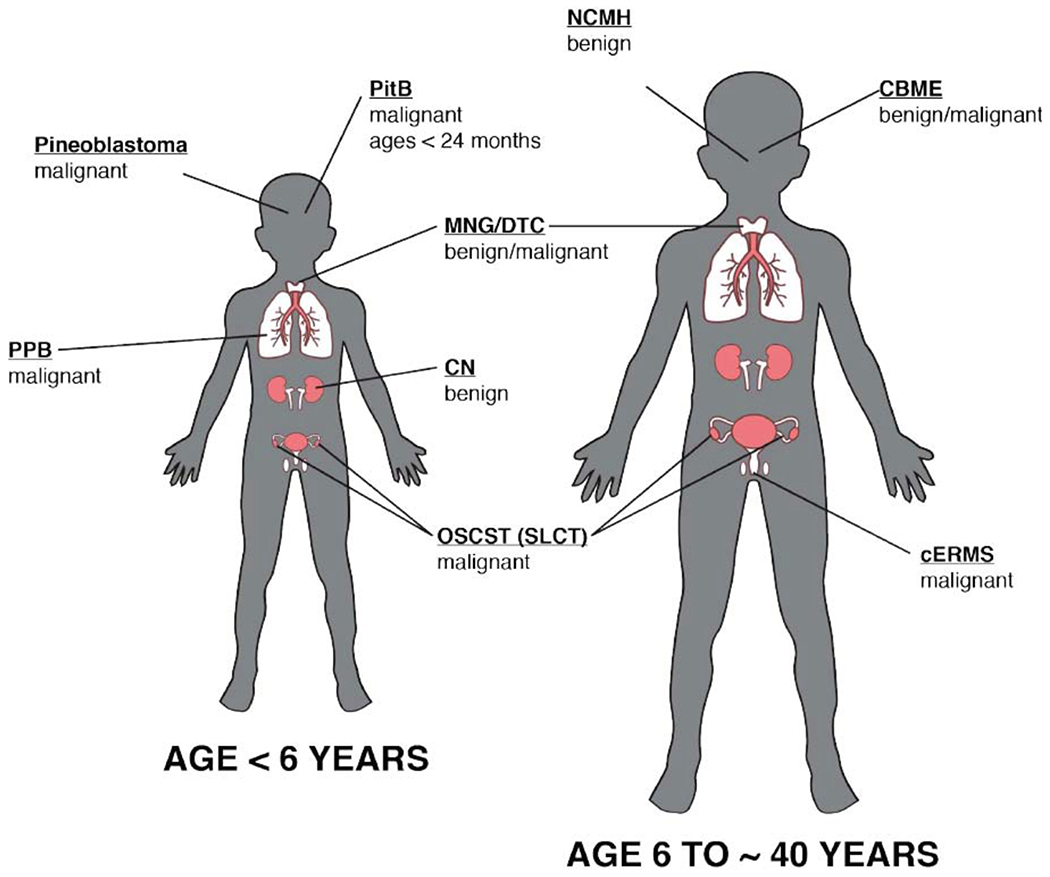
The DICER1 syndrome is a cancer predisposition syndrome which was first described due to its association with pleuropulmonaryblastoma tumors (PPB, [5, 6]). These rare pulmonary, pediatric tumors that occur during development and are often present at birth. The tumors begin as histologically benign pulmonary cysts, which are prone to malignant transformation and in certain cases sarcoma formation [6]. In addition to PPB, there are numerous neoplastic phenotypes which are associated with this syndrome including Sertoli-Leydig cell tumor, cystic nephroma, Wilms tumor, seminoma, embryonal rhabdomyosarcoma, and ovarian sex cord-stromal tumors [7–9] (Fig. 2). Most interestingly macrocephaly has been recently added to the phenotypic spectrum of the DICER1 syndrome, an observation that was initially reported in association with GLOW syndrome [1, 10].
Fig. (2).
Pediatric and Adult manifestation of the DICER1 syndrome. DICER1 syndrome is a cancer predisposition syndrome, which has an overrepresentation of numerous tumors including pinoblastomas, pleuropulmonary blastoma (PPB), pituitary blastomas (PitB), cystic nephroma, Ovarian sex Cord-Stromal Tumors (OSCST), Sertoli-Leydig Cell Tumors (SLCT), nasal chondromesenchymal hamartoma (NCMH), cervix embryonal rhabdomyosarcoma (cERMs), multimodular goiter/differentiated thyroid caner (MNG/DTC) and ciliary body medulloepithelioma (CBME, adapted from Choong et al. 2012). (A higher resolution/colour version of this figure is available in the electronic copy of the article).
1.4. GLOW Syndrome
GLOW Syndrome is an overgrowth syndrome aptly named as an acronym for its core clinical manifestations including Global developmental delays, Lung Cysts, Overgrowth and Wilms tumor [6]. These patients also demonstrate macrocephaly and dysmorphic facial features including hypertelorism, flattened nasal bridges, and frontal bossing. Additionally, it has been shown that autism is part of the clinical spectrum [1]. The mutations which cause GLOW syndrome are distinct from those that cause the classic DICER1 syndrome [1]. While the DICER1 syndrome is classically caused by frameshift, nonsense or other mutations that ablate DICER1 function in a true heterozygous state, GLOW-syndrome mutations occurat specific residues within the RNase IIIb domain that only affect the function of this domain. The RNase IIIb domain is one of two RNase domains in DICER1 that cleave the pri-mRNAs. Specifically, the IIIb domain makes the cut that is necessary for the generation of 5p microRNAs. The result of these mutations is a loss of all 5p miRNAs and an increase in specific 3p miRNAs [11]. Analysis of the miRNA expression data showed that the increased 3p microRNAs target central growth signaling pathways including TGFβ and PI3K/AKT/mTOR [1, 10, 11]. We have hypothesized that it is this specific deregulation of the PI3K/AKT/mTOR signaling pathway that results in the syndromic phenotypes associated with RNase IIIb mutations. To test this hypothesis we have generated HEK293T cells with a specific deletion of exon 25, a genetic mutation which has been shown to be functionally synonymous with the “hot spot” mutations that cause the GLOW syndrome [1, 11, 12]. We queried if these cells have enhanced activation of PI3K/AKT/mTOR signaling and furthermore if they display abnormal cellular phenotypes.
2. MATERIAL METHODS
2.1. Crispr/Cas9 Cloning
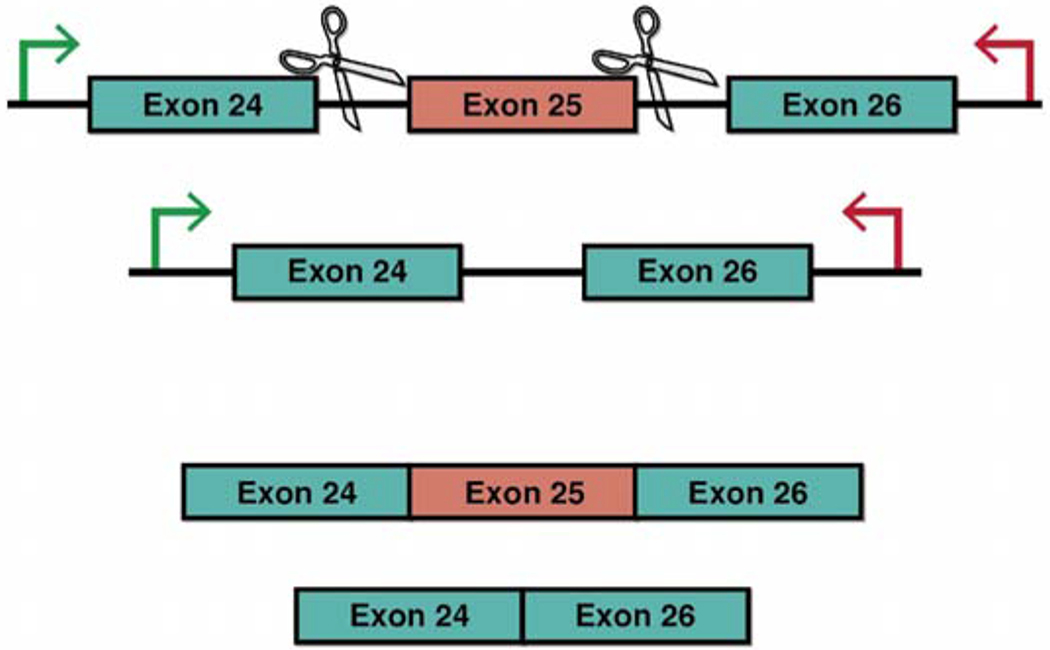
DICER1 Exon25 was deleted from HEK293T cells utilizing the Crispr/Cas9 plasmid (pSpCas9(BB)-2A-Puro (PX459) V2.0, #62988 [13]) from Addgene. Guide RNAs (gRNAs) were designed using Benchling software. gRNAs were selected which showed the highest “on-target” score [14] and “off-target” score [15]. The 20Bp gRNAs were flanked with CACC-on the 5’end of their forward oligo and AAAC- on the 5’end of their reverse oligo. These overhangs facilitate ligation into the parental plasmid once it is digested with BBSI. Briefly, the oligos were annealed and phosphorylated using T4 PNK enzyme (NEB, M0201S), annealed oligos were then diluted and added to a digestion-ligation reaction containing parental plasmid, tango buffer (Life Tech By5), DTT, ATP, BBSI (Thermo, FD1014) and T7 Ligase (NEB, M03185). After six cycles of 37°C for five minutes and 23°C for 5 min the reaction was treated with plasmid safe exonuclease (Epicentre, E3101K). Finally, plasmids were transformed into Stbl3 E.coli and grown under ampicillin selection. Plasmid mini-preps were performed on three colonies and Sanger sequencing confirmed the cloning event using the human U6 primer sequence: 5’-CGATACAAGGCTGTTA-3’. gRNAs were designed flanking exon 25 (Fig. 3).
Fig. (3).
Crispr targeting exon 25. We designed gRNAs that would target specific sequences in the introns flanking exon 25. This deletion has been shown to be functionally equivalent to RNase IIIb hot spot mutations that cause GLOW syndrome [12]. (A higher resolution/colour version of this figure is available in the electronic copy of the article).
2.2. Cell Culture and Transfection
HEK293T:
Cells were maintained with basal media including DMEM, PSN and 10% Fetal Bovine Serum (FBS). Twenty-four hours before transfection cells were liberated from a T25 flask with TrypLE™ Express Enzyme (1X). Cell concentration and viability were determined with the Invitrogen Countess I. After plating 2x10⁵ viable cells onto a 12-well culture dish, volume was brought to 1ml of basal media (DMEM high glucose, FBS, PSN). On the day of transfection, media was aspirated, and 500ul of basal media was added to each well. GeneIn Transfection reagent was combined with 2ug of plasmid, brought to a final volume of 200ul, vortexed and then incubated at room temperature for 15 minutes then added to each well. Cells were incubated for 24 hours, followed by 12-hour nutrient starvation in DMEM lacking glutamine, glucose and FBS.
2.3. Western Blot Analysis
Cells were lysed on 24 well or 12 well plates with 200μl or 400ul of passive lysis buffer, prepared with phosphatase and protease inhibitors and incubated by shaking at 4°C for one hour. After lysis, tubes were spun at 7500 Rcf for 5 minutes to collect debris. The supernatant was transferred to a new tube and protein concentration was determined with the CoommasiePlus Bradford (Life Technologies) reagent following manufacturer instructions. Protein samples were diluted to a final concentration of 10μg/20 μl into Western loading buffer with beta-mercaptoethanol and then boiled for 5 minutes. Western blots were run on 12% acrylamide gels followed by transfer onto nitrocellulose membranes utilizing the Transblot Turbo® from Biorad. The membrane was blocked in 5% bovine serum albumin in Tris-buffered saline plus Tween (TBST) for 30 minutes, then incubated in primary antibodies (listed in supplement) overnight. Blots were rinsed with Tris-Buffered Saline (TBS) and washed three times with TBST. Blots were incubated in rabbit secondary antibodies conjugated to horseradish peroxidase at a dilution of 1/3750. Following secondary incubation, membranes were rinsed with TBS and washed twice with TBST. Blots were exposed using Western Clarity reagents from BioRad and imaged on the Bio Rad ChemiDoc and viewed in ImageLab Software.
2.4. Immunofluorescence
One hundred thousand cells or a single sphere was plated on GelTrex (Invitrogen) coated coverslips. After 24 hours of growth, cells were fixed using paraformaldehyde for 20 minutes then blocked with 10% normal goat serum in TBST overnight. The following day coverslips were washed three times in TBST. Coverslips were incubated in primary antibody in 3% BSA in TBST for one hour. Coverslips were then washed three times in TBST and incubated in secondary antibody (Jackson Laboratories, AffiniPure Donkey AntiRabbit, 711-165-152, Dilution 1/1000 and Invitrogen in 3% BSA in TBST for one hour. Coverslips were then washed three times in TBST and then three times in water. Coverslips were mounted on glass slides using ProLong® Gold AntifadeMountant with DAPI (Invitrogen, P36931). Slides were imaged using a Zeiss LSM-800.
2.5. Statistical Analysis
Western blots were run in biological triplets and subjected to 1-tailed type 2 students T-test. Standard deviations are presented as a function of each graphical representation.
3. RESULTS
3.1. Generation of DICER1 Exon 25 Deleted HEK293Ts
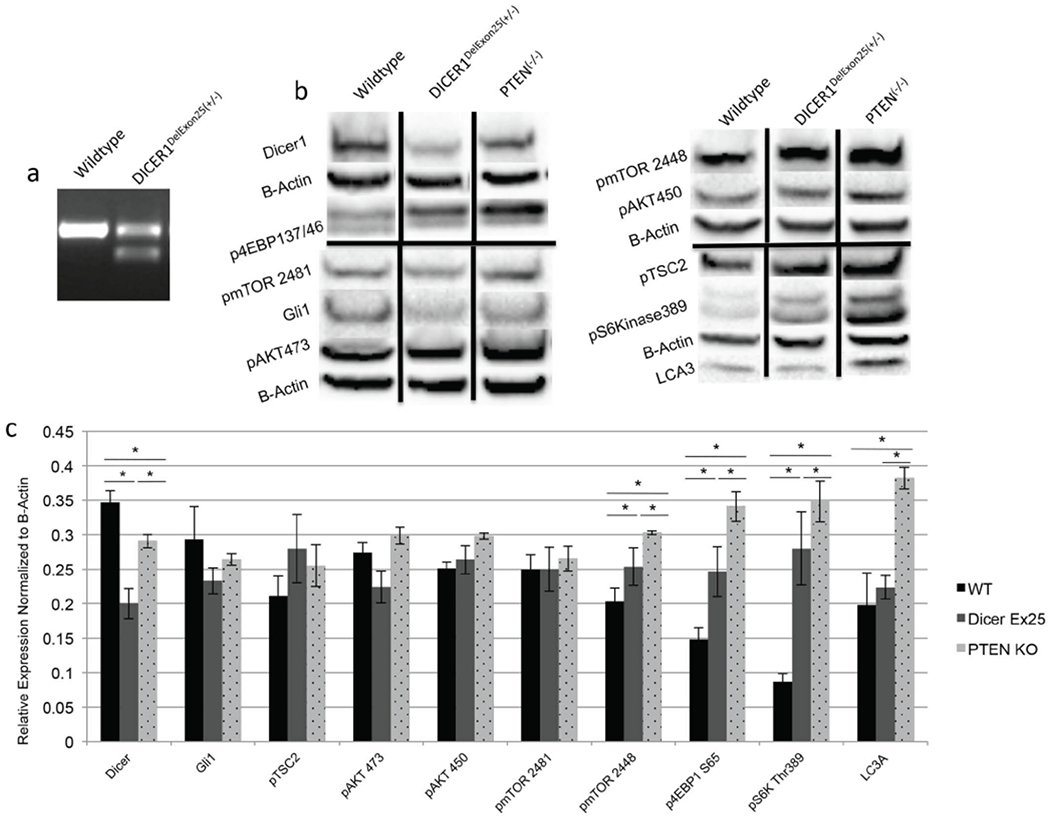
We aimed to model the hot spot mutations observed in the GLOW syndrome by deletion of exon 25 in DICER1. Exon skipping is a documented phenomenon which is associated with functionally identical DICER1 mutations including c.5429A>G and c.5438A>G which are associated with Wilms’ tumor [12]. This deletion was achieved with Crispr/ Cas9 guide RNAs (gRNAs) that target intronic regions flanking Exon 25 (DICER1deExon25 (+/−)). We confirmed the deletion utilizing RT-PCR primers with homology to exon 24 and exon 26. We confirmed the presence of the smaller RNA band via RT-PCR, which is not present in wild-type cells transfected with only Cas9 plasmids. The identified band is of the correct size, which confirms that the gRNAs are targeting efficiently and correctly (Fig. 4a, and Fig. S1). As has been previously shown this smaller mRNA lacking exon 25 can be translated in vivo into a functional DICER1 protein, which lacks RNase IIIb function [12].
Fig. (4).
Deletion of Exon 25 in DICER1 results in activation of mTORC1. (a) RT-PCR confirming deletion of exon 25 from DICER1 mRNA, the band in the Crispr/Cas9 cells is the correct size for transcripts lacking exon 25 (b) Western blot analysis comparing DICER1Delex25(+/−) to PTEN(−/−) cells. (c) Quantification of the western blots show significant increases in p4EBP1 and pS6Kinase and decreases in pAKT450, pAKT473 and DICER1. Black vertical bars show standard deviations. * denotes p-value <.05. (A higher resolution/colour version of this figure is available in the electronic copy of the article).
3.2. DICER1delExon25 (+/−) Cells have Increased Activation of mTOR Signaling
Once the cellular model of loss of RNase IIIB function was created, we hypothesized that these cells would demonstrate increased or altered PI3K/AKT/mTOR signaling. We confirmed this hypothesis via Western blot analysis. As a positive control, we utilized PTEN(−/−) HEK293T cells, generated via Crispr/Cas9 editing in a similar fashion to the DICER1deExon25(+/−) cells. PTEN(−/−) HEK 293T cells have increased PI3K/AKT/mTOR signaling (Fig. 4b–d). Firstly, we confirmed that the cells express decreased full-length DICER1 when compared to WT and PTEN(−/−) cells. We next confirmed our hypothesis and demonstrate that DICER1delExon25 (+/−) cells have increased mTORC1 signaling evidenced by increased phosphorylation of its two main substrates p4EBP1(Ser65) and pS6Kinase(Thr389). This activation is significantly greater than WT cells however less than that present in PTEN(−/−) cells. The DICER1delExon25 (+/−) x cells also show decreased activation of mTORC2 targets pAKT(Ser473), and pAKT(Thr450). In contrast, the PTEN(−/−) cells demonstrate increased phosphorylation of these same targets, suggesting a potential mTORC1/mTORC2 negative feedback loop which is disrupted in PTEN(−/−) cells, however intact in the DICER1delExon25 (+/−) model. Additionally, DICER1delExon25 (+/−) cells do not have changes in autophagy as evidenced by the lack of changes in LC3A, in contrast to what is observed in PTEN(−/−) cells. In addition, and perhaps most interestingly, these cells show a possible decrease in hedgehog pathway signaling as the expression of GLI1 is decreased.
3.3. DICER1delExon25 (+/−) Cells Demonstrate the Ability to form Spheres when Serum Starved
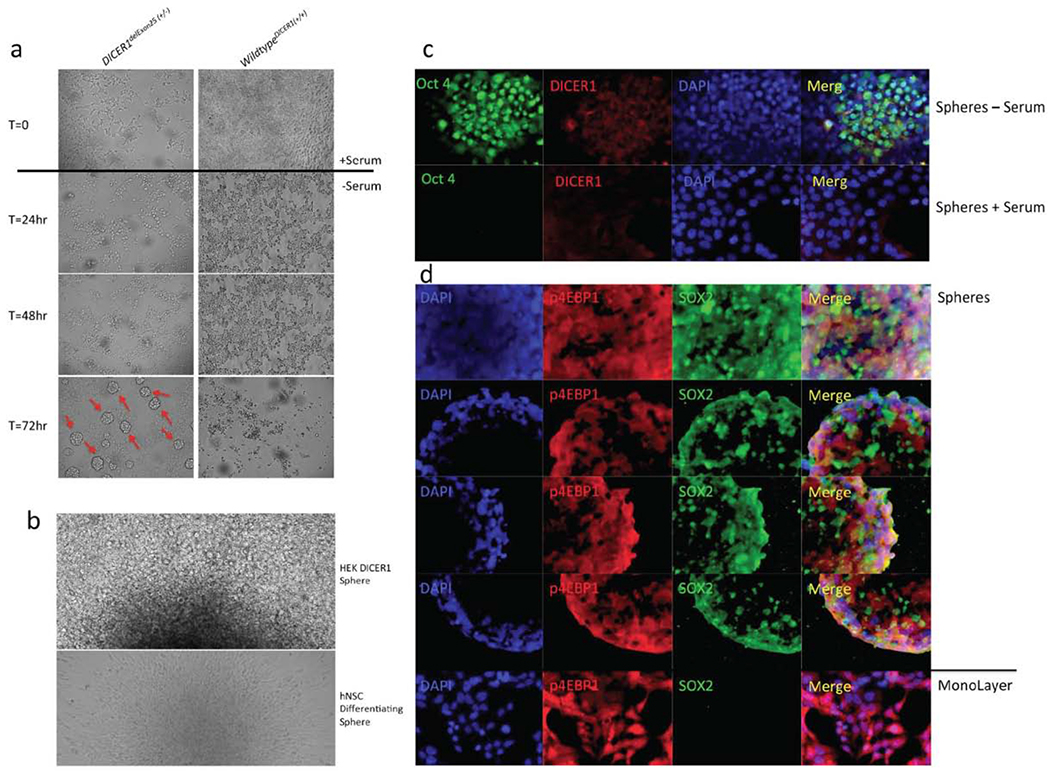
We attempted to correct the increased mTOR activation in DICER1delExon25 (+/−)cells by removing fetal bovine serum (FBS) from their growth media; FBS includes amino acids, growth factors and insulin that stimulate this pathway. Surprisingly, these cells do not only maintain the ability to grow and divide in the absence of previously documented essential amino acids, growth factors and hormones, but also begin to form spheres after 72 hours; this is the time point when wild type cells enter apoptosis due to the lack of nutrients in the starvation media (Fig. 5a). These spheres can be maintained in serum-free media and proliferate well in stem cell media, which includes F12, B27, EGF, and bFGF. Upon reintroduction of serum, the spheres become adherent, send out projections, and “spread.” This pattern is most analogous to the behavior of primary human neural spheres that, upon the withdrawal of FGF and EGF, will first send out radial glial projections before differentiated cells types migrate away from the sphere center. This led us to hypothesize that these cells were behaving as “progenitors” of some type and we next investigated this possibility (Fig. 5b).
Fig. (5).
DICER1Del25(+/−) Cells demonstrate the ability to form Oct4+ and SOX2+ spheres in culture. (a) After 72 hours of growth without serum DICER1Del25(+/−) continue to divide and form spheres which detach (b) upon reintroduction of serum the spheres attach and spread. (c) spheres are Oct4 positive (d) spheres are Sox2 positive. (A higher resolution/colour version of this figure is available in the electronic copy of the article).
3.4. DICER1delExon25 (+/−) Spheres Display Early Stem-Like Progenitor Markers Including Oct4 and SOX2
To assess the identity of the cells within the sphere we undertook immunofluorescence staining for the well-characterized Oct4 and SOX2 markers of pluripotency. The DICER1delExon25 (+/−) cells were positive for Oct4, which displays a nuclear staining pattern. Additionally, these cells demonstrate increased DICER1 staining. Upon reintroduction of serum for 24 hours these cells revert the Oct4 and increased DICER1 staining (Fig. 5c). Additionally, the spheres are positive for SOX2. While this staining pattern is predominately nuclear, it also demonstrates some cytoplasmic staining which may be due to the fact that the antibody is trapped in the sphere microenvironment or that the cells in the sphere are so close together it obstructs antibody penetration. We also show the presence of phosphorylated 4EBP1 (Ser65) in the starved spheres, which is reflective of the presence of activated mTOR signaling in these cells even in the absence of serum. Most interestingly, the p4EBP1 staining is maintained, and is similar to that of WT Hek cells in monolayer grown in the presence of serum (Fig. 5d).
3.5. DICER1delExon25 (+/−) Cells Demonstrate Extremely Abnormal Cellular Phenotypes
Despite the presence of loss of function biallelic mutations in DICER1 associated with PPB, all cases of Wilms tumor associated with the syndromic or somatic distribution of RNAseIIIb domain mutations in DICER1 are always observed in the heterozygous state. This suggests that these heterozygous mutations oncogenic and associated with the hyperproliferative phenotype of Wilms tumor. We attempted to generate DICER1delExon25 (−/−) cells which we hypothesized would demonstrate even more activation of mTOR signaling due to the true lack of all 5p miRNAs. Interestingly, clonal DICER1delExon25 (−/−) cells do not proliferate well in culture making the assessment of their signaling impossible. We were able to generate a few of these clonal cell lines, which demonstrate extremely abnormal cell morphology. Not only are these cells larger than their WT predecessors but also branch extensively (Fig. 6). It should be noted that the WT cells that were used for comparison in these figures were cells that underwent all steps of the transfection, genomic editing, and clonal passaging, but were not edited during the transfection. Therefore, the likelihood that this cell phenotype was due to manipulation outside of the homozygous loss of exon25 is unlikely. These findings demonstrate that homozygous DICER1delExon25 (+/−) cells are incompatible with cell viability and explain the occurrence of these hotspot mutations in the heterozygous state in somatic cases of Wilms tumor and in GLOW syndrome.
Fig. (6).
Homozygous DICER1delExon25 (−/−) Cells display abnormal phenotypes. We were able to grow a few DICER1 homozygous deleted cells; they do not grow well in culture, but the few that do survive display severely abnormal cell phenotypes including increased cell size, abnormal branching patterns and non-HEK morphology. (A higher resolution/colour version of this figure is available in the electronic copy of the article).
4. DISCUSSION
4.1. Deletion of Exon25 in DICER1 Activates mTOR Signaling
We have shown that in vitro deletion of Exon25 from HEK293T cells activates mTORC1 signaling. Compared to PTEN(−/−) cells this increase is less but still significantly greater than wild type cells. This confirms our hypothesis that the overgrowth phenotypes associated with GLOW syndrome display phenotypic overlap with PI3K/AKT-related overgrowth syndromes due to a deregulation of this key growth-signaling pathway. Specifically, the presence of macrocephaly with development delay and autism is most similar to PTEN associated autism/macrocephaly syndrome. A signaling event which seems to be PTEN-specific is the strong activation of mTORC2 which was not observed in the DICER1delExon25 (+/−) cells. This observation supports the presence of mTORC1/mTORC2 negative feedback loop, which is disrupted in PTEN(−/−) cells however not in DICER1delExon25 (+/−). This difference may account for some of the phenotypic differences between PTEN versus GLOW syndrome patients. Specifically, macrocephaly is reproducibly reported to be extreme (OFC > 3SD) in PTEN cases, however milder in GLOW syndrome cases. Additionally, the stratification of neoplasms to specific tissues within the GLOW syndrome is unique and distinct from those in the PTEN-related neoplastic syndromes, possibly due to this molecular difference. Lastly, we propose that the lung, kidney and brain are most susceptible to miRNAs imbalance of 3p/5p populations. This results in alterations to the PI3K/AKT signaling and development of these tissues [5, 7, 16]. To further expand upon the mechanism of cross talk between miRNAs and the mTOR-signaling cascade we identified specific 3p miRNAs that are increased in DICER1delExon25 (−/−) cells and their potential targets.
4.2. Specific miRNA Analysis
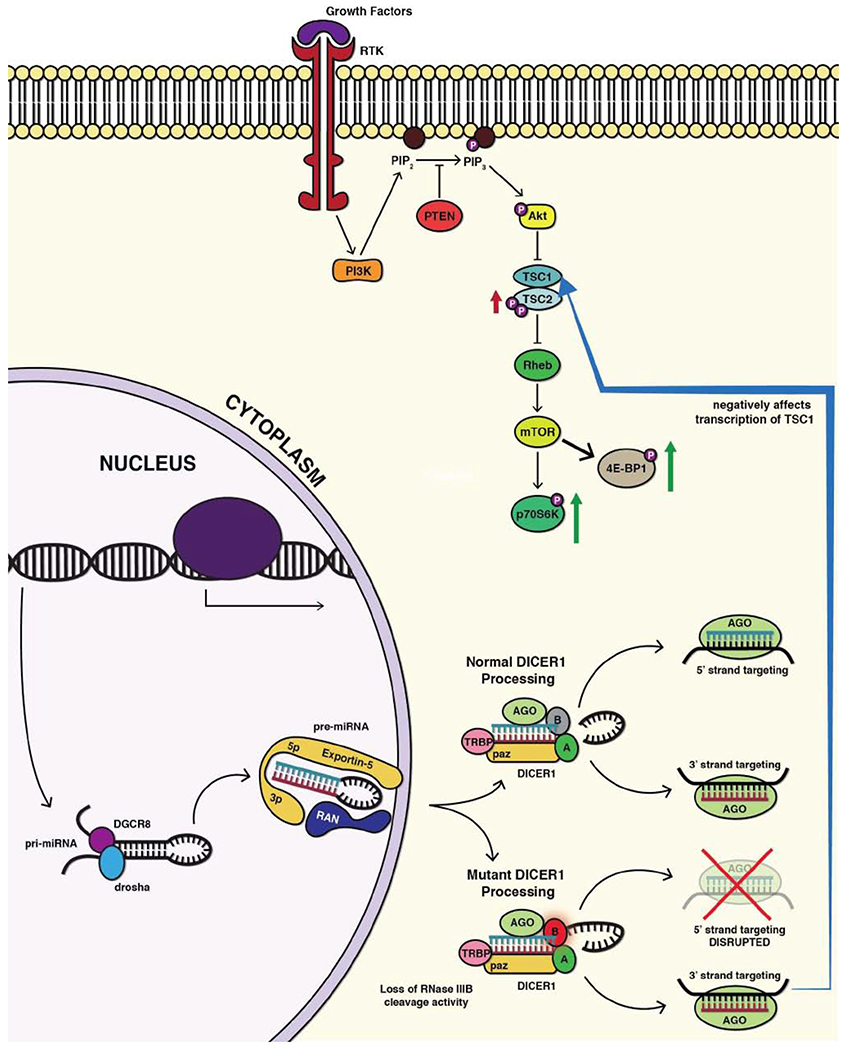
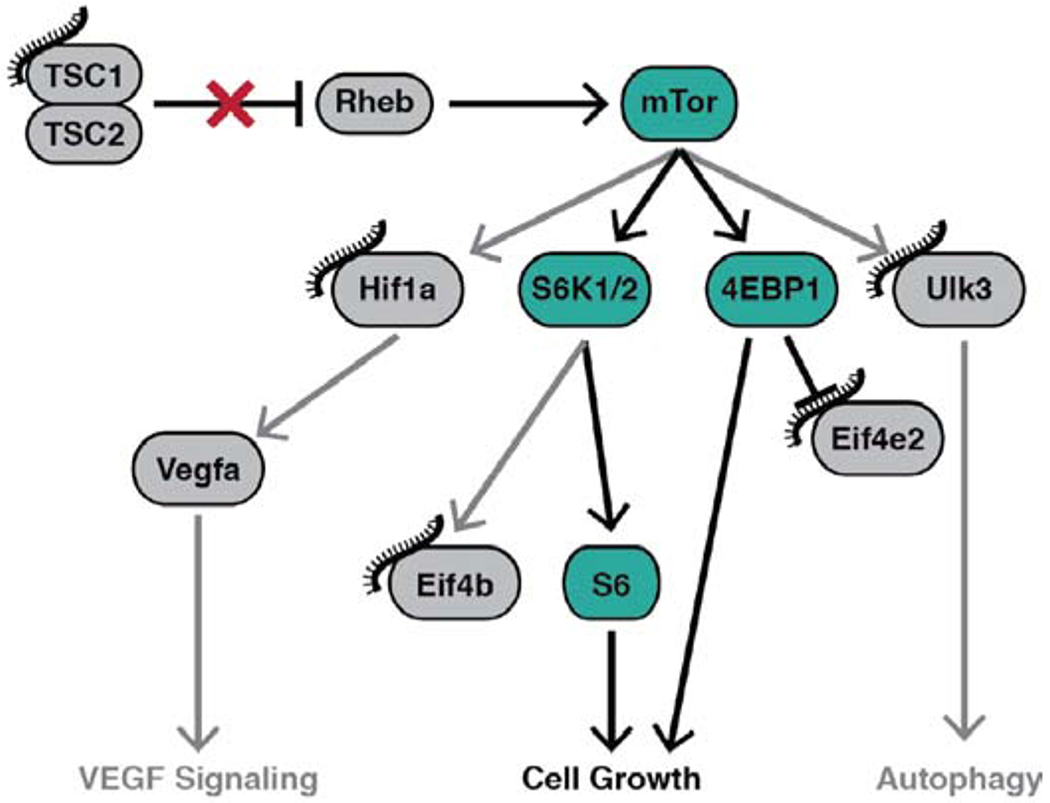
The most comprehensive transcriptional understanding of DICER1 “hot spot” mutations was reported by Anglesio et al. from engineered DICER1(−/−) ES cells which were then infected with donor lentiviruses carrying one of four DICER1 “hot spot” mutations (D1709N, D1810Y, E1813Q, and D1709A). This generated a comprehensive expression signature when compared to WT DICER1(+/+) ES cells. They convincingly show that the 5p miRNA population is ablated from these cells and additionally that specific 3p miRNAs demonstrate marked increased expression [11]. We mined this data and screened to identify the 3p miRNAs that show the greatest difference in expression [1, 11]. We have mapped the targets of these miRNAs and show that they target numerous levels and effectors of mTOR signaling. Most upstream they target TSC1, a negative regulator of mTOR signaling that in its absence allows Rheb to activate mTOR. Furthermore, we see an increase in pTSC2, which is known to inactivate it and discourage TSC1-TSC2 complex formation (Fig. 7). Downstream to this activation event we have furthermore identified target substrates, which seem to focus the activated mTOR signaling into pS6Kinase and ultimately S6, a potent pro-proliferative driver (Fig. 8). Our data is confirmatory of this as increases in pS6Kinase(Thr389) were observed. In addition to the pro-proliferative signal, we have observed a cellular phenotype that is affecting cell identity and stemness.
Fig. (7).
DICER1 hotspot mutations and loss of Exon 25 result in loss of 5p miRNAs and increased 3p miRNAs. (A higher resolution/colour version of this figure is available in the electronic copy of the article).
Fig. (8).
Specific increased 3p miRNAs target mTOR signaling. We show that certain miRNAs affected by these pathogenic mutations target negative regulators of mTOR: namely TSC2. Additionally, downstream targets are affected which streamlines mTOR signaling into S6kinase activation of cell proliferation/growth. We have provided evidence for this via the increased pS6Kinase levels on our DICER1delExon25 (+/−) cell model. (A higher resolution/colour version of this figure is available in the electronic copy of the article).
Mutations in DICER1 that ablate the RNaseIIIb function result in loss of 5p miRNAs and increased 3p miRNAs. Although these mutations are enriched in tumors and present in GLOW syndrome, the mechanistic link to overgrowth and proliferation was not known. We have provided evidence that these mutations result in direct activation of mTOR signaling which explains their phenotypic overlap with PI3K-related overgrowth syndromes.
4.3. Deletion of Exon 25 of DICER1 Allows Cells to form Spheres and Divide in the Absence of Serum
As we have presented, DICER1delExon25 (+/−) cells have the ability to grow in the absence of serum, and additionally form SOX2+ and Oct4+ spheres. Upon the reintroduction of serum to these cells they attach to the culture vessel and begin to phenotypically resemble their progenitor predecessors. The role for miRNAs in “sternness” has been proven and classically described in the epidermis [17]; however, the role of DICER1 mutations and their resulting tumors is debated [2]. Our data support that miRNAs are essential in maintaining a terminally differentiated state and furthermore that loss of specific microRNA populations, namely the 5p miRNAs, can result in cell identity changes associated with progenitor properties. In the clinical context, this paradigm is fitting as Wilms tumor blastemal stem cells have been shown to dedifferentiate, propagate, and add to tumor volume and mass [18]. Wilms tumor can also be referred to as nephroblastoma, which is preceded by nephrogenic rests defined by their embryonal or undifferentiated histology [19]. Similarly, the lung cysts or Pleuropulmonary Blastoma tumors (PPB) are reported to arise from primitive, likely stem, mesenchymal cells [20]. The gain in ability to dedifferentiate observed in our cell model may be reflective of DICER1’s essential role in the differentiation process and may be furthermore pathogenic in specific tissue types and result in pediatric blastoma-like tumors. Temporal differentiation is an essential aspect of development and it is not surprising that disruption of this eloquent coordination results in devastatingly altered phenotypes.
4.4. Therapeutic Approaches to GLOW Syndrome
From our findings, we propose that GLOW syndrome, and possibly DICER1 syndrome cases at large, may benefit from the use of PI3K/AKT/mTOR inhibitors such as rapamycin and TORIN-1. Additionally, blastoma-type tumors in these cases, and others may respond to drugs which promote differentiation. Such chemotherapies have been shown to be effective in acute myeloid leukemia cells [21]. In AML, cell treatment facilitates the identification of cancerous cells by natural killer NK cells and ultimate cell lysis and clearance [21]. We propose that a similar response may be seen in pediatric tumors composed of undifferentiated cells, or where cellular dedifferentiation plays an important role including Wilms [18] and pleuropulmonary blastoma (PPB) tumors [20]. Additionally, the mutations associated with GLOW syndrome present a mosaic pattern of distribution, most likely due to them not being tolerated when inherited in a more widespread distribution in keeping with Happle’s hypothesis [22]. The tumors in these cases have devastating sequalae as they often metastasize; we propose that cases identified in the future may benefit from early identification, management and similar interventions.
CONCLUSION
We show that DICER1 hot spot or loss of exon 25 mutations activate the PI3K/AKT/mTOR pathway. This cross talk accounts for the phenotypic overlap observed between these cases and those with PTEN mutations, namely the macrocephaly and neurobehavioral abnormalities, including autism. Additionally, we show that DICER1delExon25 (+/−) cells develop the ability to dedifferentiate and form spheres in the absence of serum. We propose that the non-PI3K/AKT congruent phenotypes in the GLOW syndrome are due to a disruption of differentiation and the persistence of undifferentiated cells in the newborn. This is exemplified in the tumors types of GLOW syndrome cases: Wilms and pleuropulmonary blastoma (PPB) tumors. We propose that the novel use of pro-differentiation chemotherapies in combination with PI3K/AKT/mTOR inhibition would benefit these cases and may have far-reaching implications for the management of the blastoma-like class of pediatric tumors.
Supplementary Material
ACKNOWLEDGEMENTS
We thank the patients and their families who participated in the original reporting of GLOW syndrome. Also Allen Lipton for his aide in generating the graphics presented in this manuscript. Finally the UCLA Clinical Genomics Center and UCLA Medical Scientist Training Program for their support.
FUNDING
This work was supported by March of Dimes (Grant #6-FY12-324, JAM-A), UCLA Children’s Discovery Institute, UCLA CART (NIH/NICHD grant# P50-HD-055784, JAMA), NIH/NCATS UCLA CTSI (Grant # UL1TR000124, JAM-A), Autism Speaks Grant #9172 (SK) and the UCLA Caltech MSTP NIH T32GM008042 (SK). The confocal images were acquired using the UCLA IDDRC/UCTraN Microscopy Core, supported by the NICHD/NIH U54 Grant, HD087101, LSM-800.
Footnotes
ETHICS APPROVAL AND CONSENT TO PARTICIPATE
Not applicable.
HUMAN AND ANIMAL RIGHTS
No Animals/Humans were used for studies that are base of this research.
CONSENT FOR PUBLICATION
Not applicable.
AVAILABILITY OF DATA AND MATERIALS
Not applicable.
CONFLICT OF INTEREST
The authors declare no conflict of interest, financial or otherwise.
SUPPLEMENTARY MATERIAL
Supplementary material is available on the publisher’s website along with the published article.
Publisher's Disclaimer: DISCLAIMER: The above article has been published in Epub (ahead of print) on the basis of the materials provided by the author. The Editorial Department reserves the right to make minor modifications for further improvement of the manuscript.
REFERENCES
- [1].Klein S, Lee H, Ghahremani S, et al. Expanding the phenotype of mutations in DICER1: Mosaic missense mutations in the RNase IIIb domain of DICER1 cause GLOW syndrome. J Med Genet 2014; 51(5): 294–302. [ 10.1136/jmedgenet-2013-101943] [DOI] [PMC free article] [PubMed] [Google Scholar]
- [2].Foulkes WD, Priest JR, Duchaine TF. DICER1: Mutations, microRNAs and mechanisms. Nat Rev Cancer 2014; 14(10): 662–72. [ 10.1038/nrc3802] [DOI] [PubMed] [Google Scholar]
- [3].Desvignes T, Batzel P, Berezikov E, et al. miRNA nomenclature: A view incorporating genetic origins, biosynthetic pathways, and sequence variants. Trends Genet 2015; 31(11): 613–26. [ 10.1016/j.tig.2015.09.002] [DOI] [PMC free article] [PubMed] [Google Scholar]
- [4].Yan S, Jiao K. Functions of miRNAs during mammalian heart development. Int J Mol Sci 2016; 17(5): E789. [ 10.3390/ijms17050789] [DOI] [PMC free article] [PubMed] [Google Scholar]
- [5].Schiffman JD, Geller JI, Mundt E, Means A, Means L, Means V. Update on pediatric cancer predisposition syndromes. Pediatr Blood Cancer 2013; 60(8): 1247–52. [ 10.1002/pbc.24555] [DOI] [PubMed] [Google Scholar]
- [6].Hill DA, Ivanovich J, Priest JR, et al. DICER1 mutations in familial pleuropulmonary blastoma. Science 2009; 325(5943): 965. [ 10.1126/science.1174334] [DOI] [PMC free article] [PubMed] [Google Scholar]
- [7].Stewart CJ, Charles A, Foulkes WD. Gynecologic manifestations of the DICER1 syndrome. Surg Pathol Clin 2016; 9(2): 227–41. [ 10.1016/j.path.2016.01.002] [DOI] [PubMed] [Google Scholar]
- [8].Faure A, Atkinson J, Bouty A, et al. DICER1 pleuropulmonary blastoma familial tumour predisposition syndrome: What the paediatric urologist needs to know. J Pediatr Urol 2016; 12(1): 5–10. [ 10.1016/jjpurol.2015.08.012] [DOI] [PubMed] [Google Scholar]
- [9].Slade I, Bacchelli C, Davies H, et al. DICER1 syndrome: Clarifying the diagnosis, clinical features and management implications of a pleiotropic tumour predisposition syndrome. J Med Genet 2011; 48(4): 273–8. [ 10.1136/jmg.2010.083790] [DOI] [PubMed] [Google Scholar]
- [10].Khan NE, Bauer AJ, Doros L, et al. Macrocephaly associated with the DICER1 syndrome. Genet Med 2017; 19(2): 244–8. [ 10.1038/gim.2016.83] [DOI] [PMC free article] [PubMed] [Google Scholar]
- [11].Anglesio MS, Wang Y, Yang W, et al. Cancer-associated somatic DICER1 hotspot mutations cause defective miRNA processing and reverse-strand expression bias to predominantly mature 3p strands through loss of 5p strand cleavage. J Pathol 2013; 229(3): 400–9. [ 10.1002/path.4135] [DOI] [PubMed] [Google Scholar]
- [12].Wu MK, Sabbaghian N, Xu B, et al. Biallelic DICER1 mutations occur in Wilms tumours. J Pathol 2013; 230(2): 154–64. [ 10.1002/path.4196] [DOI] [PubMed] [Google Scholar]
- [13].Ran FA, Hsu PD, Wright J, Agarwala V, Scott DA, Zhang F. Genome engineering using the CRISPR-Cas9 system. Nat Protoc 2013; 8(11): 2281–308. [ 10.1038/nprot.2013.143] [DOI] [PMC free article] [PubMed] [Google Scholar]
- [14].Doench JG, Fusi N, Sullender M, et al. Optimized sgRNA design to maximize activity and minimize off-target effects of CRISPR-Cas9. Nat Biotechnol 2016; 34(2): 184–91. [ 10.1038/nbt.3437] [DOI] [PMC free article] [PubMed] [Google Scholar]
- [15].Hsu PD, Scott DA, Weinstein JA, et al. DNA targeting specificity of RNA-guided Cas9 nucleases. Nat Biotechnol 2013; 31(9): 827–32. [ 10.1038/nbt.2647] [DOI] [PMC free article] [PubMed] [Google Scholar]
- [16].Doros L, Schultz KA, Stewart DR, Bauer AJ, Williams G, Rossi CT, et al. DICER1-related disorders. In: Pagon RA, Adam MP, Ardinger HH, Wallace SE, Amemiya A, Bean LJH, et al. , editors Gene Reviews(R) Seattle. Seattle, (WA)1993. [Google Scholar]
- [17].Aberdam D, Candi E, Knight RA, Melino G. miRNAs, ‘sternness’ and skin. Trends Biochem Sci 2008; 33(12): 583–91. [ 10.1016/j.tibs.2008.09.002] [DOI] [PubMed] [Google Scholar]
- [18].Shukrun R, Pode-Shakked N, Pleniceanu O, et al. Wilms’ tumor blastemal stem cells dedifferentiate to propagate the tumor bulk. Stem Cell Reports 2014; 3(1): 24–33. [ 10.1016/j.stemcr.2014.05.013] [DOI] [PMC free article] [PubMed] [Google Scholar]
- [19].Beckwith JB. Nephrogenic rests and the pathogenesis of Wilms tumor: Developmental and clinical considerations. Am J Med Genet 1998; 79(4): 268–73. [] [DOI] [PubMed] [Google Scholar]
- [20].Hill DA, Jarzembowski JA, Priest JR, Williams G, Schoettler P, Dehner LP. Type I pleuropulmonary blastoma: Pathology and biology study of 51 cases from the international pleuropulmonary blastoma registry. Am J Surg Pathol 2008; 32(2): 282–95. [ 10.1097/PAS.0b013e3181484165] [DOI] [PubMed] [Google Scholar]
- [21].Rohner A, Langenkamp U, Siegler U, Kalberer CP, Wodnar-Filipowicz A. Differentiation-promoting drugs up-regulate NKG2D ligand expression and enhance the susceptibility of acute myeloid leukemia cells to natural killer cell-mediated lysis. Leuk Res 2007; 31(10): 1393–402. [ 10.1016/j.leukres.2007.02.020] [DOI] [PubMed] [Google Scholar]
- [22].Happle R Lethal genes surviving by mosaicism: A possible explanation for sporadic birth defects involving the skin. J Am Acad Dermatol 1987; 16(4): 899–906. [ 10.1016/S0190-9622(87)80249-9] [DOI] [PubMed] [Google Scholar]
Associated Data
This section collects any data citations, data availability statements, or supplementary materials included in this article.


