Abstract
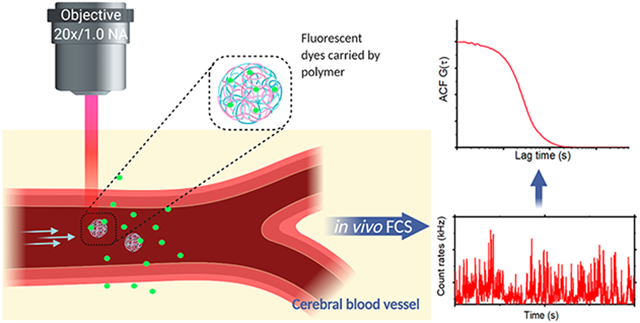
We present the application of multiphoton in vivo fluorescence correlation spectroscopy (FCS) of fluorescent nanoparticles for the measurement of cerebral blood flow with excellent spatial and temporal resolution. Through the detection of single nanoparticles within the complex vessel architecture of a live mouse, this new approach enables the quantification of nanoparticle dynamics occurring within the vasculature along with simultaneous measurements of blood flow properties in the brain. In addition to providing high resolution blood flow measurements, this approach enables real-time quantification of nanoparticle concentration, degradation, and transport. This method is capable of quantifying flow rates at each pixel with submicron resolution to enable monitoring of dynamic changes in flow rates in response to changes in the animal’s physiological condition. Scanning the excitation beam using FCS provides pixel by pixel mapping of flow rates with subvessel resolution across capillaries 300 μm deep in the brains of mice.
Keywords: Multiphoton in vivo imaging, fluorescence correlation spectroscopy (FCS), cerebral blood flow (CBF), nanoparticles
Graphical Abstract
Cerebral blood flow (CBF) measurements provide critical information about physiological and pathological processes within the central nervous system (CNS). The complex microvascular network plays a fundamental role within the CNS, where neuronal activity regulates the flow of oxygen and nutrients.1,2 Understanding blood flow dynamics with high spatiotemporal resolution is essential for unraveling the role of vascular dysfunction in a variety of pathological processes.3,4 Ideally, flow rates could be quantified with subcapillary resolution, providing the capability to map flow rate cross-sections within individual vessels in order to distinguish between flow within the center vessel compared to that in the vicinity of the wall of the vessel. Existing methods for blood flow measurements using multiphoton laser-scanning microscopy (MPLSM) provide the capability to measure changes over time by utilizing high concentrations of fluorescent dyes in order to visualize vessels and produce a contrast with red blood cells (RBCs).4-6 However, multiphoton blood flow measurements have not achieved the same spatial and temporal resolution available for multiphoton imaging.7,8 This is in part because they are limited by the scan rate of the microscope and the requirement to track RBCs over a segment of the vessel, rather than providing a pixel-level readout of the flow rate.4,9
To date, several reports have demonstrated the use of fluorescence correlation spectroscopy (FCS) to measure the flow profiles and determine flow rates in microfluidic devices with high sensitivity.10-12 Microfluidic devices are often used in biomedical and chemical studies to model flow in systems like the vasculature. FCS is a solution-based technique that is traditionally used to measure diffusion, surface binding, and molecular concentration in vitro.13-19 FCS depends on the detection of photons from molecules moving through a defined detection volume, and the subsequent correlation of the photon time trace yields a signature of fluorescence fluctuations related to molecules moving in and out of the focal volume.17,20 The size and shape of the focal volume depends on the optical setup, including the excitation wavelength and intensity, the numerical aperture of the objective, and the detection pinhole.21 FCS has been utilized for live cell measurements of protein diffusion, interactions between protein complexes, and subcellular localization.22-24 Multiphoton excitation has also extended the utility of FCS applications.25-27 One critical application of FCS is the measurement of nanoparticle properties in solution including particle degradation, flow rates, and concentration.28-33 While fluorescent nanoparticles are regularly used as labels in live animals,34-36 including for blood flow measurements,37 these studies are primarily limited to multiphoton imaging for particle tracking38,39 and lack the capability to quantify nanoparticle concentrations or monitor particle decomposition. Here, we aim to overcome the limitations of current methods for measuring nanoparticles in live animals in order to utilize a new approach for blood flow measurements in vivo by combining multiphoton excitation with fluorescence correlation spectroscopy (FCS), providing high spatiotemporal resolution measurements of blood flow rates in the CNS of live animals. This approach provides a high sensitivity method with the capability to quantify flow rates with pixel by pixel mapping across vessels while using only nanomolar concentrations of fluorescent molecules. In vivo multiphoton FCS simultaneously tracks nanoparticle concentration and provides the capability to measure dynamic changes including particle degradation that can be correlated to vessel size and locations within the brain. We applied this in vivo multiphoton FCS approach to mapping flow velocities across vessel sections at a subvessel resolution, where the flow rate and concentration of molecules can be measured in a single pixel (defined by the diffraction limited focal volume) and without the need for scanning.
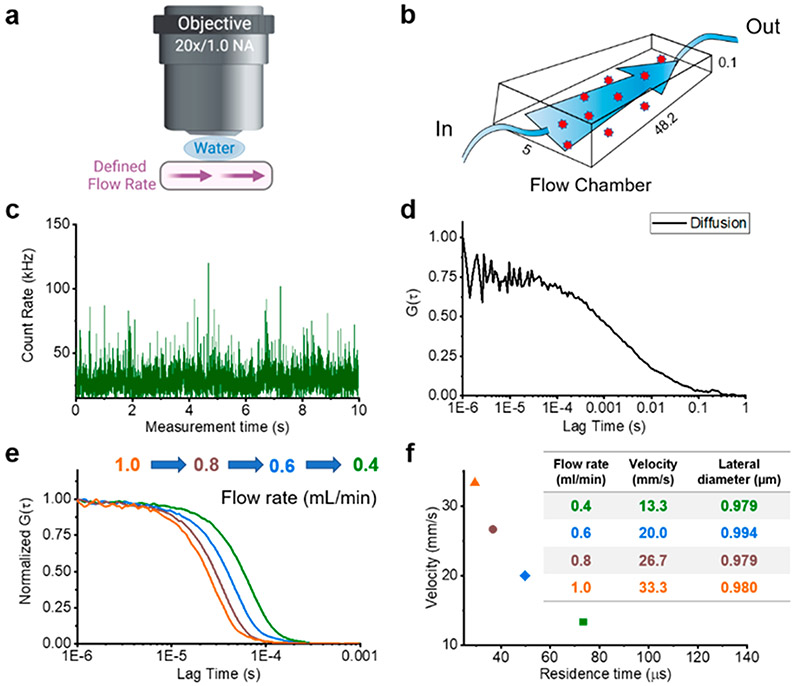
We implemented in vivo FCS measurements using an upright multiphoton microscope with a tunable laser, with an emission spectrum from 680 to 1300 nm. Initially, we performed a series of calibration measurements with known volumetric flow rates and cross-sectional areas in a microfluidic chamber (Figure 1a and b). A representative photon-counting time trace and its autocorrelation curve for freely diffusing molecules, i.e., without flow, are shown in Figure 1c and d. After extracting the diffusion parameters in the absence of flow, we incrementally increased the flow rates, while measuring the residence time of the molecules within the focal volume. The flow rate dependent residence time was extracted from the FCS autocorrelation. The fluctuations of the fluorescence intensity I(τ) resulting from fluorescent molecules flowing through the focal volume were analyzed with the temporal autocorrelation function (eq 1):
| (1) |
Figure 1.
Two-photon fluorescence correlation spectroscopy (FCS) calibration. (a) Schematic drawing of the multiphoton in vivo FCS setup through a glass slide covered flow chamber. (b) Schematic and dimensions of the microfluidic device. (c) Fluorescence intensity time trace recorded from freely diffusing CF488-Dextran 250 kDa. (d) The corresponding autocorrelation function (ACF) (G(τ)) reveals the diffusion properties of CF488-Dextran 250 kDa. (e) Normalized ACFs resulting from different rates of flow in the microfluidic device which was used to calibrate the optical setup. We tested a series of flow rates (0.4, 0.6, 0.8, and 1.0 mL/min) with CF488-Dextran 250 kDa to extract the residence times. (f) Flow velocities with measured flow residence times show a linear relationship, which yields a calculated focal lateral diameter of 0.98 μm for the optical setup.
In the presence of flow, the fitting model of the autocorrelation function, G(τ), has the following form:
| (2) |
Here τd represents the diffusion time of the fluorescent molecules, τf denotes the average residence time of the molecule flowing through the focal volume, and N is the average number of particles in the detection volume. In the case where the diffusion is much slower than the flow rate (τd ≫ τf), the equation simplifies to
| (3) |
We calculated the residence time for a series of volumetric flow rates (flow volumes of 0.4 to 1.0 mL/min) to extract the diameter of the focal volume (Figure 1e and f). We observed a diameter of 0.98 μm with a linear relationship between the residence times and the flow volume (Figure 1f). The flow rate was again measured with a series of fluorophores of different molecular weights to validate the consistency of the focal diameter and the residence time for a given flow volume (Supplementary Figure S1 and Supplementary Tables 1 and 2).
To investigate whether multiphoton excitation FCS has the capability to measure flow rates in vivo, we extended our studies to measure blood flow in the cerebrovasculature of live animals. Initial experiments were performed using a thinned-skull preparation to enable optical penetration into the mouse brain. Animals were intravenously injected with both a high concentration of labeled nanoparticle to visualize and image the vascular architecture and a low concentration of labeled nanoparticle used as an FCS tracker molecule to enable blood flow measurements. Multiphoton imaging from 100 to 300 μm deep revealed vessels ranging from capillaries (<10 μm) to much larger vessels. One of the major difficulties of implementing simultaneous multicolor FCS measurements and vascular imaging by two-photon excitation is selection of the fluorescently labeled nanoparticle. We compared several different fluorescent nanoparticles including FITC-dextran, rhodamine B-dextran, CF488-dextran, CF568-dextran, Quantum dots 605, Quantum dots 655, and polymer dots. Representative time traces and correlation curves for fluorescent probes are shown in Supplementary Figure S2. Because of their spectral separation, we utilized nanoparticles labeled with CF488 (excitation = 920 nm, emission = 515 nm) for FCS and rhodamine B (excitation = 820 nm, emission = 580 nm) for in vivo imaging studies.
To validate our ability to record flow rates, we positioned the FCS excitation beam in the center of a 20 μm vessel and recorded photon arrival events from a single location (single pixel measurement). Spikes in the reconstructed time versus intensity trace show clear bursts in the fluorescence signal corresponding to FCS tracker nanoparticles flowing through the focal volume. The flow velocity was then calculated from the extracted residence time and the calibrated focal diameter (see Supplementary Figure S3). These initial experiments validated our capability to perform simultaneous multiphoton FCS and multiphoton imaging in the brain of a live mouse and to extract velocity measurements at single pixels within any vascular region accessible through multiphoton imaging.
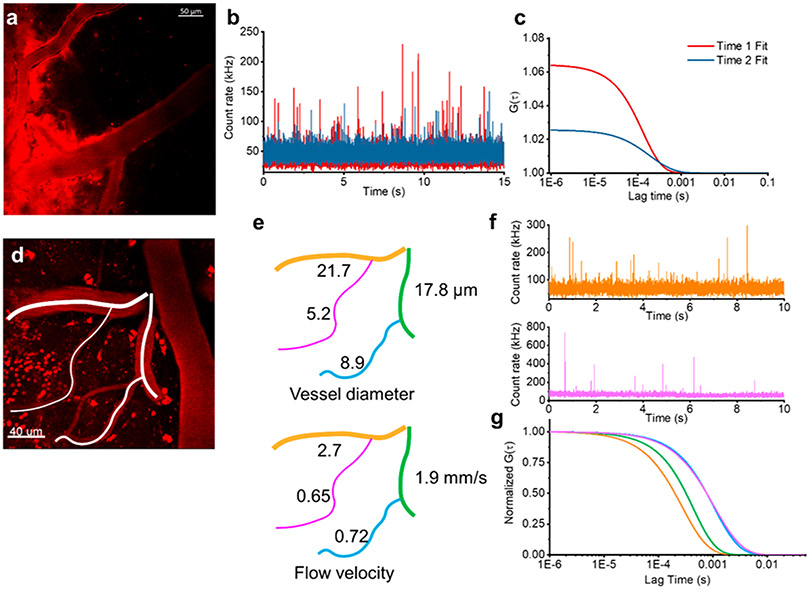
We observed that imaging and spectroscopy sessions longer than 1 h appeared to lead to leeching of the fluorescence out of the vessel into the surrounding brain parenchyma (Figure 2a). The molecular weight of the nanoparticle (250 kDa) is too large to effectively cross the blood–brain barrier, suggesting that the fluorescent label may be dissociating. We monitored nanoparticles using in vivo FCS at two time points—once shortly after injecting the FCS tracker nanoparticle and in the same location 1 h later. We observed decreased peak heights in the fluorescence bursts in the intensity time trace associated with the flow of nanoparticles through the focal volume within the vessel, indicating the dissociation of fluorophores (Figure 2b). The dissociation of dyes from the nanoparticles leads to an increased uncorrelated background signal that depresses the autocorrelation amplitude (Figure 2c). This suggests that the environment within the mouse circulatory system leads to the dissociation of fluorophores from the nanoparticle. These results also demonstrate that this approach provides the capability to monitor in vivo nanoparticle degradation. It further demonstrates that in vivo FCS can be used to monitor the concentration of nanoparticles in the bloodstream which could be used as a tool to dynamically measure nanoparticle half-life, particularly for nanoparticles with inherent fluorescence or with fluorophores that do not readily dissociate.
Figure 2.
Nanoparticle concentration and flow rates in the brain. (a) Representative image of fluorescent nanoparticle leakage out of the vasculature after 1 h. (b) Merged fluorescence intensity time traces recorded in the same vessel showing an initial time trace directly after injection (red) and 1 h later (blue). (c) The corresponding ACFs (G(τ)) show the different concentrations of fluorescent nanoparticles at two time points (color matched to part b). (d) 2P image of fluorescently labeled cerebral vasculature from a thinned-skull preparation. (e) Diameter and blood flow velocity measurements of the vascular network traced from part d. We observed the expected scaling of the flow rate with the diameter of the vessel. (f) Two representative fluorescence intensity time traces recorded from a large vessel (21.7 mm diameter, orange) and a capillary (5.2 mm diameter, pink) from part d. (g) The corresponding ACFs (G(τ)) show the different flow velocities in different vessels (color matched to part e).
To evaluate the robustness of our spectroscopic approach, we determined the flow velocity in a series of vessels with diameters ranging from 5 to 20 μm (Figure 2d-g). Within a large field of view from a single frame of an x–y plane, we identified four branched vessels with diameters of 5.2, 8.9, 17.8, and 21.7 μm (Figure 2e). We then used FCS to measure flow rates in the center of each of these vessels. Vessel diameters and the corresponding flow velocities are indicated in the schematic in Figure 2e. Fluorescence time traces taken in each vessel show clear spikes (Figure 2f). The calculated flow velocities were extracted from the normalized fit of autocorrelations for each fluorescence time trace (Figure 2g). The raw autocorrelations and their associated fits are shown in Supplementary Figure S4. In line with the expected increased hydrodynamic resistance in smaller vessels, the capillaries, with diameters of 5.2 and 8.9 μm, displayed much slower flow rates (<1 mm/s) than the larger vessels. The scaling of flow rate with the diameter of the vessel further validates the sensitivity of our technique.
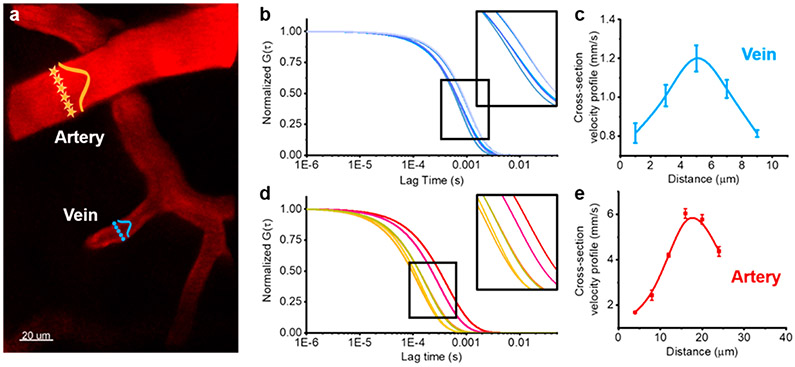
In addition to measuring flow rates in the center of vessels, we also measured the hydrodynamic profile of the flow rate across vessels to compare the flow in the center to that along the wall (Figure 3a). We first performed multiphoton imaging to identify a vein and an artery and then used FCS to measure at opposite walls and at increments across the vessel and build a flow velocity cross-section. The clearly defined shift in the autocorrelation across each vessel verifies that in vivo FCS provides the capability to measure subtle changes in flow rates and can map flow rates with subvessel resolution (see Figure 3b and d and Supplementary Figures S5 and S6). The lateral extension of the multiphoton excitation volume of ~0.98 μm enables five independent pixel measurements across even the smallest vessel observed here (~5 μm). As predicted by laminar flow, the cross-sectional velocity analysis revealed that blood flow through the center of the vessel is larger than at locations near the vessel wall (Figure 3c and e). To better visualize the motion of the blood flow with subvessel resolution, we also used FCS to measure flow rates within the xy plane across segments of vessels. This allowed us to build a two-dimensional (2D) map of flow rates within a plane across the width of the vessel which is indicated by the heat map overlaid on the segments of each vessel (Figure S7). The heat map clearly shows the higher velocity in the center of the vessel along the entire segment. It further shows that the high spatial resolution of this approach allows us to perform subvessel resolution measurements, providing a map of the velocity within a vessel.
Figure 3.
2P-FCS measurements of subvessel resolution blood flow velocities. (a) 2P-FCS enables measurements of subvessel resolution blood flow velocity. A cross-section profile of the flow velocity of an artery or vein is generated by sequentially measuring across the vessel with the FCS detection pixels indicated with orange stars (artery) or blue circles (vein). (b) Corresponding ACFs (G(τ)) at five points across the vein. Similarly, part d shows corresponding ACFs (G(τ)) at six points across the artery. Parts c and e show blood velocity profiles across the width of blood vessels. Velocities were determined at five points across the width of a vein (c, blue) and six points across an artery (e, red). Error bars are standard errors of mean (SEM) calculated from six measurements at the same position.
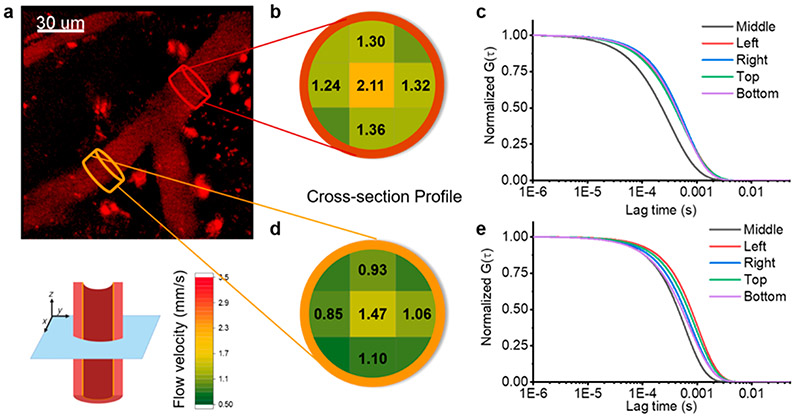
To further characterize flow rates in complex vessel geometries, 2D cross-sectional flow profiles were mapped by performing FCS at multiple points within a plane perpendicular to the flow direction before and after a vessel branch (Figure 4a). We positioned the FCS beam and monitored the flow rate of FCS tracker nanoparticles through the focal volume near walls at the top, bottom, and both sides within a cross-sectional plane. We also collected data from the center of the vessel. The velocity profiles were extracted from FCS autocorrelations from each location (Figure 4c and e and Supplementary Figure S8) and represented on the color-coded map of the cross-section (Figure 4b and d). There was a consistent decrease in the flow rate at the edges of the vessel. The two locations measured here were in the same vessel before and after a branch. The branch had a significant effect on the flow rate observed over the entire cross-section where we saw roughly a 30% change in the flow rate contralateral to the branch. This illustrates the capability of in vivo FCS to detect subtle, anatomical changes in flow rate dynamics.
Figure 4.
2D cross-sections of flow velocity profiles. (a) Representative 2P image of a blood vessel with a branch. (b and d) Results of two-dimensional cross-section blood flow velocity profiles. Brown and orange plots corresponding to 2D blood flow velocity profiles before and after the branch. The heat map corresponds to the flow velocity (see key: green to red, 0.5 to 3.5 mm/s). (c and e) Corresponding ACFs (G(τ)) show the different flow velocities in the cross-section of the vessel.
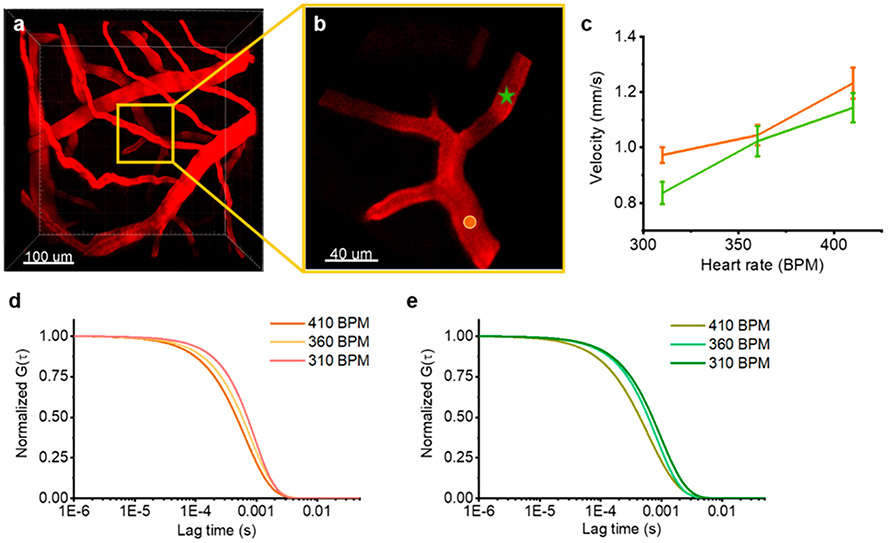
We next utilized in vivo FCS to monitor physiological dependent dynamic changes in blood flow rates. We identified a region approximately 300 μm deep in the brain with branched vessels. We then monitored the baseline flow rate using FCS at two locations (Figure 5a and b). The heart rate was then increased by modifying the level of anesthesia while simultaneously recording FCS measurements and monitoring the heart rate. Concurrent with the increased heart rate, we observed a corresponding increase in the blood flow rate at both locations (Figure 5c). The autocorrelation curves for the two positions (Figure 5d and e and Supplementary Figure S9) also show clear shifts revealing the capability of high sensitivity measurements for monitoring dynamic changes in flow rates.
Figure 5.
Dynamic changes of blood flow velocity. (a) Representative 3D reconstruction of the vascular network. (b) The zoomed-in version of the yellow box from the full field of view 3D image. The boxed area is the vessel that can be seen 30 μm below the bright vessel in the 3D image. (c) Representative blood flow dynamics due to changes in heart rate at two locations indicated in part b. Parts d and e show representative ACFs for different heart rates. The orange and green figures correspond to the two locations indicated in part b.
The presented results demonstrate that tracking nanoparticles in the vasculature provides the capability to monitor flow profiles at subvessel resolution and dynamic changes in CBF within live animals. This approach relies on the combination of multiphoton in vivo imaging with FCS measurements. Two-photon excitation leads to an increased penetration depth in live tissue and significantly reduces scattered light, which enables the detection of nanoparticles in vessels hundreds of microns into the brain.
In conclusion, we introduce an approach that adapts multiphoton in vivo FCS of nanoparticles for blood flow measurements with subvessel resolution. This technique affords real-time measurements with high spatial and temporal resolution for mapping 2D and 3D flow velocities and to study flow dynamics over time. The ability to measure flow velocity at each individual pixel provides improved sensitivity (nM concentrations) as well as higher spatial and temporal resolution over existing techniques. In vivo FCS uniquely enables the measurement of blood flow dynamics in microvessels, allowing potential investigations of blood–brain barrier disruption, neurovascular coupling, and flow dynamics in models of neurodegenerative diseases. This technique would be amenable to a wide range of nanoparticles that require low energy and low intensity excitation such as upconversion lanthanide nanoparticles.40 Additionally, this approach can be used to monitor the properties of nanoparticles in the circulatory system including particle half-life and degradation. The development of in vivo multiphoton FCS enables the measurement of capillary blood flow rate changes of ~0.05 mm/s with a spatial resolution of 1 μm, thus providing a new capability to perform real-time measurements of cerebral blood flow rates.
Supplementary Material
ACKNOWLEDGMENTS
We would like to acknowledge the UKY Light Microscopy Core for the use of their facilities.
ABBREVIATIONS
- FCS
fluorescence correlation spectroscopy
- CBF
cerebral blood flow
- MPLSM
multiphoton laser-scanning microscopy
- RBC
red blood cell
Footnotes
Supporting Information
The Supporting Information is available free of charge at https://pubs.acs.org/doi/10.1021/acs.nanolett.0c02280.
Supplementary methods and figures (PDF)
The authors declare no competing financial interest.
Contributor Information
Xu Fu, Department of Chemistry, University of Kentucky, Lexington, Kentucky 40506, United States.
Pradoldej Sompol, Sanders-Brown Center on Aging, University of Kentucky, Lexington, Kentucky 40536, United States.
Jason A. Brandon, Department of Physiology, University of Kentucky, Lexington, Kentucky 40536, United States
Christopher M. Norris, Sanders-Brown Center on Aging, University of Kentucky, Lexington, Kentucky 40536, United States
Thomas Wilkop, Light Microscopy Core, University of Kentucky, Lexington, Kentucky 40536, United States.
Lance A. Johnson, Sanders-Brown Center on Aging and Department of Physiology, University of Kentucky, Lexington, Kentucky 40536, United States
Christopher I. Richards, Department of Chemistry, University of Kentucky, Lexington, Kentucky 40506, United States.
REFERENCES
- (1).Jacob M; Chappell D; Becker BF Regulation of blood flow and volume exchange across the microcirculation. Critical Care 2016, 20 (1), 319. [DOI] [PMC free article] [PubMed] [Google Scholar]
- (2).Kisler K; Nelson AR; Montagne A; Zlokovic BV Cerebral blood flow regulation and neurovascular dysfunction in Alzheimer disease. Nat. Rev. Neurosci 2017, 18 (7), 419–434. [DOI] [PMC free article] [PubMed] [Google Scholar]
- (3).Iturria-Medina Y; Sotero RC; Toussaint PJ; Mateos-Perez JM; Evans AC Early role of vascular dysregulation on late-onset Alzheimer’s disease based on multifactorial data-driven analysis. Nat. Commun 2016, 7, 11934. [DOI] [PMC free article] [PubMed] [Google Scholar]
- (4).Kisler K; Lazic D; Sweeney MD; Plunkett S; El Khatib M; Vinogradov SA; Boas DA; Sakadži S; Zlokovic BV In vivo imaging and analysis of cerebrovascular hemodynamic responses and tissue oxygenation in the mouse brain. Nat. Protoc 2018, 13 (6), 1377–1402. [DOI] [PMC free article] [PubMed] [Google Scholar]
- (5).Rungta RL; Osmanski B-F; Boido D; Tanter M; Charpak S Light controls cerebral blood flow in naive animals. Nat. Commun 2017, 8 (1), 14191. [DOI] [PMC free article] [PubMed] [Google Scholar]
- (6).Kornfield TE; Newman EA Measurement of Retinal Blood Flow Using Fluorescently Labeled Red Blood Cells. Eneuro 2015, 2 (2), ENEURO.0005–15.2015. [DOI] [PMC free article] [PubMed] [Google Scholar]
- (7).Rougon G; Brasselet S; Debarbieux F Advances in Intravital Non-Linear Optical Imaging of the Central Nervous System in Rodents. Brain Plasticity 2016, 2, 31–48. [DOI] [PMC free article] [PubMed] [Google Scholar]
- (8).Hoover EE; Squier JA Advances in multiphoton microscopy technology. Nat. Photonics 2013, 7 (2), 93–101. [DOI] [PMC free article] [PubMed] [Google Scholar]
- (9).Chaigneau E; Roche M; Charpak S Unbiased Analysis Method for Measurement of Red Blood Cell Size and Velocity With Laser Scanning Microscopy. Front. Neurosci 2019, 13, 644. [DOI] [PMC free article] [PubMed] [Google Scholar]
- (10).Brister PC; Kuricheti KK; Buschmann V; Weston KD Fluorescence correlation spectroscopy for flow rate imaging and monitoring—optimization, limitations and artifacts. Lab Chip 2005, 5 (7), 785–791. [DOI] [PubMed] [Google Scholar]
- (11).Chang Y-C; Ye JY; Thomas T; Chen Y; Baker JR; Norris TB Two-photon fluorescence correlation spectroscopy through a dual-clad optical fiber. Opt. Express 2008, 16 (17), 12640–12649. [DOI] [PubMed] [Google Scholar]
- (12).Arbour TJ; Enderlein J Application of dual-focus fluorescence correlation spectroscopy to microfluidic flow-velocity measurement. Lab Chip 2010, 10 (10), 1286–1292. [DOI] [PubMed] [Google Scholar]
- (13).Sezgin E; Schneider F; Galiani S; Urbančič I; Waithe D; Lagerholm BC; Eggeling C Measuring nanoscale diffusion dynamics in cellular membranes with super-resolution STED–FCS. Nat. Protoc 2019, 14 (4), 1054–1083. [DOI] [PubMed] [Google Scholar]
- (14).Betaneli V; Mucksch J; Schwille P Fluorescence Correlation Spectroscopy to Examine Protein-Lipid Interactions in Membranes. Methods Mol. Biol. (N. Y. NYy U. S.) 2019, 2003, 415–447. [DOI] [PubMed] [Google Scholar]
- (15).Lamb DC; Muller BK; Brauchle C Enhancing the sensitivity of fluorescence correlation spectroscopy by using time-correlated single photon counting. Curr. Pharm. Biotechnol 2005, 6 (5), 405–14. [DOI] [PubMed] [Google Scholar]
- (16).Otosu T; Ishii K; Tahara T Microsecond protein dynamics observed at the single-molecule level. Nat. Commun 2015, 6 (1), 7685. [DOI] [PMC free article] [PubMed] [Google Scholar]
- (17).Mücksch J; Blumhardt P; Strauss MT; Petrov EP; Jungmann R; Schwille P Quantifying Reversible Surface Binding via Surface-Integrated Fluorescence Correlation Spectroscopy. Nano Lett. 2018, 18 (5), 3185–3192. [DOI] [PMC free article] [PubMed] [Google Scholar]
- (18).Schneider F; Waithe D; Galiani S; Bernardino de la Serna J; Sezgin E; Eggeling C Nanoscale Spatiotemporal Diffusion Modes Measured by Simultaneous Confocal and Stimulated Emission Depletion Nanoscopy Imaging. Nano Lett. 2018, 18 (7), 4233–4240. [DOI] [PMC free article] [PubMed] [Google Scholar]
- (19).Vicidomini G; Ta H; Honigmann A; Mueller V; Clausen MP; Waithe D; Galiani S; Sezgin E; Diaspro A; Hell SW; Eggeling C STED-FLCS: An Advanced Tool to Reveal Spatiotemporal Heterogeneity of Molecular Membrane Dynamics. Nano Lett. 2015, 15 (9), 5912–5918. [DOI] [PMC free article] [PubMed] [Google Scholar]
- (20).Elson EL Fluorescence Correlation Spectroscopy: Past, Present, Future. Biophys. J 2011, 101 (12), 2855–2870. [DOI] [PMC free article] [PubMed] [Google Scholar]
- (21).Hess ST; Webb WW Focal Volume Optics and Experimental Artifacts in Confocal Fluorescence Correlation Spectroscopy. Biophys. J 2002, 83 (4), 2300–2317. [DOI] [PMC free article] [PubMed] [Google Scholar]
- (22).Kaur G; Costa MW; Nefzger CM; Silva J; Fierro-González JC; Polo JM; Bell TDM; Plachta N Probing transcription factor diffusion dynamics in the living mammalian embryo with photoactivatable fluorescence correlation spectroscopy. Nat. Commun 2013, 4 (1), 1637. [DOI] [PubMed] [Google Scholar]
- (23).Wachsmuth M; Conrad C; Bulkescher J; Koch B; Mahen R; Isokane M; Pepperkok R; Ellenberg J High-throughput fluorescence correlation spectroscopy enables analysis of proteome dynamics in living cells. Nat. Biotechnol 2015, 33 (4), 384–389. [DOI] [PubMed] [Google Scholar]
- (24).Bacia K; Kim SA; Schwille P Fluorescence cross-correlation spectroscopy in living cells. Nat. Methods 2006, 3 (2), 83–89. [DOI] [PubMed] [Google Scholar]
- (25).Guan Y; Meurer M; Raghavan S; Rebane A; Lindquist JR; Santos S; Kats I; Davidson MW; Mazitschek R; Hughes TE; Drobizhev M; Knop M; Shah JV Live-cell multiphoton fluorescence correlation spectroscopy with an improved large Stokes shift fluorescent protein. Mol. Biol. Cell 2015, 26 (11), 2054–2066. [DOI] [PMC free article] [PubMed] [Google Scholar]
- (26).Negwer I; Best A; Schinnerer M; Schäfer O; Capeloa L; Wagner M; Schmidt M; Mailänder V; Helm M; Barz M; Butt H-J; Koynov K Monitoring drug nanocarriers in human blood by near-infrared fluorescence correlation spectroscopy. Nat. Commun 2018, 9 (1), 5306. [DOI] [PMC free article] [PubMed] [Google Scholar]
- (27).Fritz JV; Didier P; Clamme J-P; Schaub E; Muriaux D; Cabanne C; Morellet N; Bouaziz S; Darlix J-L; Mély Y; de Rocquigny H Direct Vpr-Vpr Interaction in Cells monitored by two Photon Fluorescence Correlation Spectroscopy and Fluorescence Lifetime Imaging. Retrovirology 2008, 5 (1), 87. [DOI] [PMC free article] [PubMed] [Google Scholar]
- (28).Kuyper CL; Fujimoto BS; Zhao Y; Schiro PG; Chiu DT Accurate sizing of nanoparticles using confocal correlation spectroscopy. J. Phys. Chem. B 2006, 110 (48), 24433–24441. [DOI] [PMC free article] [PubMed] [Google Scholar]
- (29).Balaji PS; Murthy AVR; Tiwari N; Kulkarni S Fluorescence Correlation Spectroscopy of Gold Nanoparticles. Spectrosc. Lett 2012, 45, 22–28. [Google Scholar]
- (30).Silvestri A; Di Silvio D; Llarena I; Murray RA; Marelli M; Lay L; Polito L; Moya SE Influence of surface coating on the intracellular behaviour of gold nanoparticles: a fluorescence correlation spectroscopy study. Nanoscale 2017, 9 (38), 14730–14739. [DOI] [PubMed] [Google Scholar]
- (31).Jiang X; Weise S; Hafner M; Röcker C; Zhang F; Parak WJ; Nienhaus GU Quantitative analysis of the protein corona on FePt nanoparticles formed by transferrin binding. J. R. Soc., Interface 2010, 7, S5–S13. [DOI] [PMC free article] [PubMed] [Google Scholar]
- (32).Jungjohann KL; Wheeler DR; Polsky R; Brozik SM; Brozik JA; Rudolph AR Liquid-cell scanning transmission electron microscopy and fluorescence correlation spectroscopy of DNA-directed gold nanoparticle assemblies. Micron 2019, 119, 54–63. [DOI] [PubMed] [Google Scholar]
- (33).Schaeffel D; Staff RH; Butt H-J; Landfester K; Crespy D; Koynov K Fluorescence Correlation Spectroscopy Directly Monitors Coalescence During Nanoparticle Preparation. Nano Lett. 2012, 12 (11), 6012–6017. [DOI] [PubMed] [Google Scholar]
- (34).Carasso LS; Benhar I; Dvir T Universal Biofactor-Releasing Scaffold Enabling in Vivo Reloading. Nano Lett. 2019, 19 (3), 1838–1843. [DOI] [PMC free article] [PubMed] [Google Scholar]
- (35).Harvey JD; Williams RM; Tully KM; Baker HA; Shamay Y; Heller DA An in Vivo Nanosensor Measures Compartmental Doxorubicin Exposure. Nano Lett. 2019, 19 (7), 4343–4354. [DOI] [PubMed] [Google Scholar]
- (36).Smith BR; Gambhir SS Nanomaterials for In Vivo Imaging. Chem. Rev 2017, 117 (3), 901–986. [DOI] [PubMed] [Google Scholar]
- (37).Shih AY; Driscoll JD; Drew PJ; Nishimura N; Schaffer CB; Kleinfeld D Two-photon microscopy as a tool to study blood flow and neurovascular coupling in the rodent brain. J. Cereb. Blood Flow Metab 2012, 32 (7), 1277–1309. [DOI] [PMC free article] [PubMed] [Google Scholar]
- (38).Liu H; Deng X; Tong S; He C; Cheng H; Zhuang Z; Gan M; Li J; Xie W; Qiu P; Wang K In Vivo Deep-Brain Structural and Hemodynamic Multiphoton Microscopy Enabled by Quantum Dots. Nano Lett. 2019, 19 (8), 5260–5265. [DOI] [PubMed] [Google Scholar]
- (39).Kim J; Cao L; Shvartsman D; Silva EA; Mooney DJ Targeted Delivery of Nanoparticles to Ischemic Muscle for Imaging and Therapeutic Angiogenesis. Nano Lett. 2011, 11 (2), 694–700. [DOI] [PMC free article] [PubMed] [Google Scholar]
- (40).Lahtinen S; Krause S; Arppe R; Soukka T; Vosch T Upconversion Cross-Correlation Spectroscopy of a Sandwich Immunoassay. Chem. - Eur. J 2018, 24 (37), 9229–9233. [DOI] [PMC free article] [PubMed] [Google Scholar]
Associated Data
This section collects any data citations, data availability statements, or supplementary materials included in this article.


