

Abstract
Tomato is the world’s second largest cultivated vegetable crop. Tomato spotted wilt virus (TSWV) and fusarium wilt (FW) are the two major biotic stresses in India limiting tomato production. Identification and utilization of resistant lines to realize the full genetic potential of varieties for yield gain is an eco-friendly approach. The present research work involved genetic diversity study of 48 genotypes, augmented from different exotic, and indigenous sources belonging to three species using SSR markers. A total of 195 alleles were generated by employing 84 polymorphic markers. The PIC value was ranged from 0.12 to 0.93. Two sub-populations (K = 2) were revealed by model based structure analysis. The cluster analysis using the UPGMA method classified the genotypes into 6 clusters. Pusa Ruby, EC-310310 and EC-620452 were found to be highly diverse. Molecular characterization of 48 genotypes with SSR markers divulged seven genotypes with Sw-5 gene and nine genotypes with I-2 gene showing resistance to TSWV and FW, respectively and further, on artificial screening, they were found to be phenotypically resistant. Out of 195 alleles generated from 84 polymorphic SSR markers, 43 alleles from 26 SSR markers were identified with positive average allele effect distributed across nine chromosomes and positive average allele effect was identified for the average weight of the fruit, the number of fruits formed per plant, and fusarium wilt PDI score. Fruit weight and fruit yield per plant registered a significant and positive correlations. The identified genotypes with varied backgrounds and performances will be very useful as diversified sources in resistant breeding programs of tomato.
Supplementary Information
The online version contains supplementary material available at 10.1007/s12298-021-01037-8.
Keywords: Fusarium wilt, Genetic diversity, I-2, Sw-5, SSR markers, Tomato spotted wilt virus, Population structure, Correlation
Introduction
Solanum lycopersicum L. (Tomato), with diploid chromosome number of 24, is originated in South America. It occupies the second position in terms of the cultivated area of vegetable crops. It has a wide range of growth habitats in different climate conditions. It is considered as the richest source of dietary fiber, vitamins A, C, minerals, lycopene (Frusciante et al. 2007) and having anticancer properties (Bhuvaneswari and Nagini 2005).
The production of tomato is constrained by abiotic stresses like heat, drought, salinity (Parankusam et al. 2017) and biotic stresses like viral, bacterial, and fungal diseases. The major viral pathogens like Tomato Spotted Wilt Virus, Yellow Leaf Curl Virus, Tomato Mosaic Virus, Tobacco Mosaic Virus and Cucumber Mosaic Virus; bacterial pathogens and fungal pathogens affect tomato production and productivity. Out of these, TSW is a major viral disease caused by Tomato Spotted Wilt Virus belonging to tospovirus with a wide host range. Thrips play a vital role in disease transmission and symptoms include ring spots on fruits and reduced fruit yield (Saidi and Warade 2008). Insecticidal sprays result in almost no effect on the spread of this virus (Agrios 2005). A number of resistant genes were reported against TSWV disease i.e., Sw-1, Sw-2, Sw-3, Sw-4, Sw-5, Sw-6 and Sw-7 (Price et al. 2007; Saidi and Warade 2008). When compared among the reported genes, Sw-5 and Sw-6 as well demonstrated partial resistance to thrips incidence with a definite range of resistance to various isolates of the virus (Rosello et al. 2001), whereas three recessive genes, Sw-2, Sw-3, and Sw-4 and two dominant genes Sw-1a and Sw-1b were observed to be able to quickly overcome resistance, therefore were not under use in commercial tomato production (Price et al. 2007; Saidi and Warade 2008).
Among the fungal diseases, fusarium wilt is one of the major diseases in tomato, causing significant yield loss. Fusarium wilt is caused by Fusarium oxysporum f.sp. lycopersici (Sacc.) (FOL). Fusarium wilt is a vascular disease. As a soil borne disease, the pathogen can enter through damaged roots and thereby infect the crop during all its growth stages. FW induced wilting of leaves, stunting of plants, browning of the vascular system and cessation of fruit bearing also occur. FOL causes disease exclusively on species belonging to Lycopersicon genus (Currently under Solanum) and thereby causing yield loss to a great extent, resulting in limitation of tomato production worldwide. The deployment of resistant cultivars will be very effective in the control of this disease (Wong 2003) and the I-2 gene, which is dominant in nature, brings in resistance against FOL race 2 in tomato. The gene is introgressed from S. pimpinellifolium (Stall and Walter 1965) and Laterrot 1976 reported that the gene is genetically identified on chromosome 11.
Solanum lycopersicum is highly diversified, consisting of 16 wild species harboring genes with potential application in breeding for incorporation of genes/ QTLs resistant to biotic and abiotic stresses into popular cultivars. Investigation of genetic variation in tomato genotypes using morphological, biochemical and molecular markers enables the selection of useful parental lines. Among these, morphological markers are often used in genetic diversity analyses which are often misrepresented by abiotic conditions (Cooke et al 2003). Various biochemical markers are also used to analyze the genetic diversity, which have provided tremendous information compared to morphological markers. Molecular markers are very informative in unraveling diversity and are useful in Marker-Assisted Breeding (MAB), which involves trait specific selection using foreground and background selection methods. These also can speed up the genome recovery in molecular breeding techniques (Narshimulu et al. 2011). At present, the genetic diversity in tomato is performed with DNA based markers like Amplified Fragment Length Polymorphic markers (AFLP) (Park et al. 2004), Restriction Fragment Length Polymorphic markers (RFLP) (Miller et al. 1990), Randomly Amplified Polymorphic DNA (RAPDs) (Tabassum et al. 2013), Inter Simple Sequence Repeats (ISSRs) (Henareh et al. 2016), Single Nucleotide Polymorphic markers (SNPs) (Wang et al. 2016) and Simple Sequence Repeats (SSRs)/ Microsatellites (Zhou et al. 2015; Aguirre et al. 2017). SSRs are the most widely used among the molecular markers due to high reproducibility and their co-dominant nature. Utility of SSRs in genetic diversity studies in tomato was taken up by different researchers (Alvarez et al. 2001; Bredemeijer et al. 2002; He et al. 2003; Frary et al. 2005; Yang et al. 2005; Garcia-Martinez et al. 2005; Mazzucat et al. 2008; Benor et al. 2008; Kwon et al. 2006, 2009: Pritesh et al. 2010; Zhou et al. 2015; Kaushal et al. 2017 and Jaafar et al. 2018).
In the present investigation, 48 genotypes were evaluated for their genetic diversity using 130 SSRs along with two gene specific primers to confirm the resistance of genotypes against TSWV and FW diseases, in addition to phenotypic screening of genotypes for resistance to both the diseases.
Materials and methods
Tomato germplasm augmented
A total of 48 tomato genotypes (Table 1), which include 32 genotypes collected from ICAR-NBPGR, India, 14 genotypes imported from Tomato Genetics Resource Center, University of California, Davis, CA, USA and two were superior released varieties. This experimental material was maintained at the farm of SKLTSHU during Kharif, 2018 under Genetics and Plant Breeding department to take up genetic diversity analysis.
Table 1.
Tomato genotypes and their sources used for diversity analysis
| S. No. | Accession Number | Collection Source | Taxon | S. No. | Accession Number | Collection Source | Taxon |
|---|---|---|---|---|---|---|---|
| 1 | EC-251717 | NBPGR, New Delhi, India | Solanum lycopersicum | 25 | EC-615047 | NBPGR, New Delhi, India | Solanum lycopersicum |
| 2 | EC-273966 | NBPGR, New Delhi, India | Solanum lycopersicum | 26 | EC-514013 | NBPGR, New Delhi, India | Solanum lycopersicum |
| 3 | EC-310310 | NBPGR, New Delhi, India | Solanum lycopersicum | 27 | EC-620428 | NBPGR, New Delhi, India | Solanum lycopersicum |
| 4 | EC-620503 | NBPGR, New Delhi, India | Solanum lycopersicum | 28 | EC-620452 | NBPGR, New Delhi, India | Solanum lycopersicum |
| 5 | EC-625644 | NBPGR, New Delhi, India | Solanum lycopersicum | 29 | EC-620446 | NBPGR, New Delhi, India | Solanum lycopersicum |
| 6 | EC-615055 | NBPGR, New Delhi, India | Solanum lycopersicum | 30 | EC-636482 | NBPGR, New Delhi, India | Solanum lycopersicum |
| 7 | EC-617059 | NBPGR, New Delhi, India | Solanum lycopersicum | 31 | EC-251751 | NBPGR, New Delhi, India | Solanum lycopersicum |
| 8 | EC-617066 | NBPGR, New Delhi, India | Solanum lycopersicum | 32 | EC-320565 | NBPGR, New Delhi, India | Solanum lycopersicum |
| 9 | EC-617068 | NBPGR, New Delhi, India | Solanum lycopersicum | 33 | EC-145057 | NBPGR, New Delhi, India | Solanum lycopersicum |
| 10 | EC-620434 | NBPGR, New Delhi, India | Solanum lycopersicum | 34 | EC-251518 | NBPGR, New Delhi, India | Solanum lycopersicum |
| 11 | EC-620463 | NBPGR, New Delhi, India | Solanum lycopersicum | 35 | LA-1940 | TGRC, Davis, USA | Solanum pennelli |
| 12 | EC-620522 | NBPGR, New Delhi, India | Solanum lycopersicum | 36 | LA-3120 | TGRC, Davis | Solanum lycopersicum |
| 13 | EC-164295 | NBPGR, New Delhi, India | Solanum lycopersicum | 37 | LA-3006 | TGRC, Davis | Solanum lycopersicum |
| 14 | EC-631356 | NBPGR, New Delhi, India | Solanum lycopersicum | 38 | LA-2662 | TGRC, Davis | Solanum lycopersicum |
| 15 | EC-251694 | NBPGR, New Delhi, India | Solanum lycopersicum | 39 | LA-0490 | TGRC, Davis | Solanum lycopersicum |
| 16 | EC-631962 | NBPGR, New Delhi, India | Solanum lycopersicum | 40 | LA-4345 | TGRC, Davis | Solanum lycopersicum |
| 17 | EC-638302 | NBPGR, New Delhi, India | Solanum lycopersicum | 41 | LA-3005 | TGRC, Davis | Solanum lycopersicum |
| 18 | EC-676742 | NBPGR, New Delhi, India | Solanum lycopersicum | 42 | LA-0535 | TGRC, Davis | Solanum lycopersicum |
| 19 | Arka Vikas | IIHR, Bangalore, India | Solanum lycopersicum | 43 | LA-3847 | TGRC, Davis | Solanum lycopersicum |
| 20 | LA-1589 | TGRC, Davis, USA | Solanum pimpinellifolium | 44 | AVTO-9802 | WVC, Taiwan | Solanum lycopersicum |
| 21 | EC-567305 | NBPGR, New Delhi, India | Solanum lycopersicum | 45 | LA-1500 | TGRC, Davis | Solanum pimpinellifolium |
| 22 | LA-3667 | TGRC, Davis | Solanum lycopersicum | 46 | LA-1015 | TGRC, Davis | Solanum cheesmani |
| 23 | Pusa Ruby | IARI, New Delhi, India | Solanum lycopersicum | 47 | LA-1664 | TGRC, Davis | Solanum lycopersicum |
| 24 | AVTO-1219 | WVC, Taiwan | Solanum lycopersicum | 48 | EC-620570 | NBPGR, New Delhi, India | Solanum lycopersicum |
DNA isolation and SSR analysis
Fresh leaf samples were collected from all 48 genotypes from 21 days old seedlings and isolation of genomic DNA was executed through modified CTAB method (Murray and Thompson 1980). Quantification and quality of the isolated DNA was performed with Biophotometer (Eppendorf) and 0.8% Agarose Gel Electrophoresis. Finally, DNA was diluted using nuclease free water to a concentration of 50 ng/μl to perform PCR analysis using SSRs. A total of 130 SSRs were selected from different tomato genomic resources to analyze genetic diversity among 48 genotypes along with two gene specific markers against TSWV and Fusarium wilt (Table 2). Polymerase chain reaction (PCR) was performed with the SSR markers with a slight modification of the annealing temperature (55 °C). The amplified products were separated in a 3% agarose gel along with the marker in 0.5 Tris – Boric acid–EDTA (TBE) buffer and resolved using Vilber gel documentation unit.
Table 2.
Markers associated with Sw-5 and I-2 genes
Data analysis
The observed polymorphic bands were scored based on the molecular weight of the amplified product. The binary matrix generated using scoring data was analyzed for allelic frequency. All polymorphic markers were assessed for polymorphism information content (PIC) and was calculated according to formula PIC = 1 − Σpi2 (Botstein et al. 1980). The allelic matrix was employed in cluster analysis and dendrogram was constructed based on UPGMA (unweighted pair-group method with arithmetic mean) using NTSYS V 2.0 software (Rohlf 2000).
Model-based clustering program STRUCTURE V2.3.4 (Pritchard et al. 2000) was employed to deduce the population structure of all the 48 accessions. Number of populations (K) was determined with a burn-in period of 5000 and Markov Chine Monte Carlo of 50,000. Three independent runs were performed for each K varying from 1 to 10 and most probable K-value was defined based on ∆K method (Evanno et al. 2005) by running the Structure Harvester software (Earl and von Holdt 2012). Analysis of molecular variance (AMOVA) was performed using GENALEX 6.5 (Peakall and Smouse 2012) to estimate the genetic structure within and among populations estimated based on the ∆K method with 999 permutations.
Evaluation of genotypes for fusarium wilt resistance
Forty eight genotypes were sown in the pro-trays filled with coconut compost and were raised by the following general cultural practices. Artificial screening of genotypes for resistance to Fusarium wilt was conducted using root dip method with 21 days old seedlings. FW affected tomato plant samples were collected from five different disease infected areas, i.e., Cheruvu annaram, and Marrooru village in Nalgonda district; Amdapur village, Surangal village, and Dharmanna gudem village in Rangareddy District of Telangana state, India. Conidia of all the isolates were recovered from one week old cultures. All the isolates were characterized and tested for their pathogenicity and further most pathogenic (Surangal) isolate was utilized for phenotype screening for disease resistance. Seedlings were carefully removed from the pro-trays, and were washed with tap water to remove adhering soil particles. The roots were submerged in the conidial suspension for 30 min, with prior root trimming using a sterile scissor. The inoculated seedlings were transplanted to poly bags (15 cm diameter), after surface sterilized with 0.1% mercuric chloride containing soil and sand 1:1 ratio. The severity of the disease was assessed from 2 weeks after inoculation up to 45 days (Nirmaladevi and Srinivas 2012). The percent incidence for Fusarium oxysporum was calculated using a scale 0 to 4 as given by Silme and Cagirgan (2010), which was based on infection percent, as follows: Where, 0—highly resistant (0%), 1—resistant (0.33 to 25%), 2—moderately resistant (26 to 50%), 3—moderately susceptible (51 to 66.66%), 4—susceptible and highly susceptible (66.67–100%).
Evaluation for TSWV resistance under induced disease conditions
The TSWV isolates (fruit and leaf samples) were collected from Kanakamaidi, Sriramnagar, and Urella villages of Ranga Reddy district, which were confirmed for the presence of virus through ELISA and the most virulent strain (Sriramnagar-1) was utilized for screening all the 48 genotypes. The Sriramnagar-1 (local virulent) strain maintained on cowpea leaves was used to inoculate the genotypes artificially when they were at 2–4 leaf stage (Paterson et al. 1989). The plants were inoculated three times a week and continued till fruiting and scored for disease symptoms. Scoring of genotypes for the disease symptoms was taken up for TOSPO (TSWV) virus and were categorized (Juliatti et al. 1994) into 5 viz. whole plant diseased (scored as 1); plants diseased with few green stem and leaves (scored as 2); the 50% plant diseased and may have one or two fruits (scored as 3); except for the top leaves, stem and other plant parts are healthy (scored as 4), and healthy plants (scored as 5). The plant phenotypic symptoms were recorded at 40, 60 and 80 days after transplanting of seedlings in the field during Kharif, 2018.
Allelic effect of polymorphic SSRs
The average allele effect (AAE) of 84 polymorphic SSRs was estimated according to Benjamini and Hochberg (1995). The AAE calculated with the formulae used in the reference (Benjamini and Hochberg 1995) were presented in table (supplementary table 2) as positive alleles (showing positive AAE values) and negative alleles (showing negative AAE values).
Correlation studies
Correlations were carried out between yield, its attributes, fusarium wilt and TSWV scores with R language software (R Core Team 2012) and its significance was reported, where the positive association was indicated by blue colour and the negative association was by red color. The color intensity indicates the level of association from high to low range.
Results
A total of 130 SSR markers were used to analyze the genetic diversity in 48 tomato genotypes. Out of 130 SSR markers, 84 (64.6%) were observed to be polymorphic, 36 (27.7%) were monomorphic and the remaining 10 (7.7%) markers did not amplify. These 84 polymorphic markers (Supplementary Table 1) only were used in the analysis of genetic diversity, which yielded allelic data. Clear allelic variation was only considered to prepare the binary matrix (Fig. 1). The number of alleles/ locus varied from 2 to 4, with an average of 2.32/ marker with TES-478 and TGS 3032 yielding the highest number (4) of alleles.
Fig. 1.

Genetic diversity of tomato as revealed by TES-478 marker
The polymorphic markers covered all the 12 chromosomes with the maximum number of 13 primers on chromosome 1 followed by 10 primers each on chromosome number 2 and 11, whereas chromosome 8 was with only 2 primers. Polymorphism information content (PIC) value among SSRs varied widely from 0.17 to 0.74 with an average of 0.45, indicating good genetic diversity among the tomato genotypes.
Allelic effect of polymorphic SSRs
AAE for all the markers was presented in supplementary table 2. Among the total of 195 alleles from the 84 polymorphic SSR markers, 43 alleles were identified with positive average allele effect from 26 SSR markers distributed across nine chromosomes (Table 3). Chromosome wise distribution of positive alleles was presented in Fig. 2. Positive average allele effect was identified for three traits viz., average fruit weight, and fruits per plant and Fw PDI score.
Table 3.
Alleles with positive effect from 84 polymorphic SSR markers for various traits in tomato
| S.No. | Marker | Chromosome | Trait | AAE | Allele size |
|---|---|---|---|---|---|
| 1 | TES939 | 1 | Average fruit weight | 8.715 | 244 |
| 2 | TES939 | 1 | Average fruit weight | 2.215 | 250 |
| 3 | TES939 | 1 | Average fruit weight | 1.924 | 255 |
| 4 | TGS1030 | 1 | Average fruit weight | 11.314 | 255 |
| 5 | TES609 | 1 | Number of fruits per plant | 0.521 | 210 |
| 6 | SSR135 | 1 | Average fruit weight | 0.911 | 220 |
| 7 | SSR135 | 1 | Average fruit weight | 4.504 | 235 |
| 8 | TGS2126 | 1 | Average fruit weight | 11.314 | 261 |
| 9 | TES1683 | 1 | Average fruit weight | 2.248 | 245 |
| 10 | TES1683 | 1 | Average fruit weight | 1.397 | 252 |
| 11 | TEI0866 | 1 | Number of fruits per plant | 0.225 | 149 |
| 12 | TES1673 | 2 | Number of fruits per plant | 0.050 | 291 |
| 13 | TES1132 | 2 | Number of fruits per plant | 0.646 | 210 |
| 14 | TES373 | 2 | Average fruit weight | 1.792 | 185 |
| 15 | TES373 | 2 | Average fruit weight | 1.916 | 192 |
| 16 | TGS3418 | 2 | Number of fruits per plant | 0.922 | 262 |
| 17 | TES0498 | 3 | Number of fruits per plant | 2.186 | 176 |
| 18 | SSRB50753 | 3 | Number of fruits per plant | 0.487 | 244 |
| 19 | TGS2288 | 3 | Number of fruits per plant | 0.200 | 275 |
| 20 | SSR3.171.1 | 3 | Number of fruits per plant | 2.930 | 263 |
| 21 | TES0077 | 3 | Average fruit weight | 3.227 | 147 |
| 22 | TES0077 | 3 | Average fruit weight | 1.169 | 155 |
| 23 | SSR.111 | 3 | Average fruit weight | 8.752 | 150 |
| 24 | SSR.111 | 3 | Average fruit weight | 8.868 | 115 |
| 25 | TEI0139 | 4 | Number of fruits per plant | 0.097 | 140 |
| 26 | TGS1360 | 5 | Number of fruits per plant | 0.922 | 225 |
| 27 | TGS266 | 6 | Number of fruits per plant | 0.286 | 195 |
| 28 | TGS1145 | 6 | Average fruit weight | 1.380 | 210 |
| 29 | TGS1145 | 6 | Average fruit weight | 3.227 | 220 |
| 30 | TGS1145 | 6 | Average fruit weight | 10.284 | 225 |
| 31 | TES422 | 6 | Fusarium wilt PDI score | 4.471 | 200 |
| 32 | TES422 | 6 | Fusarium wilt PDI score | 7.813 | 219 |
| 33 | TES422 | 6 | Fusarium wilt PDI score | 2.720 | 225 |
| 34 | TES537 | 8 | Fusarium wilt PDI score | 4.977 | 143 |
| 35 | TES537 | 8 | Fusarium wilt PDI score | 16.145 | 155 |
| 36 | TES537 | 8 | Fusarium wilt PDI score | 2.184 | 160 |
| 37 | TEI0795 | 11 | Fusarium wilt PDI score | 2.533 | 225 |
| 38 | TEI0795 | 11 | Fusarium wilt PDI score | 8.854 | 235 |
| 39 | TEI0795 | 11 | Fusarium wilt PDI score | 4.717 | 240 |
| 40 | TES1970 | 11 | Number of fruits per plant | 1.832 | 215 |
| 41 | TES1970 | 11 | Number of fruits per plant | 2.686 | 220 |
| 42 | TES1502 | 12 | Number of fruits per plant | 0.560 | 220 |
| 43 | TGS3032 | 12 | Fusarium wilt PDI score | 4.336 | 260 |
Fig. 2.
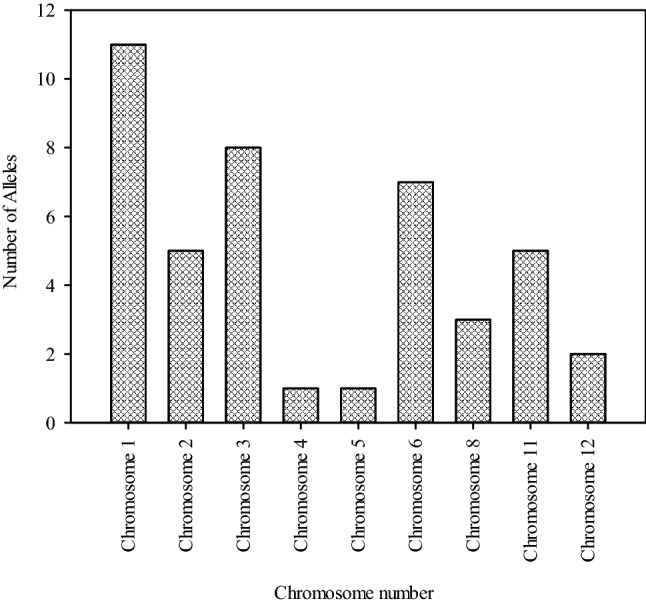
Chromosome wise distribution of AAE for alleles with positive effect in tomato
STRUCTURE and AMOVA analysis
The population structure of 48 tomato accessions was deduced with Structure V2.3.4 from 84 SSR markers. The most likely number of clusters was evaluated using ΔK method. Based on the highest peak of ΔK for the tested accessions (K = 2) (Fig. 3A, 3B), the entire germplasm was grouped into two sub-populations (pop1, pop2) with the alpha mean value of 0.28. The overall proportion of membership of the samples in each of the two clusters at K = 2 was 0.43 and 0.57 for pop1 and pop2, respectively. Among these populations, 0.18 allele frequency divergences were observed using point estimation and the average distance between individuals in the same cluster was 0.12 and 0.34, respectively. Most interestingly mean value of 0.75 for Fst1 and 0.09 for Fst2 were observed for each population.
Fig. 3.

A Population structure inferred by the STRUCTURE software based on SSRs at K = 2 in tomato. B Estimated ∆K of the 48 tomato accessions over 3 runs of each K value. C AMOVA analysis of 48 tomato genotypes
In addition to this, using these subpopulations data from structure analysis, the distribution of molecular variance was estimated using AMOVA. The results revealed that 12% of the variation was observed among the populations, while 88% of the variations were observed within the populations (Fig. 3C and Table 4) along with 0.15 φPT value.
Table 4.
Summary of AMOVA in tomato genotypes
| Source | Degrees of freedom | Sum of squares | Mean sum of squares | Est. variation | % | Stat | Value | P value |
|---|---|---|---|---|---|---|---|---|
| Among populations | 1 | 116.99 | 116.99 | 3.95 | 12 | |||
| Within population | 46 | 1395.09 | 30.33 | 30.33 | 88 | |||
| Total | 47 | 1512.08 | 34.28 | 100 | φPT | 0.15 | 0.001 |
Cluster analysis
The similarity coefficient of tomato genotypes varied from 0.20 to 0.96 reflecting a huge range, which further explains the diverse relationship of genotypes. UPGMA method based cluster analysis of the 48 tomato genotypes using 84 polymorphic markers resulted in (Fig. 4) grouping the genotypes into six clusters based on genetic distances (Table 5). While only two genotypes EC-251717 and EC-625644 were present in Cluster I, Cluster II was considered as a major cluster with 38 genotypes, which further truncated into two sub clusters. Genotypes EC-273966, EC-620503, EC-617059, EC-617066, EC-615055, EC-615047, EC-514013, EC-620428, EC-620446, EC-251751, EC-636482 and EC-320565 were grouped together in sub cluster I and Arka Vikas, LA-1589, EC-567305, AVTO-1219, LA-3667, EC-620434, EC-320463, EC-620522, EC-631356, EC-638302, EC-145057, EC-251518, LA-3120, LA-3006, LA-2662, LA-4345, LA-3005, LA-0490, LA-0535, LA-3847, AVTO-9802, LA-1500, LA-1015, LA-1664, EC-620570 and EC-164295 in sub cluster—II with EC-164295 showing the highest deviation. Two genotypes viz., LA-3847 and AVTO-9802, which showed the highest similarity coefficient of 0.96 were, placed in sub cluster II only. Additionally, all the UC Davis lines were also grouped in to this sub cluster, except LA 1940, which was in separate cluster (cluster III) with EC-251694. With regard to other clusters, cluster IV contained three genotypes viz., EC-617068, EC-631962 and EC-676742, Cluster V consisted of Pusa Ruby alone, indicating it’s unique and distinctiveness from other genotypes under study and Cluster VI consisted of two genotypes viz., EC-310310 and EC-620452.
Fig. 4.

Dendrogram obtained from SSR analysis in tomato using UPGMA with NTSYSpc2.0 software
Table 5.
Clustering pattern of tomato genotypes obtained by genetic diversity analysis
| Cluster number | Number of genotypes | Name of the genotype/s |
|---|---|---|
| I | 2 | EC-251717 and EC-625644 |
| II | 38 |
Sub cluster-I EC-273966, EC-620503, EC-617059, EC-617066, EC-615055, EC-615047, EC-514013, EC-620428, EC-620446, EC-251751, EC-636482 and EC-320565 Sub cluster-II Arka Vikas, LA-1589, EC-567305, AVTO-1219, LA-3667, EC-620434, EC-320463, EC-620522, EC-631356, EC-638302, EC-145057, EC-251518, LA-3120, LA-3006, LA-2662, LA-4345, LA-3005, LA-0490, LA-0535, LA-3847, AVTO-9802, LA-1500, LA-1015, LA-1664, EC-620570 and EC-164295 |
| III | 2 | EC-251694 and LA-1940 |
| IV | 3 | EC-617068, EC-631962 and EC-676742 |
| V | 1 | Pusa Ruby |
| VI | 2 | EC-310310 and EC-620452 |
Validation of gene specific markers (Sw-5, I-2) in 48 genotypes of tomato
All the 48 tomato genotypes were tested with two gene specific markers of Sw-5 (Shi et al. 2011) and I-2 (Arens et al. 2010) genes, which were previously reported for their use in the selection of resistance genotypes against TSWV and Fusarium wilt. Out of 48 genotypes, seven genotypes, EC-251717, EC-273966, EC-625644, EC-251694, LA-1589, LA-1940 and LA-3667 amplified the desired band above 540 bp with Sw-5 gene specific marker, Sw-5-F3 (Fig. 5).
Fig. 5.

Screening of 48 tomato genotypes with Sw-5 gene specific marker, Sw-5-F3
Nine genotypes i.e. EC-617066, EC-620463, EC-631356, LA-3667, AVTO-1219, EC-620428, LA-3847, AVTO-9802 and EC-620570 produced the desired product at 940 bp with Fusarium wilt gene specific marker, FWZ1063 (Fig. 6).
Fig. 6.

Screening of 48 tomato genotypes with I-2 gene specific marker, FWZ1063
Evaluation of genotypes for fusarium wilt resistance
Out of 48 genotypes studied for fusarium wilt resistance based on morphological symptoms using the scale (0–4), nine genotypes viz. EC-617066, EC-620463, EC-631356, LA-3667, AVTO-1219, EC-620428, LA-3847, AVTO-9802 and EC-620570 were scored “0”, no genotypes were scored in the range of 0–1, four genotypes i.e. EC-251717, EC-620434, EC-676742 and LA-0535 with 1–2 score, four genotypes viz. EC-273966, EC-617068, EC-638302 and EC-567305 with 2–3 score and the remaining 31 genotypes i.e. EC-620522, EC-251694, Arka Vikas, LA-1589, EC-620503, EC-625644, EC-617059, EC-514013, EC-620446, EC-320565, LA-1940, LA-0490, LA-1015, LA-3006, EC-310310, EC-615055, EC-164295, EC-631962, Pusa Ruby, EC-615047, EC-620452, EC-636482, EC-251751, EC-145057, EC-251518, LA-3120, LA-2662, LA-4345, LA-3005, LA-1500 and LA-1664 were recorded with the score 3–4. Simultaneously, the percent of incidence was also calculated and it was in the range of zero to hundred. Different levels of percent incidence were observed in genotypes, where zero per cent disease incidence was observed in EC-617066, EC-620463, EC-631356, LA-3667, AVTO-1219, EC-620428, LA-3847, AVTO-9802 and EC-620570, while 100% incidence was observed in EC-620522, EC-251694, Arka Vikas and LA-1589 (Tables 6, 7).
Table 6.
Reaction of genotypes against fusarium wilt disease in tomato
| S. No. | Reaction | Score | Genotypes |
|---|---|---|---|
| 1 | Highly resistant (HR) | 0 | EC-617066, EC-620463, EC-631356, LA-3667, AVTO-1219, EC-620428, LA-3847, AVTO-9802, EC-620570 |
| 2 | Resistant (R) | 1 (0–1) | Nil |
| 3 | Moderately resistant (MR) | 2 (1–2) | EC-251717, EC-620434, EC-676742, LA-0535 |
| 4 | Moderately susceptible (MS) | 3 (2–3) | EC-273966, EC-617068, EC-638302, EC-567305 |
| 5 | Susceptible (S) and highly Susceptible (HS) | 4 (3–4) | EC-620522, EC-251694, Arka Vikas, LA-1589, EC-620503, EC-625644, EC-617059, EC-514013, EC-620446, EC-320565, LA-1940, LA-0490, LA-1015, LA-3006, EC-310310, EC-615055, EC-164295, EC-631962, Pusa Ruby, EC-615047, EC-620452, EC-636482, EC-251751, EC-145057, EC-251518, LA-3120, LA-2662, LA-4345, LA-3005, LA-1500, LA-1664 |
Table 7.
Scores and per cent incidence of fusarium wilt in 48 tomato genotypes
| S. No. | Genotype | Per cent disease incidence of Fusarium wilt | Disease score of TSWV | S. No. | Genotype | Per cent disease incidence of Fusarium wilt | Disease score of TSWV |
|---|---|---|---|---|---|---|---|
| 1 | EC-251717 | 50.00 | 5.00 | 25 | EC-615047 | 83.33 | 1.67 |
| 2 | EC-273966 | 66.66 | 5.00 | 26 | EC-514013 | 91.66 | 1.67 |
| 3 | EC-310310 | 83.33 | 1.00 | 27 | EC-620428 | 0.00 | 3.00 |
| 4 | EC-620503 | 91.66 | 1.00 | 28 | EC-620452 | 83.33 | 1.00 |
| 5 | EC-625644 | 91.66 | 5.00 | 29 | EC-620446 | 91.66 | 1.00 |
| 6 | EC-615055 | 83.33 | 1.60 | 30 | EC-636482 | 83.33 | 1.00 |
| 7 | EC-617059 | 91.66 | 1.60 | 31 | EC-251751 | 83.33 | 1.00 |
| 8 | EC-617066 | 0.00 | 1.00 | 32 | EC-320565 | 91.66 | 1.00 |
| 9 | EC-617068 | 66.66 | 1.00 | 33 | EC-145057 | 83.33 | 1.33 |
| 10 | EC-620434 | 50.00 | 1.00 | 34 | EC-251518 | 83.33 | 1.67 |
| 11 | EC-620463 | 0.00 | 1.00 | 35 | LA-1940 | 91.66 | 5.00 |
| 12 | EC-620522 | 100.00 | 1.00 | 36 | LA-3120 | 83.33 | 1.67 |
| 13 | EC-164295 | 83.33 | 1.00 | 37 | LA-3006 | 86.33 | 1.00 |
| 14 | EC-631356 | 0.00 | 1.00 | 38 | LA-2662 | 83.33 | 1.00 |
| 15 | EC-251694 | 100.00 | 5.00 | 39 | LA-0490 | 91.66 | 1.00 |
| 16 | EC-631962 | 83.33 | 1.00 | 40 | LA-4345 | 83.33 | 1.00 |
| 17 | EC-638302 | 66.66 | 1.00 | 41 | LA-3005 | 83.33 | 1.00 |
| 18 | EC-676742 | 50.00 | 1.00 | 42 | LA-0535 | 50.00 | 1.67 |
| 19 | Arka Vikas | 100.00 | 1.00 | 43 | LA-3847 | 0.00 | 1.33 |
| 20 | LA-1589 | 100.00 | 5.00 | 44 | AVTO-9802 | 0.00 | 1.67 |
| 21 | EC-567305 | 66.66 | 1.00 | 45 | LA-1500 | 83.33 | 3.70 |
| 22 | LA-3667 | 0.00 | 5.00 | 46 | LA-1015 | 91.66 | 1.00 |
| 23 | Pusa Ruby | 83.33 | 1.67 | 47 | LA-1664 | 83.33 | 1.00 |
| 24 | AVTO-1219 | 0.00 | 3.00 | 48 | EC-620570 | 0.00 | 1.67 |
Evaluation for TSWV resistance under induced disease conditions
Out of the 48 genotypes screened for TSWV resistance based on morphological symptoms using 1–5 score, as many as 26 genotypes, EC-310310, EC-620503, EC-617066, EC-617068, EC-620434, EC-620463, EC-620522, EC-164295, EC-631356, EC-631962, EC-638302, EC-676742, Arka Vikas, EC-567305, EC-620452, EC-620446, EC-636482, EC-251751, EC-320565, LA-3006, LA-2662, LA-0490, LA-4345, LA-3005, LA-1015 and LA-1664 exhibited symptoms of whole plant diseased (Table 7) and scored as 1; 12 genotypes i.e. Pusa Ruby, EC-615047, EC-514013, EC-251518, LA-3120, LA-0535, AVTO-9802, EC-620570, EC-615055, EC-617059, EC-145057 and LA-3847 were diseased with few green stems and leaves, scored as 2; two genotypes, AVTO-1219 and EC-620428 were the plants with 50% diseased and had one to two fruits (scored as 3); the stem and other plant parts were healthy in case of LA-1500 and scored as 4, and healthy plants with score of 5 were EC-251717, EC-273966, EC-625644, EC-251694, LA-1589, LA-3667 and LA-1940.
Correlation study
A significant positive correlation was observed between fruit weight and fruit yield per plant (Fig. 7) and negative correlation was observed for fruit number per plant with fruit weight and fruit yield per plant. The remaining correlations were neutral and non significant.
Fig. 7.
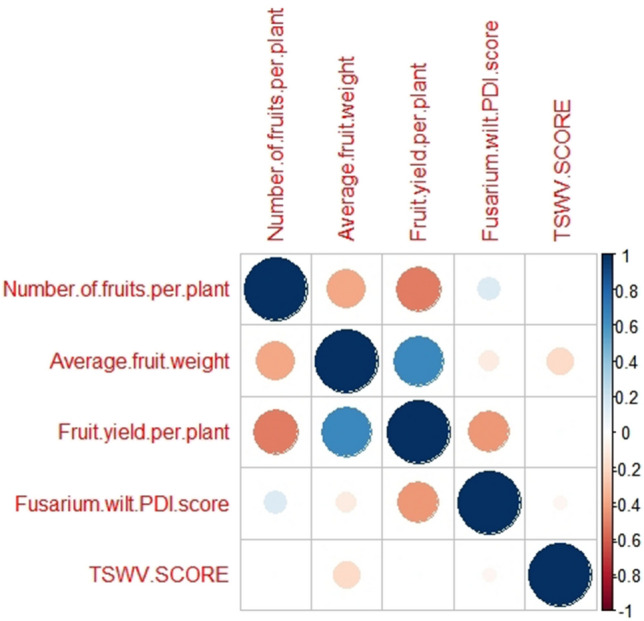
Correlations analysis among yield, yield attributes, TSWV score and fusarium wilt PDI score in tomato
Discussion
Genetic improvement of yield and other agronomical traits in a crop will be easier, if the assessment of diversity analysis is proper. The discovery and use of molecular markers has advantages and among these, SSRs are playing a vital role in molecular diversity studies and in identifying better parents for heterosis breeding. The present investigation found the existence of a high level of diversity among 48 tomato genotypes using 130 SSRs. Out of these, 84 polymorphic primers yielded 195 alleles with 64.6% polymorphism. Polymorphism was observed in different studies varying from 27.75% (Velpula et al. 2017) to 100% (Chen et al. 2009; San et al. 2008). Earlier, in the study of genetic diversity and DNA finger printing of 10 Egyptian tomato varieties, Mohamed et al. (2012), reported almost similar level of polymorphism (60.5%) using 20 SSRs, a range of polymorphism by Pidigam et al. 2019 using RAPDs in yardlong bean and Saidaiah et al. 2021 in Lablab purpureus with RAPD markers. The level of polymorphism may be due to the amount variability and levels association of selected SSRs with reference to genotypes. Average of 2.32 alleles/ marker was recorded in the present study and 29.7% primers showed alleles above the mean level, which is comparable to the other studies (Chen et al. 2009; Velpula et al. 2017). Of these, TES478 and TGS3032 showed highest level of polymorphism with four alleles each. The PIC values range reported was between 0.12 and 0.93 with an average of 0.69, showing higher values than the earlier reported PIC values of 0.27 (Saravanan et al. 2014), 0.31 (Benor et al. 2008), 0.37 (He et al. 2003), 0.39 (Frary et al. 2005), 0.40 (Bredemeijer et al. 2002), 0.45 (Glogovac et al. 2013) and 0.58 (Sardaro et al. 2013) in different diversity studies in tomato. Whereas, Known et al. (2006 and 2009) observed very nearer PIC values similar to the present study. In this study, 56% of markers showed the highest PIC value (> 0.5). TGS2446 recorded the highest PIC with 0.93. TGS1360, TGS2288, SSR-111, TGS-522, TES20 and TES1028 followed with more than 0.9 values indicating that these primers would be further useful for selectivity and to determine the genetic variability in tomato germplasm. In these, SSR111 also proved its importance in identifying genetic diversity in tomato with 100% polymorphism (Kaushal et al. 2017) and 3 alleles (Frary et al. 2005; Chen et al. 2009) and recommended for further studies having the highest PIC values (Glogovac et al. 2013). Zhao et al. (2016) reported a significant association of sucrose with TES1028 loci on chromosome 9. About 43 alleles were identified having a positive average allele effect from 26 SSR markers (out of 84 polymorphic SSR markers) distributed across nine chromosomes. The positive average allele effect was associated with fruit weight, fruits formed per plant and fusarium wilt PDI score. Besides supporting the results of present investigation, all the above research studies also unravel the importance of genetic diversity in tomato.
Structure analysis can estimate the sub-populations number, degree of admixture along with the genetic relatedness among germplasm. In the present study, structure clustering revealed that the 48 accessions of tomato germplasm were divided into 2 distinct sub-populations (K = 2) along with different levels of admixture. This admixture level was higher in sub-population 2 than sub-population1, indicating existence of diverse genetic bases in tomato germplasm. The low value of K obtained in this study may be due to high amount of gene flow. Similar level of K value was also obtained in different studies on tomato using structure analysis (Sim et al. 2012; Henareh et al. 2016; Pailles et al. 2017). Interestingly, the majority of the LA lines clustered together in sub-population 1 may be genetically similar. Moreover, the mean Fst values of pop1 and pop2 were observed with 0.75 and 0.09, respectively suggesting strong episode of genetic drift in these populations, which was more in sub-population 1 than sub-population 2 (Henareh et al. 2016; Pailles et al. 2017). AMOVA analysis revealed a higher percentage of molecular variation with in a population (88%), when compared with population variation (12%) at p values of 0.001, suggesting that, the molecular variance was significant. This was also comparable with the previous results in the diversity analysis of tomato using SSRs (Aquirre et al. 2017; Raveendar et al. 2016). UPGMA method based phylogenetic study was constructed using binary matrix data retrieved from polymorphic alleles of 84 SSRs truncated tomato genotypes into six clusters. The highest similarity (96%) was observed between AVTO-9802 and LA-3847 (Cluster II). The lowest similarity of 20% was observed between four different pairs i.e. Pusa Ruby with EC-310310, EC-625644, and AVTO-9802 with EC-620452 and LA-1015 with EC-310310. Besides lowest similarity, Pusa Ruby also formed into separate cluster (Cluster V) by showing its diversified and superior nature with other genotypes (Yogendra and Gowda 2013). The two AVTO genotypes (AVTO-1219, AVTO-9802) involved in the present study showed 55% similarity due to the similarity in origin of taxon (S. lycopersicum) and differ in level of heat tolerance, disease resistance and fruit shape. Both the AVTO genotypes paired with LA-3667 and LA-3847 genotypes, a 96% similarity was observed between AVTO-9802 and LA-3847, which may be due to their tolerance to high temperatures (AVRDC database; Xu et al. 2017) along with other disease resistant loci. Cluster I contained two genotypes, EC-251717 and EC-625644 with 0.54 similarity coefficients. Cluster II had 38 genotypes, considered as a major group, again bifurcated into two sub-clusters. Interestingly, all the LA lines were placed in sub-cluster II B with above 58% similarity due to their similar origin and cultivar type. Whereas, LA-1940 was the only one under S. pennellii with wild type characters, separated from other genotypes into a different cluster (Cluster III) along with EC-251694. Even though LA1500 and LA1589 belong to S. pimpinellifolium, they got placed in the same cluster with other S. lycopersicum lines as reported by Aflitos et al. (2014) that, the grouping of S. lycopersicum genotypes with S. pimpinellifolium and S. pennellii as sister groups to S. habrochaites. The separation of S. pennellii form S. lycopersicum may be due to its superior agronomic performance (Rick and Tanksley 1981), divergent phenotypic variation in relation to fruit development, maturation, metabolism (Schauer et al. 2008; Steinhauser et al. 2010; Kochevenko et al. 2011) and stress tolerance (Frary et al. 2010; Bolger et al. 2014). Overall, the genotypes in the present study were clearly discriminated based on binary data yielded from polymorphic loci of SSRs. Thus, this investigation of genetic dissimilarities among tomato genotypes will be further useful in tomato improvement programs.
In addition to polymorphic primers, two gene specific primers were used to screen 48 genotypes for their resistance against TSWV (Sw-5) and fusarium wilt (I-2). Among all the genotypes, seven genotypes (EC-251717, EC-273966, EC-625644, EC-251694, LA-1589, LA-1940 and LA-3667) produced the desired resistant allele of Sw-5 resistant gene. Similar results are also reported by Shi et al. (2011) in tomato breeding approach with marker assisted selection (MAS) for Sw-5 gene using same primer with a product size of 541 bp. Both the studies represented LA-3667 as a resistant genotype, confirming the true resistance of other six genotypes with resistance loci in the present study (Shi et al. 2011). On other hand, genotypes, EC-617066, EC-620463, EC-631356, EC- EC-567305, EC-620570, EC-620428, AVTO-1219, AVTO-9802 and LA-3847 showed the amplification of fusarium wilt resistant gene (I-2) with FWZ1063 specific primer at 940 bp similar to Arens et al. (2010). Tomato genotype LA-3667 appears to be most promising with the presence of both Sw-5 and I-2 genes governing the resistance to TSWV and Fusarium wilt, respectively. The presence of Sw-5 and I-2 genes against TSWV (Stevens et al. 1991; Robbins et al. 2010; Parrella et al. 2002) and fusarium wilt (Chaerani et al. 2007; Arens et al. 2010) diseases proves an opportunity for selection and identification of suitable donors for introgression of desired genes into elite cultivars through MAS.
All the 48 genotypes of tomato were screened for fusarium wilt resistance after proper confirmation of the presence of the most pathogenic (Surangal) isolate of Fusarium oxysporium. Different levels of resistance were observed among the genotypes, which indicates the occurrence of high genetic diversity among the genotypes. Nine genotypes, EC-617066, EC-620463, EC-631356, LA-3667, AVTO-1219, EC-620428, LA-3847, AVTO-9802 and EC-620570 were with 0% disease incidence and scored with 1 were showing their high resistant nature against Fusarium Wilt. The resistant nature of AVTO-1219 was also explained by Loganathan (2012–13) of World Vegetable Centre. Genotypes EC-620522, EC-251694, Arka Vikas and LA-1589 resulted as susceptible genotypes with 100 percent disease index with 3–4 score. The plant showing 0% incidence or 0 severity level symptoms were healthier and plants with the maximum disease severity level (incidence ranged from 80% -100%) were diseased. Mahmoud et al. (2006), Ahmadvand et al. (2010), Bahattin et al. (2010) and Antonio et al. (2017) also presented similar findings. Based on morphological scoring, EC-251717, EC-273966, EC-625644, EC-251694, LA-1589, LA-3667 and LA-1940 were identified as healthy plants, free of TSWV with a score of 5 followed by the genotype, LA-1500, exhibited healthy stem and other plant parts with a score of 4 for TSWV reaction.
Correlation
The correlation between fruit weight and fruit yield obtained per plant was significant and positive, while it was negative for fruit number per plant with fruit yield per plant. The correlation of either fusarium wilt PDI or TSWV disease score with the yield and its components was non-significant. To improve the tomato yield, even when fusarium wilt or TSWV incidence is there, increased fruit number per plant will enhance the per se plant fruit yield and similar results are reported earlier by several investigators (Raut et al. 2005; Singh et al. 2002; Ullah et al. 2015; Gupta et al. 2019). When plants were subjected to stress due to disease, the increase in the numbers of fruits per plant is not contributing towards yield enhancement.
Conclusion
In the present investigation, a multidisciplinary approach was used for assessing the genetic diversity within a collection of indigenous and exotic tomato germplasm. The results revealed differences among all the 48 genotypes at genotypic level and clustering revealed the degree of related and distinctiveness among the germplasm. Furthermore, a significant level of molecular variance was observed within and among the populations derived by structural analysis. In addition to distinct and related tomato accessions, the new resistant tomato lines were also validated using gene specific markers for resistance to TSWV and Fusarium wilt along with phenotypic screening. Around 43 alleles were identified with a positive average allele effect from 26 SSR markers for average fruit weight, number of fruits per plant and fusarium wilt PDI score. The identified accessions could be further exploited in different breeding programs for the development of tomato varieties with resistance to TSWV and Fusarium wilt for enhancing the farmer’s opportunities and earnings.
Supplementary Information
Below is the link to the electronic supplementary material.
Acknowledgements
The authors thankfully acknowledge the Department of Biotechnology (DBT), Government of India for financial support (DBT Grant No.: BT/PR10790/AGII/106/948/2014); SKLTSHU for providing the facilities and TGRC, UC, Davis, USA and ICAR – NBPGR for providing the germplasm.
Funding
Department of Biotechnology (DBT), Government of India.
Availability of data and materials
The data that support the findings of this study are available from the corresponding author upon request.
Declarations
Conflict of interest
The authors declare that there is no conflict of interest.
Ethical approval
Not applicable
Human participants and animals
This article does not contain any studies with human participants or animals performed by any of the authors.
Footnotes
Publisher's Note
Springer Nature remains neutral with regard to jurisdictional claims in published maps and institutional affiliations.
References
- Aflitos S, Schijlen E, de Jong H, de Ridder D, Smit S, Finkers R. Exploring genetic variation in the tomato (Solanum section Lycopersicon) clade by whole-genome sequencing. Plant J. 2014;80(1):136–148. doi: 10.1111/tpj.12616. [DOI] [PubMed] [Google Scholar]
- Agrios GN (2005) Plant pathology, 5th edn. Elsevier Academic Press, Burlington, pp 79–103. 10.1023/A:1017506213974.
- Aguirre N, López W, Orozco-Cárdenas M, Coronado YM, Vallejo-Cabrera F. Use of microsatellites for evaluation of genetic diversity in cherry tomato. Bragantia. 2017;76(2):220–228. doi: 10.1590/1678-4499.116. [DOI] [Google Scholar]
- Alvarez AE, van de Wie CCM, Smulders MJM. Use of microsatellites to evaluate genetic diversity and species relationships in the genus Lycopersicon. Theor Appl Genet. 2001;103:1283–1292. doi: 10.1007/s001220100662. [DOI] [Google Scholar]
- Gupta A, Dwivedi AK, Nagwanshi A, Dwivedi BS, Vishwakarma AK. Impact of Long Term application of inorganic fertilizer and farmyard manure on Productivity of Soybean in Vertisol. Bull Env Pharmacol Life Sci. 2019;8(4):123–127. [Google Scholar]
- Arens P, Mansilla C, Deinum D, Cavellini L, Moretti A, Rolland S, van der Schoot H, Calvache D, Ponz F, Collonnier C, Mathis R. Development and evaluation of robust molecular markers linked to disease resistance in tomato for distinctness, uniformity and stability testing. Theor Appl Genet. 2010;120(3):655–664. doi: 10.1007/s00122-009-1183-2. [DOI] [PMC free article] [PubMed] [Google Scholar]
- AVRDC Data base, https://avrdc.org/download/seed/cat-process-tomato/AVTO9802.pdf
- Awady MA, El-Tarras AA, Hassan MM. Genetic diversity and DNA fingerprint study in tomato (Solanum lycopersicum L) cultivars grown in Egypt using simple sequence repeats (SSR) markers. Afr J Biotech. 2012;11(96):16233–16240. doi: 10.5897/AJB12.2477. [DOI] [Google Scholar]
- Benor S, Zhang MY, Wang ZF, Zhang HS. Assessment of genetic variation in tomato (Solanum lycopersicum L.) inbred lines using SSR molecular markers. J Genet Genom. 2008;35:373–379. doi: 10.1016/S1673-8527(08)60054-5. [DOI] [PubMed] [Google Scholar]
- Bhuvaneswari V, Nagini S. Lycopene: a review of its potential as an anticancer agent. Curr Med Chem Anticancer Agents. 2005;5(6):627–635. doi: 10.2174/156801105774574667. [DOI] [PubMed] [Google Scholar]
- Bolger A, Scossa F, Bolger ME, Lanz C, Maumus F, Tohge T, Quesneville H, Alseekh S, Sørensen I, Lichtenstein G, Fich EA. The genome of the stress-tolerant wild tomato species Solanum pennellii. Nat Genet. 2014;46(9):1034. doi: 10.1038/ng.3046. [DOI] [PMC free article] [PubMed] [Google Scholar]
- Botstein D, White RL, Skolnick M, Davis RW. Construction of a genetic linkage map in man using restriction fragment length polymorphisms. Am J Human Genet. 1980;32(3):314. [PMC free article] [PubMed] [Google Scholar]
- Benjamini Y, Hochberg Y. Controlling the false discovery rate—a practical and powerful approach to multiple testing. J R Stat Soc B. 1995;57:289–300. [Google Scholar]
- Bredemeijer M, Cooke J, Ganal W, Peeters R, Isaac P, Noordijk Y, Rendell S, Jackson J, Roder S, Wendehake K, Dijcks M, Amelaine M, Wickaert V, Bertrand L, Vosman B. Construction and testing of a micro satellite containing more than 500 tomato varieties. Theor Appl Genet. 2002;105:1019–1026. doi: 10.1007/s00122-002-1038-6. [DOI] [PubMed] [Google Scholar]
- Chaerani R, Smulders MJM, van der Linden CG, Vosman B, Stam P, Voorrips RE. QTL identification for early blight resistance (Alternaria solani) in a Solanum lycopersicum x S. arcanum cross. Theor Appl Genet. 2007;114:439–450. doi: 10.1007/s00122-006-0442-8. [DOI] [PubMed] [Google Scholar]
- Chen J, Wang H, Shen H, Chai M, Li J, Qi M, Yang W. Genetic variation in tomato populations from four breeding programs revealed by single nucleotide polymorphism and simple sequence repeat markers. Sci Hortic. 2009;122(1):6–16. doi: 10.1016/j.scienta.2009.03.025. [DOI] [Google Scholar]
- Cooke RJ, Bredemeijer GMM, Ganal MW, Peeters R, Isaac P, Rendell S, Jackson J, Röder MS, Korzun V, Wendehake K, Areshchenkova T. Assessment of the uniformity of wheat and tomato varieties at DNA microsatellite loci. Euphytica. 2003;132(3):331–341. doi: 10.1023/A:1025046919570. [DOI] [Google Scholar]
- Earl DA, VonHoldt BM. STRUCTURE HARVESTER: a website and program for visualizing STRUCTURE output and implementing the Evanno method. Conser Genet Resour. 2012;4:359–361. doi: 10.1007/s12686-011-9548-7. [DOI] [Google Scholar]
- Evanno G, Regnaut S, Goudet J. Detecting the number of clusters of individuals using the software STRUCTURE: a simulation study. Mol Ecol. 2005;14:2611–2620. doi: 10.1111/j.1365-294X.2005.02553.x. [DOI] [PubMed] [Google Scholar]
- Frary A, Xu Y, Liu J, Mitchell S, Tedeschi E, Tanksley S. Development of a set of PCR-based anchor markers encompassing the tomato genome and evaluation of their usefulness for genetics and breeding experiments. Theor Appl Genet. 2005;111:291–312. doi: 10.1007/s00122-005-2023-7. [DOI] [PubMed] [Google Scholar]
- Frary A, Gol D, Keles D, Okmen B, Pinar H, Sigva HO, Yemenicioglu A, Doganlar S. Salt tolerance in Solanum pennellii: antioxidant response and related QTL. BMC Plant Biol. 2010;10:58. doi: 10.1007/s10535-011-0111-x. [DOI] [PMC free article] [PubMed] [Google Scholar]
- Frusciante L, Carli P, Ercolano MR, Pernice R, Di Matteo A, Fogliano V, Pellegrini N. Antioxidant nutritional quality of tomato. Mol Nutr Food Res. 2007;51(5):609–617. doi: 10.1002/mnfr.200600158. [DOI] [PubMed] [Google Scholar]
- Garcia-Martinez S, Andreani L, Garcia-Gusano M, Geuna F, Ruiz JJ. Evolution of amplified length polymorphism and simple sequence repeats for tomato germplasm fingerprinting: utility for grouping closely related traditional cultivars. Genome. 2005;49:648–656. doi: 10.1139/g06-016. [DOI] [PubMed] [Google Scholar]
- Glogovac S, Takač A, Brbaklić L, Trkulja D, Červenski J, Gvozdanović-Varga J, Popović V. Molecular evaluation of genetic variability in tomato (Lycopersicon esculentum Mill.) genotypes by microsatellite markers. Ratarstvo i Povrtarstvo. 2013;50(3):1–5. doi: 10.5937/ratpov50-4344. [DOI] [Google Scholar]
- He C, Poysa V, Yu K. Development and characterization of simple sequence repeat (SSR) markers and their use in determining relationships among Lycopersicon esculentum cultivars. Theor Appl Genet. 2003;106:363–373. doi: 10.1007/s00122-002-1076-0. [DOI] [PubMed] [Google Scholar]
- Henareh M, Dursun A, Abdollahi-Mandoulakani B, Haliloğlu K. Assessment of genetic diversity in tomato landraces using ISSR markers. Genetika. 2016;48(1):25–35. doi: 10.2298/GENSR1601025H. [DOI] [Google Scholar]
- Jaafar U, Aliero AA, Shehu K, Abubakar L. Genetic diversity in tomato genotypes (Solanum lycopersicum) based on salinity responsive candidate gene using simple sequence repeats. Int Lett Nat Sci. 2018 doi: 10.18052/ww.scipress.com/ILNS.72.37. [DOI] [Google Scholar]
- Juliatti FC, Maluf WR, Figueira AR. Reação de linhagens avançadas de tomateiro a isolados de tospovirus. Fitopatol Bras. 1994;19:62–68. [Google Scholar]
- Kaushal A, Singh A, Jeena AS. Genetic diversity in tomato (Solanum lycopersicum L.) genotypes revealed by simple sequence repeats (SSR) markers. J Nat Appl Sci. 2017;9(2):966–973. doi: 10.31018/jans.v9i2.1305. [DOI] [Google Scholar]
- Kochevenko A, Fernie AR. The genetic architecture of branched-chain amino acid accumulation in tomato fruits. J Exp Bot. 2011;62:3895–3906. doi: 10.1093/jxb/err091. [DOI] [PMC free article] [PubMed] [Google Scholar]
- Kwon YS, Park EK, Bae KM, Park SG, Cho IH. Use of simple sequence repeat (SSR) markers for variety identification of tomato, Lycopersicum esculentum. Korean J Plant Biotech. 2006;33:289–295. doi: 10.5010/JPB.2006.33.4.289. [DOI] [Google Scholar]
- Kwon YS, Park SG, Yi SI. Assessment of genetic variation among commercial tomato (Solanum lycopersicum L) varieties using SSR markers and morphological characteristics. Genes Genom. 2009;31(1):1–10. doi: 10.1007/BF03191132. [DOI] [Google Scholar]
- Laterrot H. Localisation chromosomique de I2 chez la tomate controlant la resistance au pathotype 2 de Fusarium oxysporum f.sp. lycopersici. Ann Amelior Plant. 1976;26:485–491. [Google Scholar]
- Mazzucat A, Papa R, Bitocchi E, Mosconi P, Nanni L, Negri V, Picarella ME, Siligato F, Soressi GP, Tiranti B, Veronesi F. Genetic diversity, structure and marker-trait associations in a collection of Italian tomato (Solanum lycopersicum L.) landraces. Theor Appl Genet. 2008;116(5):657–669. doi: 10.1007/s00122-007-0699-6. [DOI] [PubMed] [Google Scholar]
- Miller JC, Tanksley SD. RFLP analysis of phylogenetic relationships and genetic variation in the genus Lycopersicon. Theor Appl Genet. 1990;80(4):437–448. doi: 10.1007/BF00226743. [DOI] [PubMed] [Google Scholar]
- Mohamed AM, El-Awady AAE, El-Tarras MMH. Genetic diversity and DNA fingerprint study in tomato (Solanum lycopersicum L.) cultivars grown in Egypt using simple sequence repeats (SSR) markers. African J Biotechnol. 2012;11(96):16233–16240. doi: 10.5897/AJB12.2477ISSN1684-5315. [DOI] [Google Scholar]
- Murray MG, Thompson WF. Rapid isolation of high molecular weight plant DNA. Nucleic Acids Res. 1980;8(19):4321–4326. doi: 10.1093/nar/8.19.4321. [DOI] [PMC free article] [PubMed] [Google Scholar]
- Narshimulu G, Jamaloddin M, Vemireddy LR, Anuradha G, Siddiq E. Potentiality of evenly distributed hypervariable microsatellite markers in marker assisted breeding of rice. Plant Breed. 2011;130(3):314–320. doi: 10.1111/j.1439-0523.2010.01834.x. [DOI] [Google Scholar]
- Pailles Y, Ho S, Pires IS, Tester M, Negrão S, Schmöckel SM. Genetic diversity and population structure of two tomato species from the Galapagos Islands. Front Plant Sci. 2017;8:138. doi: 10.3389/fpls.2017.00138. [DOI] [PMC free article] [PubMed] [Google Scholar]
- Parankusam S, Adimulam SS, Bhatnagar-Mathur P, Sharma KK. Nitric oxide (NO) in plant heat stress tolerance: current knowledge and perspectives. Front Plant Sci. 2017;8:1582. doi: 10.3389/fpls.2017.01582. [DOI] [PMC free article] [PubMed] [Google Scholar]
- Park YH, West MA, Clair DA. Evaluation of AFLPs for germplasm fingerprinting and assessment of genetic diversity in cultivars of tomato (Lycopersicon esculentum L.) Genome. 2004;47(3):510–518. doi: 10.1139/g04-004. [DOI] [PubMed] [Google Scholar]
- Parrella G, Ruffel S, Moretti A, Morel C, Palloix A, Caranta C. Recessive resistance genes against potyviruses relocalized in colinear genomic regions of the tomato (Lycopersicon spp.) and pepper (Capsicum spp.) genomes. Theor Appl Genet. 2002;105:855–861. doi: 10.1007/s00122-002-1005-2. [DOI] [PubMed] [Google Scholar]
- Peakall R, Smouse PE. GenAlEx 6.5: genetic analysis in Excel. Population genetic software for teaching and research: an update. Bioinformatics. 2012;28:2537–2539. doi: 10.1093/bioinformatics/bts460. [DOI] [PMC free article] [PubMed] [Google Scholar]
- Pidigam S, Munnam SB, Nimmarajula S, Gonela N, Adimulam SS, Yadla H, Bandari L, Amarapalli G. Assessment of genetic diversity in yardlong bean (Vigna unguiculata (L.) Walp subsp. sesquipedalis Verdc.) germplasm from India using RAPD markers. Genet Resour Crop Evol. 2019;66:1231–1242. doi: 10.1007/s10722-019-00782-w. [DOI] [Google Scholar]
- Price DL, Memmott FD, Scott JW, Olson SM, Stevens MR (2007) Identification of molecular markers linked to a new Tomato spotted wilt virus resistance source in tomato. Tomato Genetics Cooperative Reporter 57
- Pritchard JK, Stephens M, Donnelly P. Inference of population structure using multilocus genotype data. Genetics. 2000;155:945–959. doi: 10.1093/genetics/155.2.945. [DOI] [PMC free article] [PubMed] [Google Scholar]
- Pritesh P, Vishal P, Oza V, Chauhan AD, Patel KB, Kathiria SRB. Genetic diversity and DNA fingerprint study of tomato discerned by SSR markers. Int J Biotechnol Biochem. 2010;6(5):657–666. doi: 10.5897/AJB12.2477. [DOI] [Google Scholar]
- R Core Team (2012) R: a language and environment for statistical computing (version 3.5.3) [software]. http://www.R-project.org. Accessed 24 Apr 2021
- Raut RL, Naidu AK, Jain PK (2005) Correlation studies in tomato (Lycopersicon esculentum Mill.). South Indian Hort 53(1–6): 258–260.
- Raveendar S, Chung JW, Lee GA, Lee JR, Lee KJ, Shin MJ, Cho YH, Ma KH. Genetic diversity and population structure of Asian tomato accessions based on simple-sequence repeats. Plant Breed Biotechol. 2016;4(3):306–314. doi: 10.9787/PBB.2016.4.3.306. [DOI] [Google Scholar]
- Rick C, Tanksley S. Genetic variation in Solanum pennellii: comparisons with two other sympatric tomato species. Plant Syst Evol. 1981;139:11–45. doi: 10.1007/BF00983920. [DOI] [Google Scholar]
- Robbins MD, Masud MA, Panthee DR, Gardner RG, Francis DM, Stevens MR. Marker-assisted selection for coupling phase resistance to tomato spotted wilt virus and Phytophthora infestans (late blight) in tomato. HortSci. 2010;45(10):1424–1428. doi: 10.21273/HORTSCI.45.10.1424. [DOI] [Google Scholar]
- Rohlf FJ (2000) NTSYS-pc: numerical taxonomy and multivariate analysis system Version 2.1. Exeter Publishing Setauket, New York
- Rosello S, Ricarte B, Diez MJ, Nuez F. Resistance to tomato spotted wilt virus introgressed from Lycopersicon peruvianum in line UPV 1 may be allelic to Sw-5 and can be used to enhance the resistance of hybrid cultivars. Euphytica. 2001;119:357–367. doi: 10.1023/a:1017506213974. [DOI] [Google Scholar]
- Saidaiah P, Munnam SB, Nimmarajula S, Amarapalli G, Sudini HK, Pandravada SR, Yadla H. Molecular characterization of Indian Dolichos bean (Lablab purpureus L. var typicus Prain) accessions using RAPD markers. Indian J Genet Plant Breed. 2021;81(2):322–326. doi: 10.31742/IJGPB.81.2.15. [DOI] [Google Scholar]
- Saidi M, Warade SD. Tomato breeding for resistance to Tomato spotted wilt virus (TSWV): an overview of conventional and molecular approaches. Czech J Genet Plant Breed. 2008;44(3):83–92. doi: 10.17221/47/2008-CJGPB. [DOI] [Google Scholar]
- San Y, Jatoi SA, Fujimura T, Yamanaka S, Watanabe J, Watanabe KN. Potential loss of unique genetic diversity in tomato landraces by genetic colonization of modern cultivars at a non-center of origin. Plant Breed. 2008;127(2):189–196. doi: 10.1186/1471-2164-14-835. [DOI] [Google Scholar]
- Saravanan KR, Ranjith R, Renganathan P. Studies on genetic diversity using SSR marker associated traits in tomato genotypes (Lycopersicum esculentum L) European J Biotechol Biosci. 2014;1(5):26–29. [Google Scholar]
- Sardaro MLS, Marmiroli M, Maestri E, Marmiroli N. Genetic characterization of Italian tomato varieties and their traceability in tomato food products. Food Sci Nutr. 2013;1(1):54–62. doi: 10.1002/fsn3.8. [DOI] [PMC free article] [PubMed] [Google Scholar]
- Sarfatti M, Katan J, Fluhr R, Zamir D. An RFLP marker in tomato linked to the Fusarium oxysporum resistance gene I2. Theor Appl Genet. 1989;78(5):755–759. doi: 10.1007/BF00262574. [DOI] [PubMed] [Google Scholar]
- Schauer N, Semel Y, Balbo I, Steinfath M, Repsilber D, Selbig J, Pleban T, Zamir D, Fernie AR. Mode of inheritance of primary metabolic traits in tomato. Plant Cell. 2008;20(3):509–523. doi: 10.1105/tpc.107.056523. [DOI] [PMC free article] [PubMed] [Google Scholar]
- Shi A, Vierling R, Grazzini R, Chen P, Caton H, Panthee D. Identification of molecular markers for Sw-5 gene of tomato spotted wilt virus resistance. Am J Biotechol Mol Sci. 2011;1(1):8–16. doi: 10.5251/ajbms.2011.1.1.8.16. [DOI] [Google Scholar]
- Sim SC, Van Deynze A, Stoffel K, et al. High density SNP genotyping of tomato (Solanum lycopersicum L.) reveals patterns of genetic variation due to breeding. PLoS ONE. 2012;7(9):e45520. doi: 10.1371/journal.pone.0045520. [DOI] [PMC free article] [PubMed] [Google Scholar]
- Simons G, John G, Jelle W, Martin R, José G, Paul D, Theo V, Marjo B, Joke O, Michiel B, Michel H, Jurriaan M, Ben C, Marc Z, Pieter V (1998) Dissection of the Fusarium I-2 gene cluster in tomato reveals six homologs and one active gene copy. Plant Cell 10 (6): 1055–1068. 10.1105/tpc.10.6.1055 [DOI] [PMC free article] [PubMed]
- Singh P, Singh S, Cheema DS, Dhaliwal MS. Genetic variability and correlation study of some heat tolerant tomato genotypes. Veg Sci. 2002;29:68–70. [Google Scholar]
- Stall RE, Walter JM. Selection and inheritance of resistance in tomato to isolates of races 1 and 2 of the Fusarium wilt organism. Phytopathology. 1965;55:1213–1215. [Google Scholar]
- Steinhauser MC, Steinhauser D, Koehl K, Carrari F, Gibon Y, Fernie AR, Stitt M. Enzyme activity profiles during fruit development in tomato cultivars and Solanum pennellii. Plant Physiol. 2010;153:80–98. doi: 10.1104/pp.110.154336. [DOI] [PMC free article] [PubMed] [Google Scholar]
- Stevens MR, Scott SJ, Gergerich RC. Inheritance of a gene for resistance to tomato spotted wilt virus (TSWV) from Lycopersicon peruvianum Mill. Euphytica. 1991;59:9–17. doi: 10.1007/BF00025356. [DOI] [Google Scholar]
- Tabassum N, Sony SK, Bhajan SK, Islam MN. Analysis of genetic diversity in eleven tomato (Lycopersicon esculentum Mill.) varieties using RAPD markers. Plant Tissue Cult Biotechol. 2013;23(1):49–57. doi: 10.3329/ptcb.v23i1.15559. [DOI] [Google Scholar]
- Ullah MZ, Hassan L, Sonia BS, Patwary AK. Variability and inter relationship studies in tomato (Solanum lycopersicum L.) J Bangl Agril Univ. 2015;13(1):65–69. doi: 10.3329/jbau.v13i1.28716. [DOI] [Google Scholar]
- Velpula PK, Parihar DS, Pinnamaneni R. Genetic diversity analysis of ripening specific genotypes using potential public domain SSR markers in tomato (Solanum Lycopersicum) J Plant Breed Genet. 2017;5(2):39–44. [Google Scholar]
- Wang T, Zou QD, Qi SY, Wang XF, Wu YY, Liu N, Zhang YM, Zhang ZJ, Li HT. Analysis of genetic diversity and population structure in a tomato (Solanum lycopersicum L.) germplasm collection based on Single Nucleotide Polymorphism markers. Genet Mol Res. 2016;15(3):1–12. doi: 10.4238/gmr.15038209. [DOI] [PubMed] [Google Scholar]
- Xu J, Driedonks N, Rutten MJM, Vriezen WH, de Boer GJ, Rieu I. Mapping quantitative trait loci for heat tolerance of reproductive traits in tomato (Solanum lycopersicum) Mol Breed. 2017 doi: 10.1007/s11032-017-0664-2. [DOI] [PMC free article] [PubMed] [Google Scholar]
- Yang WC, Sacks E, Ivey MLL, Miller SA, Francis DM. Resistance in Lycopersicon esculentum intraspecific crosses to race T1 strains of Xanthomonas campestris pv. vesicatoria causing bacterial spot of tomato. Phytopathology. 2005;95:519–527. doi: 10.1094/PHYTO-95-0519. [DOI] [PubMed] [Google Scholar]
- Yogendra KN, Gowda PR. Phenotypic and molecular characterization of a tomato (Solanum lycopersicum L.) Genet Mol Res. 2013;12(1):506–518. doi: 10.4238/2013.January.9.4. [DOI] [PubMed] [Google Scholar]
- Zhao J, Xu Y, Ding Q, Huang X, Zhang Y, Zou Z, Li M, Cui Lu, Zhang J. Association mapping of main tomato fruit sugars and organic acids. Front Plant Sci. 2016;7:1286. doi: 10.3389/fpls.2016.01286. [DOI] [PMC free article] [PubMed] [Google Scholar]
- Zhou R, Wu Z, Cao X, Jiang FL. Genetic diversity of cultivated and wild tomatoes revealed by morphological traits and SSR markers. Genet Mol Res. 2015;14(4):13868–13879. doi: 10.4238/2015.october.29.7. [DOI] [PubMed] [Google Scholar]
Associated Data
This section collects any data citations, data availability statements, or supplementary materials included in this article.
Supplementary Materials
Data Availability Statement
The data that support the findings of this study are available from the corresponding author upon request.