

Abstract
Background
Arterial calcification is associated with cardiovascular mortality in dialysis patients. Active matrix Gla protein (MGP) is a vitamin K-dependent inhibitor of arterial calcification. Elevated plasma concentrations of inactive MGP, i.e. dephosphorylated-uncarboxylated MGP (dp-ucMGP), are prevalent in dialysis patients. MGP inactivity might contribute to arterial calcification. We investigated whether vitamin K supplementation had an effect on arterial calcification in chronic dialysis patients.
Methods
In a 2-year, double-blind, placebo-controlled intervention trial, 48 dialysis patients were randomized to vitamin K [menaquinone-7 (MK-7), 360 µg daily] or placebo. MK-7 in serum and dp-ucMGP in plasma were used to assess vitamin K status. Carotid-femoral pulse wave velocity (cfPWV) and scores of coronary arterial calcification (CAC) and abdominal aortic calcification (AAC) were used to assess arterial calcification.
Results
Thirty-seven participants completed Year 1, and 21 completed Year 2. At Year 2, serum MK-7 was 40-fold higher, and plasma dp-ucMGP 40% lower after vitamin K supplementation compared with placebo {mean dp-ucMGP difference: −1380 pmol/L [95% confidence interval (CI) −2029 to −730]}. There was no significant effect of vitamin K supplementation on cfPWV [mean difference at Year 2: 1.2 m/s (95% CI −0.1 to 2.4)]. CAC Agatston score increased significantly in vitamin K supplemented participants, but was not significantly different from placebo [mean difference at Year 2: 664 (95% CI −554 to 1881)]. AAC scores increased in both groups, significantly so within the placebo group at Year 1, but with no significant between-group differences.
Conclusions
Vitamin K supplementation improved vitamin K status, but did not hinder or modify the progression of arterial calcification in dialysis patients.
Keywords: chronic kidney disease, coronary arterial calcification, menaquinone-7, pulse wave velocity
INTRODUCTION
Patients with chronic kidney disease (CKD) have extensive arterial calcification contributing to cardiovascular disease, their most frequent cause of premature death [1–4]. Compared with the general population, death due to cardiovascular disease is 10–20 times more frequent and accounts for ˃50% of the total death toll in dialysis patients [3–5]. In CKD, calcification of the arterial tunica media leads to stiffening of the arterial wall and a rising pulse wave velocity (PWV) [6, 7]. In human observational studies, increasing PWV, coronary arterial calcification (CAC) and abdominal aortic calcification (AAC) all increase the risk of cardiovascular disease [8, 9].
Arterial calcification is influenced by matrix Gla protein (MGP). In their landmark study from 1997, Luo et al. observed that MGP knockout mice died prematurely from aortic rupture due to extensive calcification within 6 weeks from birth [10]. MGP is produced by osteoclasts, chondrocytes and vascular smooth muscle cells in an inactive form (dephosphorylated-uncarboxylated MGP; dp-ucMGP). dp-ucMGP is activated by phosphorylation and vitamin K-dependent carboxylation [11]. In observational studies of CKD patients, higher concentrations of inactive dp-ucMGP were associated with more extensive arterial calcification, and with increased cardiovascular and all-cause mortality [12–16].
CKD patients, in particular dialysis patients, have strongly elevated plasma levels of dp-ucMGP reflecting vascular vitamin K deficiency [17]. It has been hypothesized that vitamin K supplementation might improve MGP activation and lead to less arterial calcification in dialysis patients. Previous studies have indeed demonstrated that vitamin K supplementation reduces plasma dp-ucMGP levels. However, only two studies on the effect of vitamin K supplementation on arterial calcification in dialysis patients have been published so far. Both were unblinded and did not include placebo treatment [18, 19]. The present trial examined the effect of vitamin K supplementation on dp-ucMGP and arterial calcification in dialysis patients in a randomized, double-blind and placebo-controlled setting.
MATERIALS AND METHODS
The RenaKvit study is a 2-year, randomized, double-blind and placebo-controlled intervention trial of vitamin K supplementation in dialysis patients and examines the effect of vitamin K on bone quality and arterial calcification. The present manuscript reports findings on arterial calcification.
Based on separate statistical power calculations for bone and artery primary outcomes made a priori (see ‘Statistical methods’ section below), 123 participants were enrolled. All participated in the bone arm of the study (to be published separately). A subgroup of 48 individuals participated in the present arterial calcification study arm. PWV was the primary study outcome. PWV was chosen as the primary outcome because we expected the chance of identifying PWV changes to be higher than changes in any of the calcification scores, since calcification scores represent the final and probably less dynamic stage of the calcification process. Secondary outcomes were changes in CAC scores, AAC score and blood markers of vitamin K status. The RenaKvit study was conducted at four different nephrology units in Denmark (Zealand University Hospital Roskilde, Holbæk Hospital, Aarhus University Hospital and Aalborg University Hospital) in the period November 2016 to June 2020. The study was approved by The Scientific Ethics Committee for the Region of Zealand, The Danish Data Protection Agency and all participating sites, and was registered at ClinicalTrials.gov (NCT02976246). The supporting CONSORT (CONsolidated Standards Of Reporting Trials) checklist is available as Supplementary data, Table S1.
Study population
Eligible participants were patients with a dialysis vintage of ˃3 months, aged ≥18 years and with a life expectancy of at least 2 years. All participants provided their informed written consent.
Exclusion criteria in the arterial calcification arm of RenaKvit were: ongoing treatment with vitamin K or vitamin K-antagonists, atrial fibrillation or other cardiac arrhythmias, severe aortic valve stenosis, bilateral arteriovenous fistulas of upper extremities, amputations of lower extremities above metatarsal level, chronic gastrointestinal malabsorption, ongoing malignancy, any kind of alcohol/drug abuse, former partial or total parathyroidectomy and ongoing treatment with recombinant parathyroid hormone (PTH), bisphosphonates or other anti-osteoporotic drugs. Fertile women who were without contraception, pregnant or breastfeeding were also excluded. During follow-up, participants were excluded if they received a kidney transplant, initiated vitamin K-antagonist treatment, had inacceptable side effects of study tablets or were obviously study non-compliant.
Intervention and measurements
Intervention
Participants were randomized to either one daily tablet containing 360 µg vitamin K in the form of menaquinone-7 (MK-7) or a visually identical placebo tablet. Tablets had to be taken every morning with some dairy fat. Synthetic MK-7 (K2VITAL®Delta) was produced by Kappa Bioscience AS, Oslo, Norway, according to the Hazard Analysis Critical Control Point principles. Orkla Care AS, Ishøj, Denmark, produced all tablets. The 360 µg dose was chosen on the basis of one published study demonstrating a dose-dependent decline in dp-ucMGP with a 60% decline at the maximum dose of 360 µg daily [20], and another study reporting a maximum decline in dp-ucMGP of 46% at a maximum dose of 1080 µg thrice weekly (equivalent to 463 µg daily) [21]. Taken together these data suggested that 360 µg daily was a potent dosage. We were reluctant to go too high in dosing due to a fear of unknown side effects in our long-term trial (the dose-finding studies were of a few weeks’ duration).
Adherence and adverse events
Tablet containers were handed out at baseline, and at 3, 6, 12 and 18 months. Tablet adherence was checked after 3, 6, 12, 18 and 24 months by counting left-over tablets in returned tablet containers. Patient records were examined for adverse events including death after 12 and 24 months.
Randomization
Blocked randomization of four participants (2:2) was performed by the local statistical department. Each block consisted of patients attending the same dialysis centre and being treated with the same dialysis modality. Coded labelling of tablet containers was carried out by the Clinical Pharmaceutical Service at Herlev University Hospital, Copenhagen, Denmark. Randomization codes were blinded to participants, hospital staff and investigators until all data harvesting and data spreadsheet input had been finished.
Measurements
Biochemical samples were collected, radiographic imaging, carotid-femoral PWV (cfPWV) and 24-h ambulatory blood pressure (BP) measurements were performed, and clinical data harvested from patient records at baseline, after 1 and 2 years.
cfPWV
Changes in cfPWV were the primary study endpoint. cfPWV is defined as the distance between the two recording sites divided by the difference in pulse wave travel time and expressed in metres per second (m/s). All pulse wave measurements were performed in double under standardized examination conditions according to guidelines [22] by the same trained research nurse or trial investigator at each study site to minimize inter-observer variation. Methodology details are presented in Supplementary material S2.
Radiographic imaging
Computed tomography (CT) of the heart was performed using a 256-slice Philips iCT scanner (Philips Healthcare, Amsterdam, The Netherlands) or a Siemens 128-slice CT scanner (Siemens Healthcare GmbH, Erlangen, Germany). Recordings were synchronized with electrocardiogram and participants were instructed to lie supine, still and intermittently hold their breath. Quantification of calcification was estimated both as 2D scoring ad modum Agatston and 3D volume scoring using IntelliSpace software (Philips Healthcare, Cleveland, OH, USA) [23]. Calcification scores were obtained from the coronary arteries (CAC), and from the aortic and mitral valves [cardiac valve calcification (CVC)].
All heart CT scans from all participants were reviewed separately by two experienced cardiologists. If calcification estimates differed by ˃5%, the cardiologists reviewed the scan together.
AAC score was quantified using a laterally exposed conventional X-ray of the lumbar spine and abdominal aorta according to Kauppila et al. [24]. All X-rays from all participants were reviewed by the same experienced radiologist to eliminate inter-observer variation.
Twenty-four-hour ambulatory BP
A 24-h BP measurement was performed using the validated BP device Mobil-O-Graph® (IEM-HMS, Stolberg, Germany) as recommended [25] (details presented in Supplementary material S2).
Biochemical measurements
Fasting blood samples were taken from the patient outlet line in haemodialysis patients at the initiation of a dialysis session, and from a peripheral vein in peritoneal and hybrid dialysis patients. The blood samples were centrifuged for 10 min at 3000g within 30–60 min and were immediately stored at −80°C until analysis up to 32 months later.
Serum vitamin K1 and MK-7 were analysed by mass spectrometry according to Boegh et al. with modifications for MK-7 analysis (Supplementary data, Tables S3 and S4) [26]. Protein induced by Vitamin K Absence-II (PIVKA-II) was measured in plasma using a commercially available electrochemiluminescence immunoassay (ECLIA) according to the manufacturer’s instructions (Cobas e602 analyser, Roche Diagnostics, Denmark). The intermediary precision was <7%. Dp-ucMGP was measured in plasma using a commercially available ECLIA according to the manufacturer’s instructions (ImmunoDiagnostic Systems Holdings PLC, East Boldon, UK). The intermediary precision was <10%. 1,25-(OH)2 vitamin D was measured in serum using a CLIA in the IDS-iSYS automated analyser (ImmunoDiagnostic Systems Holdings PLC, East Boldon, UK). Intermediary precision was <17%. Routine blood analyses were performed at local certified laboratories.
Statistical methods
Based on previous studies, our study was designed to give 80% power to detect a minimal relevant difference in cfPWV of 1 m/s after 1 year at a significance level of 5% at an assumed SD of 0.95 m/s [6, 27]. We expected a yearly drop-out rate of 20%. Based on these assumptions, we aimed at 2 × 16 participants completing Year 1, and therefore aimed at including at least 2 × 20 participants.
Maximum likelihood estimates of treatment effects on levels as well as change of biological markers were estimated using linear mixed effects regression models including a random intercept for each patient. The analyses were adjusted for baseline measures by constraining the baseline means of the treatment groups to be equal as suggested by Twisk et al. [28]. Examination of the underlying model assumptions were performed by visual inspection of QQ-plots of residual errors and of random effects. Non-parametric bootstrapping estimation with 1000 replications was implemented if non-normality of residuals or random effects was observed. Severe deviation from homoscedasticity was observed for MK-7 due to increasing variation in the vitamin K group at follow-up measurements. The analysis for this particular outcome was modified allowing for separate residual variance estimates at follow-up, but only for the treatment group. With the applied methodology missing values were handled and list exclusion avoided, meaning that analyses were intention to treat analyses. Linear mixed-effects models were implemented in Stata Statistical software, version 16, 2019 (Statacorp LCC, College Station, TX, USA). A P < 0.05 was considered statistically significant.
RESULTS
A total of 689 dialysis patients were screened, and 48 patients were enrolled. Participants were randomized to either vitamin K (n = 24), or placebo (n = 24). Eleven patients (23%) dropped out during Year 1. An additional 16 participants (33%) dropped out during Year 2 of the trial, leaving 21 completing participants (Figure 1). Baseline characteristics of all 48 randomized participants are shown in Table 1.
FIGURE 1:

CONSORT flow diagram.
Table 1.
Baseline characteristics of 48 randomized dialysis patients
| Vitamin K | Placebo | |
|---|---|---|
| No. (total) | 24 | 24 |
| Males | 19 (79) | 18 (75) |
| Age, years | 62 (±11) | 66 (±11) |
| Height, cm | 174 (±10) | 174 (±7) |
| Body mass index, kg/m2 | 26.5 (±5.8) | 29.2 (±6.1) |
|
Cardiovascular calcification risk factors Systolic BP, mmHg Diastolic BP, mmHg P-LDL cholesterol, mmol/L P-phosphate, mmol/L P-ionized calcium, mmol/L P-PTH, pmol/L P-1,25-OH2 vitamin D, pmol/L P-25-OH vitamin D, nmol/L Smokers Active Former |
134 (±19) 80 (±12) 2.0 (1.4; 2.8) 1.64 (1.38; 1.75) 1.19 (±0.10) 25 (19; 42) 53 (±33) 69 (±39) 7 (29) 13 (54) |
137 (±17) 82 (±15) 2.4 (2.2; 3.5) 1.45 (1.25; 1.93) 1.20 (±0.07) 18 (13; 34) 44 (±24) 58 (±30) 6 (25) 9 (38) |
|
Comorbidity Cerebral stroke Peripheral arterial disease Ischaemic heart disease |
3 (13) 4 (17) 5 (21) |
0 (0) 1 (4) 1 (4) |
|
Dialysis modality Haemodialysis Peritoneal dialysis Hybrid dialysisa |
16 (67) 8 (33) 0 (0) |
11 (46) 10 (42) 3 (12) |
| Dialysis vintage, months | 28 (7; 48) | 22 (12; 45) |
| Former kidney transplant | 4 (17) | 4 (17) |
|
Medication Anti-diabetic Lipid-lowering Anti-hypertensive Beta-blockers Calcium channel blockers Diuretics Aldosterone antagonists RAS blockers (ACEI/ARB) Others (moxonidin and minoxidil) Vitamin D Native Activated Phosphate binders Calcium-containing Non-calcium-containing Calcimimetics |
7 (29) 9 (38) 21 (88) 14 (58) 14 (58) 16 (67) 1 (4) 6 (25) 4 (17) 20 (83) 17 (71) 11 (46) 21 (88) 4 (17) |
7 (29) 6 (25) 24 (100) 16 (67) 16 (67) 14 (58) 3 (13) 14 (58) 4 (17) 14 (58) 18 (75) 14 (58) 18 (75) 8 (33) |
Categorical data are presented as number and percentage [n (%)]. Continuous variables are presented as mean (± SD), or median (interquartile range).
Hybrid dialysis; treatment consisting of both haemodialysis and peritoneal dialysis.
P, plasma; LDL, low-density lipoprotein; RAS, renin–angiotensin system; ACEI, angiotensin-converting enzyme inhibitor; ARB, angiotensin-II receptor blocker.
Outcomes
Individual serum MK-7 and plasma dp-ucMGP values are shown in Figure 2.
FIGURE 2:
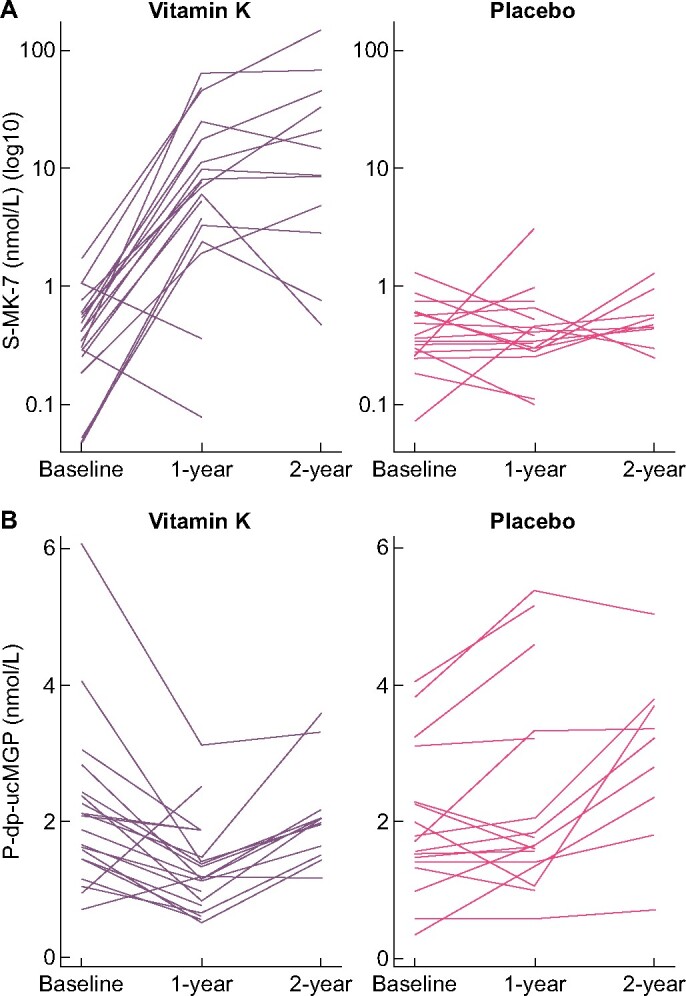
Effect of vitamin K supplementation (MK-7 360 µg daily) or placebo in dialysis patients on (A) serum MK-7 (nmol/L) and (B) plasma dp-ucMGP (nmol/L).
Serum MK-7 increased progressively over the 2-year period in the vitamin K supplemented group and was 40-fold elevated compared with placebo at Year 2.
Plasma dp-ucMGP decreased significantly around 30% within the vitamin K group during Year 1, but then rose during Year 2. In the placebo group, a steady increase in dp-ucMGP over both years was observed. The treatment effect was almost identical at Years 1 and 2 with the vitamin K group having dp-ucMGP concentrations of 40–45% lower than the placebo group.
For plasma concentrations of PIVKA-II, vitamin K supplementation caused a marginally significant 45% lowering after 1 and 2 years compared with placebo (Table 2).
Table 2.
Effect of vitamin K supplementation (MK-7 360 µg daily) or placebo in dialysis patients: biochemical outcomes estimated from linear mixed models with random intercepts
| Outcome | Time | Mean levels (95% CI) |
Mean change within group (95% CI) |
Mean difference between groups (95% CI) |
||||||
|---|---|---|---|---|---|---|---|---|---|---|
| Vitamin K | Placebo | Vitamin K | P-value | Placebo | P-value | P- value | ||||
|
S-vitamin K1 (nmol/L) |
Baseline | 0.6 (0.4 to 0.9), n = 48 | ||||||||
| Year 1 | 0.7 (0.3 to 1.2), n = 19 | 0.6 (0.2 to 1.1), n = 17 | 0.1 (−0.4 to 0.6) | 0.66 | 0.0 (−0.5 to 0.5) | 0.94 | 0.1 (−0.5 to 0.7) | 0.69 | ||
| Year 2 | 0.9 (0.3 to 1.4), n = 12 | 1.0 (0.4 to 1.6), n = 9 | 0.3 (−0.3 to 0.8) | 0.40 | 0.4 (−0.3 to 1.0) | 0.27 | −0.1 (−0.9 to 0.7) | 0.76 | ||
|
S-MK-7 (nmol/L) |
Baseline | 0.6 (−3.8 to 5.0), n = 48 | ||||||||
| Year 1 | 15.0 (8.1 to 21.9), n = 19 | 0.6 (−6.7 to 7.9), n = 17 | 14.4 (1.4 to 27.4) | 0.03 | 0.0 (−0.3 to 0.4) | 0.80 | 14.4 (1.4 to 27.4) | 0.03 | ||
| Year 2 | 29.5 (20.9 to 38.1), n = 12 | 0.7 (−9.2 to 10.6), n = 9 | 29.2 (12.9 to 45.6) | <0.001 | 0.2 (−0.3 to 0.6) | 0.46 | 29.1 (12.7 to 45.5) | <0.001 | ||
| P-dp-ucMGP (pmol/L) | Baseline | 2104 (1793 to 2415), n = 48 | ||||||||
| Year 1 | 1290 (883 to 1696), n = 20 | 2399 (1968 to 2831), n = 17 | −814 (−1169 to −460) | <0.001 | 295 (−87 to 678) | 0.13 | −1110 (−1615 to −604) | <0.001 | ||
| Year 2 | 1952 (1472 to 2432), n = 12 | 3332 (2795 to 3868), n = 9 | −152 (−588.83 to 285) | 0.49 | 1228 (729 to 1726) | <0.001 | −1380 (−2029 to −730) | <0.001 | ||
|
P-PIVKA-II (ng/mL) |
Baseline | 41.8 (35.4 to 48.1), n = 47 | ||||||||
| Year 1 | 17.2 (7.5 to 26.9), n = 20 | 31.3 (20.8 to 41.8), n = 17 | −24.6 (−36.1 to −13.0) | <0.001 | −10.4 (−22.7 to 1.8) | 0.10 | −14.1 (−28.4 to 0.1) | 0.05 | ||
| Year 2 | 22.4 (9.9 to 34.8), n = 12 | 39.3 (24.9 to 53.7), n = 9 | −19.4 (−33.4 to −5.4) | 0.01 | −2.5 (−18.2 to 13.3) | 0.76 | −16.9 (−36.0 to 2.2) | 0.08 | ||
S, serum; P, plasma.
cfPWV
Individual cfPWV measurements are presented in Supplementary data, Figure S5.
Mean cfPWV declined during Year 1 in both groups, significantly so in the placebo group. The cfPWV changes during intervention did not differ significantly between groups, but there was a slight trend towards a higher cfPWV with vitamin K supplementation at the 2-year follow-up. cfPWV results remained unaltered after adjustment for mean arterial pressure obtained just prior to PWV measurements {mean difference in cfPWV at Year 2 after adjustment: 1.1 m/s [95% confidence interval (CI) −0.1 to 2.2, P = 0.07]} (Table 3).
Table 3.
Effect of vitamin K supplementation (MK-7 360 µg daily) or placebo in dialysis patients: arterial outcomes estimated from linear mixed models with random intercepts
| Outcome | Time | Mean levels (95% CI) |
Mean change within group (95% CI) |
Mean difference between groups (95% CI) |
|||||
|---|---|---|---|---|---|---|---|---|---|
| Vitamin K | Placebo | Vitamin K | P-value | Placebo | P-value | P-value | |||
|
cfPWV (m/s) |
Baseline | 9.8 (9.0 to 10.5), n = 47 | |||||||
| Year 1 | 9.4 (8.5 to 10.4), n = 18 | 9.0 (7.9 to 10.0), n = 14 | −0.3 (−1.0 to 0.4) | 0.34 | −0.8 (−1.6 to −0.0) | 0.04 | 0.5 (−0.6 to 1.5) | 0.37 | |
| Year 2 | 10.5 (9.4 to 11.5), n = 11 | 9.3 (8.2 to 10.4), n = 9 | 0.7 (−0.2 to 1.6) | 0.11 | −0.5 (−1.4 to 0.5) | 0.35 | 1.2 (−0.1 to 2.4) | 0.08 | |
| CAC Agatstona,c | Baseline | 2034 (1650 to 2419), n = 48 | |||||||
| Year 1 | 2573 (2034 to 3111), n = 19 | 2723 (1923 to 3524), n = 17 | 538 (−32 to 1109) | 0.06 | 689 (−149 to 1527) | 0.11 | −151 (−1154 to 852) | 0.77 | |
| Year 2 | 3253 (2285 to 4222), n = 11 | 2590 (1913 to 3266), n = 9 | 1219 (196 to 2242) | 0.02 | 555 (−87 to 1197) | 0.09 | 664 (−554 to 1881) | 0.29 | |
|
CAC Volumea,c |
Baseline | 1710 (1405 to 2015), n = 48 | |||||||
| Year 1 | 2118 (1691 to 2546), n = 19 | 2220 (1590 to 2850), n = 17 | 408 (−44 to 860) | 0.08 | 510 (−148 to 1168) | 0.13 | −102 (−893 to 689) | 0.80 | |
| Year 2 | 2678 (1883 to 3466), n = 11 | 2125 (1569 to 2682), n = 9 | 968 (134 to 1802) | 0.02 | 415 (−119 to 949) | 0.13 | 553 (−445 to 1550) | 0.28 | |
| CVC Agatstonb,c | Baseline | 1111 (801 to 1421), n = 48 | |||||||
| Year 1 | 1238 (861 to 1614), n = 19 | 1818 (1068 to 2567), n = 17 | 127 (−192 to 446) | 0.43 | 707 (−71 to 1484) | 0.07 | −580 (−1444 to 284) | 0.19 | |
| Year 2 | 1527 (892 to 2162), n = 11 | 1830 (1317 to 2342), n = 9 | 416 (−213 to 1045) | 0.19 | 719 (226 to 1212) | <0.001 | −303 (−1117 to 512) | 0.47 | |
|
CVC volumeb,c |
Baseline | 914 (668 to 1161), n = 48 | |||||||
| Year 1 | 1013 (717 to 1308), n = 19 | 1451 (870 to 2031), n = 17 | 98 (−150 to 347) | 0.44 | 536 (−66 to 1139) | 0.08 | −438 (−1107 to 231) | 0.20 | |
| Year 2 | 1261 (746 to 1776), n = 11 | 1498 (1092 to 1903), n = 9 | 346 (−165 to 857) | 0.18 | 583 (194 to 973) | <0.001 | −237 (−890 to 416) | 0.48 | |
| AACc | Baseline | 9.1 (8.0 to 10.2), n = 43 | |||||||
| Year 1 | 10.2 (8.5 to 11.9), n = 16 | 10.3 (9.0 to 11.6), n = 16 | 1.1 (−0.5 to 2.7) | 0.19 | 1.2 (0.2 to 2.2) | 0.02 | −0.1 (−2.0 to 1.8) | 0.90 | |
| Year 2 | 10.9 (8.4 to 13.3), n = 8 | 10.0 (8.3 to 11.8), n = 8 | 1.8 (−0.7 to 4.2) | 0.16 | 0.9 (−0.7 to 2.6) | 0.27 | 0.8 (−2.1 to 3.8) | 0.58 | |
| 24-h Sys BP (mmHg) | Baseline | 135 (129 to 141), n = 45 | |||||||
| Year 1 | 131 (122 to 140), n = 17 | 137 (127 to 146), n = 15 | −4 (−13 to 5) | 0.36 | 1 (−8 to 11) | 0.77 | −6 (−18 to 7) | 0.37 | |
| Year 2 | 136 (125 to 147), n = 10 | 135 (122 to 147), n = 8 | 1 (−11 to 12) | 0.92 | −1 (−13 to 12) | 0.91 | 1 (−15 to 17) | 0.88 | |
| 24-h Dia BP (mmHg) | Baseline | 81 (77 to 85), n = 45 | |||||||
| Year 1 | 79 (73 to 85), n = 17 | 81 (75 to 87), n = 15 | −2 (−8 to 4) | 0.48 | 0 (−6 to 6) | 1.00 | −2 (−10 to 6) | 0.60 | |
| Year 2 | 82 (75 to 89), n = 10 | 78 (70 to 86), n = 8 | 1 (−6 to 8) | 0.77 | −3 (−11 to 5) | 0.41 | 4 (−6 to 15) | 0.41 | |
|
24-h PP (mmHg) |
Baseline | 54 (51 to 58), n = 45 | |||||||
| Year 1 | 52 (47 to 57), n = 17 | 56 (50 to 61), n = 15 | −2 (−6 to 3) | 0.41 | 1 (−3 to 6) | 0.57 | −3 (−10 to 3) | 0.31 | |
| Year 2 | 53 (47 to 59), n = 10 | 57 (50 to 63), n = 8 | −1 (−7 to 5) | 0.76 | 3 (−4 to 9) | 0.41 | −4 (−12 to 5) | 0.40 | |
CAC scores include the left anterior descending coronary artery, the right coronary artery and the left circumflex coronary artery.
CVC scores include the aortic and mitral valves.
Estimated using non-parametric bootstrapping with 1000 replications.
Sys, systolic; Dia, diastolic; PP, pulse pressure.
CAC, CVC and AAC
Individual CAC Agatston, CVC Agatston and AAC scores are shown in Supplementary data, Figure S6 (Table 3).
CAC Agatston and volume scores increased in both groups over the 2-year intervention period, but the increments at Year 2 in the vitamin K supplemented group were the only significant within-group changes. In the between-group comparisons, we observed no significant differences.
For CVC Agatston and volume scores, a progressive increase was seen over the 2-year intervention period in both groups, significantly so at Year 2 in the placebo group only. Again, there were no significant differences in the between-group comparisons.
AAC scores also increased with time in both groups. The within-group increment at Year 2 was significant in the placebo group, but in between-group comparisons, differences were far from significant.
Adherence and adverse events
In the vitamin K group, mean adherence was 99% ranging from 97% to 103% at Year 1 (a few individuals had ingested ˃1 tablet daily on average). Completers of Year 2 had a 2-year mean adherence of 99% ranging from 96% to 100%. In the placebo group, the corresponding adherence at Year 1 was 91% ranging from 60% to 100%, and at Year 2 92% ranging from 93% to 100%.
We observed no significant between-group differences in adverse events over the 2-year intervention period. Five participants in the vitamin K group versus four in the placebo group experienced a thromboembolic event, and four participants died versus six in the placebo group.
DISCUSSION
The RenaKvit study was a 2-year randomized, double-blind, placebo-controlled trial investigating the effect of vitamin K supplementation on arterial calcification in dialysis patients. Vitamin K supplementation (MK-7 360 µg/day) caused marked improvements in vitamin K status as assessed from blood concentrations of MK-7, dp-ucMGP and PIVKA-II. Nonetheless, arterial calcification assessed from cfPWV, CAC, CVC and AAC scores was not significantly affected compared with placebo treatment. In both groups, arterial calcification actually progressed over the 2-year intervention period.
A few earlier trials have consistently reported a decrease in plasma dp-ucMGP with MK-7 supplementation in dialysis patients [20, 21, 29]. These studies reported a dose-dependent 17–86% reduction in dp-ucMGP after only 4–8 weeks of MK-7 supplementation in daily dosages of 45–463 µg. In our study, vitamin K supplementation led to 40–45% lower dp-ucMGP concentrations at Years 1 and 2 compared with placebo. Our data correspond quite closely to the results obtained in the shorter-termed studies by Caluwé et al. [21] and Westenfeld et al. [20], and illustrate that MK-7 effects on plasma dp-ucMGP concentrations are maintained over longer terms with continuing MK-7 supplementation. Our long-term follow-up further demonstrated that the decline in dp-ucMGP from baseline observed at Year 1 was followed by an increase during Year 2 despite continued vitamin K supplementation, so that dp-ucMGP at baseline and Year 2 did not differ in the vitamin K supplemented group. This observation shows that vitamin K supplementation markedly reduces dp-ucMGP levels, but cannot inhibit a subsequent gradual rise in dp-ucMGP over years. It should also be noted that vitamin K supplementation at no stage normalized dp-ucMGP concentrations in our study. The reference interval for dp-ucMGP in healthy individuals is <532 pmol/L [30]. At Year 1, our vitamin K supplemented participants had a mean dp-ucMGP of 1290 pmol/L.
Some earlier trials in non-dialysis patients indicated that vitamin K supplementation might have a beneficial effect on cfPWV and arterial calcification [31–33]. However, other studies were negative [34, 35], and most recently, Witham et al. reported an absence of vitamin K2 effect on cfPWV and AAC in a 1-year double-blind placebo-controlled trial of patients with CKD Stages 3b–4 [36]. Only two published studies investigated the effect of MK-7 supplementation on arterial calcification in dialysis patients. Oikonomaki et al. randomized 102 haemodialysis patients to ±MK-7 supplementation (200 µg daily) for 1 year in an open-label trial published in 2019 [19]. Fifty-two patients were available for analysis (drop-out rate 51%). Arterial calcification assessed from abdominal aortic Agatston scores did not differ between groups despite a 50% decrease in ucMGP among MK-7 supplemented participants. In 2020, De Vriese et al. published their study of 132 haemodialysis patients randomized to either vitamin K-antagonist, rivaroxaban or rivaroxaban +MK-7 in an open-label, non-placebo-controlled study [18]. After 18 months, 77 participants remained in the study reflecting a drop-out rate of 42%, primarily due to deaths. cfPWV and calcifications scores were not significantly affected. Accordingly, the authors concluded that MK-7 had no significant favourable effect on arterial calcification progression. Our present results are fully in line with those of Oikonomaki and De Vriese. All three studies found arterial calcification progression in dialysis patients despite high-dosed MK-7 supplementation for 1–2 years.
As of December 2020, to our knowledge this study is the first randomized, double-blind, placebo-controlled trial to report on the effects of vitamin K supplementation on arterial calcification in dialysis patients. As a strength, we excluded patients with cardiac arrhythmias, bilateral arteriovenous fistulas of the upper extremities, severe aortic valve stenosis and major amputations of lower extremities in order to obtain reliable cfPWV measurements—our primary outcome—according to current method guidelines [22, 37]. The validity of our findings was supported by the demonstration of a high degree of study adherence, not only from tablet counting, but also from actual measurements of MK-7 serum concentrations. Also, our limited 1-year drop-out rate of 23% was close to the expected 20% drop-out rate on which we based our power calculation, which may be considered a strength. The number of participants with available cfPWV measurements at Year 1 was sufficient to give the study the planned power of 80% to detect changes of 1 m/s in cfPWV. A change in cfPWV of 1 m/s may translate into a clinically significant 15% change in cardiovascular risk, and therefore it was important for us to ensure that our study had the power to detect a treatment effect of that size [38]. Also noteworthy is the fact that our study had sufficient power to demonstrate significant increases in calcification scores in both the vitamin K and the placebo group.
In the interpretation of our study, it should be noted that our participants belonged to the more healthy part of a dialysis population due to our study exclusion criteria. Thus, our findings might not apply to less healthy dialysis patients. However, we consider it unlikely that they would respond more favourably to vitamin K supplementation than our participants. The study duration of 2 years might be considered too short and a study weakness, but the few earlier trials in advanced CKD patients in this field had shorter observation periods of 12–18 months [18, 19, 36]. Furthermore, it should be taken into account that arterial calcification effects of vitamin K supplementation should probably appear within a year or so if they are to have any chance to impact the survival of dialysis patients, who are known to have a high mortality rate. Our study comprised both haemodialysis and peritoneal dialysis patients. In the hypothetical case that the arterial calcification process responds differently on vitamin K supplementation depending on dialysis modality, the inclusion of patients on both modalities might weaken the power to detect any effects. However, we consider it less likely that this could be the case. Finally, it should be noted that we did not use very low CAC Agatston scores (<30) as a study exclusion criterion. The seminal study by Block et al. demonstrated that individuals on haemodialysis with very low CAC Agatston scores were unlikely to have arterial calcification progression over 18 months [39]. In our study, a small minority of patients (around 10%) had very low CAC Agatston scores at baseline, and they did indeed have no or very small changes in CAC scores over time. It is evident that the inclusion of these patients may have reduced our study power modestly regarding CAC scoring, but our data demonstrate that it did not prevent us from demonstrating significant increments in CAC Agatston score within the vitamin K-supplemented group.
Despite lege artis methodology with respect to study design, study execution and arterial calcification assessments, we did not find any signs of vitamin K supplementation having an essential role in preventing the progression of arterial calcification in dialysis patients. However, due to the limited number of study participants, a minor, but still relevant effect of vitamin K on arterial calcification in dialysis patients cannot be excluded. Larger studies of vitamin K supplementation in dialysis patients are underway, and their results are eagerly awaited.
SUPPLEMENTARY DATA
Supplementary data are available at ckj online.
Supplementary Material
ACKNOWLEDGEMENTS
The authors are grateful to Jane Hansen Damm and staff, Department of Clinical Biochemistry, Zealand University Hospital, Roskilde; Maha Sakr Alameddine, Biochemistry and Immunology, Hospital Lillebælt, Vejle; Karin Hansen and Lea Højgaard Mosa, Department of Renal Medicine, Aarhus University Hospital; Charlotte Mose Skov and Kirsten Hald Holdensen, Department of Nephrology, Aalborg University Hospital, Aalborg; and the staff at the radiology departments at Zealand University Hospital, Roskilde, Aarhus University Hospital and Aalborg University Hospital for their contributions to the study. The authors also want to thank nurses and administrative staff of involved dialysis departments for their support and help. Finally, we thank the dialysis patients for their study participation.
FUNDING
The study was funded by The Danish Society of Nephrology, The Danish Kidney Association, The Region Zealand Research Foundation, Kappa Bioscience AS, Aase and Ejnar Danielsen’s Foundation, Helen and Ejnar Bjørnow’s Foundation, The Beckett Foundation and Karen Elise Jensen’s Foundation.
AUTHORS’ CONTRIBUTIONS
K.L.-S., M.F.-M., D.H., N.E.F. and P.M. designed the study. K.L.-S., C.S., J.D.J., K.D.K. and C.D.P. collected the clinical data. A.S., C.L.B., J.S.M. and N.R.J. were responsible for the specialized biochemical analyses. J.B.F., H.E., C.T.L. and H.S. led the radiological investigations, and the images were analysed by H.E., C.T.L. and H.S. K.L.-S. and M.F.-M. analysed the cfPWV measurements. K.L.-S. and I.P. did the statistical analyses and drafted all tables and figures. K.L.-S. and P.M. drafted the article. All authors revised the article and approved the final version.
CONFLICT OF INTEREST STATEMENT
K.L.-S.'s salary was partially funded by Kappa Bioscience AS, the Danish Society of Nephrology and the Karen Elise Jensen’s Foundation. All other authors have nothing to disclose. Kappa Bioscience AS and Orkla Care AS donated study tablets, but had no further part in the trial, the data analyses, the interpretation and the presentation of results. The results presented in this article have not been published previously in whole or part, not even in abstract format.
DATA AVAILABILITY STATEMENT
The data that support the findings of this study are available from the first author, K.L.-S (karinschousboe@dadlnet.dk), upon reasonable request.
REFERENCES
- 1.Chen J, Budoff MJ, Reilly MP. et al. ; for the CRIC Investigators. Coronary artery calcification and risk of cardiovascular disease and death among patients with chronic kidney disease. JAMA Cardiol 2017; 2: 635–643 [DOI] [PMC free article] [PubMed] [Google Scholar]
- 2.Sarnak MJ, Amann K, Bangalore S. et al. Chronic kidney disease and coronary artery disease: JACC state-of-the-art review. J Am Coll Cardiol 2019; 74: 1823–1838 [DOI] [PubMed] [Google Scholar]
- 3.Go AS, Chertow GM, Fan D. et al. Chronic kidney disease and the risks of death, cardiovascular events, and hospitalization. N Engl J Med 2004; 351: 1296–1305 [DOI] [PubMed] [Google Scholar]
- 4.Ortiz A, Covic A, Fliser D. et al. Epidemiology, contributors to, and clinical trials of mortality risk in chronic kidney failure. Lancet 2014; 383: 1831–1843 [DOI] [PubMed] [Google Scholar]
- 5.Foley RN, Parfrey PS, Sarnak MJ.. Epidemiology of cardiovascular disease in chronic renal disease. J Am Soc Nephrol 1998; 9: S16–S23 [PubMed] [Google Scholar]
- 6.Blacher J, Safar ME, Guerin AP. et al. Aortic pulse wave velocity index and mortality in end-stage renal disease. Kidney Int 2003; 63: 1852–1860 [DOI] [PubMed] [Google Scholar]
- 7.London GM, Guerin AP, Marchais SJ. et al. Cardiac and arterial interactions in end-stage renal disease. Kidney Int 1996; 50: 600–608 [DOI] [PubMed] [Google Scholar]
- 8.Guerin AP, Pannier B, Marchais SJ. et al. Cardiovascular disease in the dialysis population: prognostic significance of arterial disorders. Curr Opin Nephrol Hypertens 2006; 15: 105–110 [DOI] [PubMed] [Google Scholar]
- 9.Blacher J, Safar ME, Pannier B. et al. Prognostic significance of arterial stiffness measurements in end-stage renal disease patients. Curr Opin Nephrol Hypertens 2002; 11: 629–634 [DOI] [PubMed] [Google Scholar]
- 10.Luo G, Ducy P, McKee MD. et al. Spontaneous calcification of arteries and cartilage in mice lacking matrix GLA protein. Nature 1997; 386: 78–81 [DOI] [PubMed] [Google Scholar]
- 11.Proudfoot D, Shanahan CM.. Molecular mechanisms mediating vascular calcification: role of matrix Gla protein. Nephrology (Carlton )2006; 11: 455–461 [DOI] [PubMed] [Google Scholar]
- 12.Delanaye P, Krzesinski JM, Warling X. et al. Dephosphorylated-uncarboxylated Matrix Gla protein concentration is predictive of vitamin K status and is correlated with vascular calcification in a cohort of hemodialysis patients. BMC Nephrol 2014; 15: 145. [DOI] [PMC free article] [PubMed] [Google Scholar]
- 13.Schurgers LJ, Barreto DV, Barreto FC. et al. The circulating inactive form of matrix gla protein is a surrogate marker for vascular calcification in chronic kidney disease: a preliminary report. Clin J Am Soc Nephrol 2010; 5: 568–575 [DOI] [PMC free article] [PubMed] [Google Scholar]
- 14.Keyzer CA, Vermeer C, Joosten MM. et al. Vitamin K status and mortality after kidney transplantation: a cohort study. Am J Kidney Dis 2015; 65: 474–483 [DOI] [PubMed] [Google Scholar]
- 15.Thamratnopkoon S, Susantitaphong P, Tumkosit M. et al. Correlations of plasma desphosphorylated uncarboxylated matrix gla protein with vascular calcification and vascular stiffness in chronic kidney disease. Nephron 2017; 135: 167–172 [DOI] [PubMed] [Google Scholar]
- 16.Fain ME, Kapuku GK, Paulson WD. et al. Inactive matrix gla protein, arterial stiffness, and endothelial function in African American hemodialysis patients. Am J Hypertens 2018; 31: 735–741 [DOI] [PubMed] [Google Scholar]
- 17.Caluwe R, Verbeke F, De Vriese AS.. Evaluation of vitamin K status and rationale for vitamin K supplementation in dialysis patients. Nephrol Dial Transplant 2020; 35: 23–33 [DOI] [PubMed] [Google Scholar]
- 18.De Vriese AS, Caluwe R, Pyfferoen L. et al. Multicenter randomized controlled trial of vitamin K antagonist replacement by rivaroxaban with or without vitamin K2 in hemodialysis patients with atrial fibrillation: the Valkyrie study. J Am Soc Nephrol 2020; 31: 186–196 [DOI] [PMC free article] [PubMed] [Google Scholar]
- 19.Oikonomaki T, Papasotiriou M, Ntrinias T. et al. The effect of vitamin K2 supplementation on vascular calcification in haemodialysis patients: a 1-year follow-up randomized trial. Int Urol Nephrol 2019; 51: 2037–2044 [DOI] [PubMed] [Google Scholar]
- 20.Westenfeld R, Krueger T, Schlieper G. et al. Effect of vitamin K2 supplementation on functional vitamin K deficiency in hemodialysis patients: a randomized trial. Am J Kidney Dis 2012; 59: 186–195 [DOI] [PubMed] [Google Scholar]
- 21.Caluwé R, Vandecasteele S, Van Vlem B. et al. Vitamin K2 supplementation in haemodialysis patients: a randomized dose-finding study. Nephrol Dial Transplant 2014; 29: 1385–1390 [DOI] [PubMed] [Google Scholar]
- 22.Van Bortel LM, Laurent S, Boutouyrie P et al.; European Network for Noninvasive Investigation of Large Arteries. Expert consensus document on the measurement of aortic stiffness in daily practice using carotid-femoral pulse wave velocity. J Hypertens 2012; 30: 445–448 [DOI] [PubMed] [Google Scholar]
- 23.Agatston AS, Janowitz WR, Hildner FJ. et al. Quantification of coronary artery calcium using ultrafast computed tomography. J Am Coll Cardiol 1990; 15: 827–832 [DOI] [PubMed] [Google Scholar]
- 24.Kauppila LI, Polak JF, Cupples LA. et al. New indices to classify location, severity and progression of calcific lesions in the abdominal aorta: a 25-year follow-up study. Atherosclerosis 1997; 132: 245–250 [DOI] [PubMed] [Google Scholar]
- 25.O’Brien E, Parati G, Stergiou G.. Ambulatory blood pressure measurement: what is the international consensus? Hypertension 2013; 62: 988–994 [DOI] [PubMed] [Google Scholar]
- 26.Boegh Andersen I, Lohman Brasen C, Skov Madsen J. et al. Quantitation of vitamin K1 in serum using online SPE-LC-MS/MS and the challenges of working with vitamin K. J Chromatogr B Analyt Technol Biomed Life Sci 2019; 1117: 41–48 [DOI] [PubMed] [Google Scholar]
- 27.Frimodt-Moller M, Nielsen AH, Kamper AL. et al. Reproducibility of pulse-wave analysis and pulse-wave velocity determination in chronic kidney disease. Nephrol Dial Transplant 2008; 23: 594–600 [DOI] [PubMed] [Google Scholar]
- 28.Twisk J, Bosman L, Hoekstra T. et al. Different ways to estimate treatment effects in randomised controlled trials. Contemp Clin Trials Commun 2018; 10: 80–85 [DOI] [PMC free article] [PubMed] [Google Scholar]
- 29.Aoun M, Makki M, Azar H. et al. High dephosphorylated-uncarboxylated MGP in hemodialysis patients: risk factors and response to vitamin K2, A pre-post intervention clinical trial. BMC Nephrol 2017; 18: 191. [DOI] [PMC free article] [PubMed] [Google Scholar]
- 30.Griffin TP, Islam MN, Wall D. et al. Plasma dephosphorylated-uncarboxylated Matrix Gla-Protein (dp-ucMGP): reference intervals in Caucasian adults and diabetic kidney disease biomarker potential. Sci Rep 2019; 9: 18452. [DOI] [PMC free article] [PubMed] [Google Scholar]
- 31.Shea MK, O’Donnell CJ, Hoffmann U. et al. Vitamin K supplementation and progression of coronary artery calcium in older men and women. Am J Clin Nutr 2009; 89: 1799–1807 [DOI] [PMC free article] [PubMed] [Google Scholar]
- 32.Knapen MH, Braam LA, Drummen NE. et al. Menaquinone-7 supplementation improves arterial stiffness in healthy postmenopausal women. A double-blind randomised clinical trial. Thromb Haemost 2015; 113: 1135–1144 [DOI] [PubMed] [Google Scholar]
- 33.Brandenburg VM, Reinartz S, Kaesler N. et al. Slower progress of aortic valve calcification with vitamin K supplementation: results from a prospective interventional proof-of-concept study. Circulation 2017; 135: 2081–2083 [DOI] [PubMed] [Google Scholar]
- 34.Shea MK, O’Donnell CJ, Vermeer C. et al. Circulating uncarboxylated matrix gla protein is associated with vitamin K nutritional status, but not coronary artery calcium, in older adults. J Nutr 2011; 141: 1529–1534 [DOI] [PMC free article] [PubMed] [Google Scholar]
- 35.Fulton RL, McMurdo ME, Hill A. et al. Effect of vitamin K on vascular health and physical function in older people with vascular disease–A randomised controlled trial. J Nutr Health Aging 2016; 20: 325–333 [DOI] [PubMed] [Google Scholar]
- 36.Witham MD, Lees JS, White M. et al. Vitamin K supplementation to improve vascular stiffness in CKD: the K4Kidneys randomized controlled trial. J Am Soc Nephrol 2020; 31: 2434–2445 [DOI] [PMC free article] [PubMed] [Google Scholar]
- 37.Atcor Medical. Operators Manual SphygmoCor XCEL System v1.https://atcormedical.com/technology/sphygmocor/ (23 April 2020, date last accessed).
- 38.Vlachopoulos C, Aznaouridis K, Stefanadis C.. Prediction of cardiovascular events and all-cause mortality with arterial stiffness: a systematic review and meta-analysis. J Am Coll Cardiol 2010; 55: 1318–1327 [DOI] [PubMed] [Google Scholar]
- 39.Block GA, Spiegel DM, Ehrlich J. et al. Effects of sevelamer and calcium on coronary artery calcification in patients new to hemodialysis. Kidney Int 2005; 68: 1815–1824 [DOI] [PubMed] [Google Scholar]
Associated Data
This section collects any data citations, data availability statements, or supplementary materials included in this article.
Supplementary Materials
Data Availability Statement
The data that support the findings of this study are available from the first author, K.L.-S (karinschousboe@dadlnet.dk), upon reasonable request.