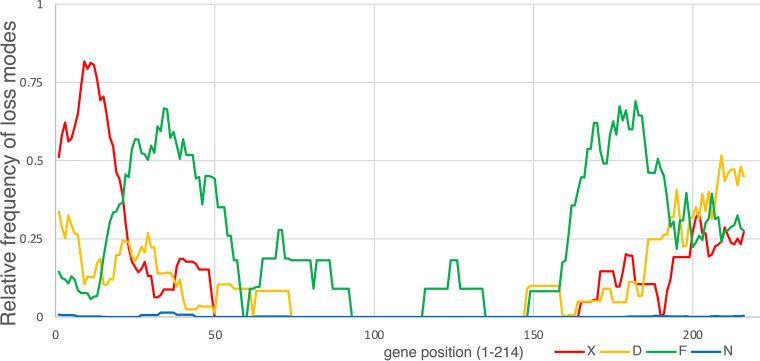
FIG 8.
Distribution of different gene disruption events along the ORPV genomes. The distributions of relative frequencies of 4 types of gene disruption events along the ORPV genomes are shown. The events are color-coded as shown beneath the plot: D, decaying (deletion); F, frameshift; N, in-frame stop nonsense mutation; X, complete absence (large deletion). Relative frequencies of disruption events in each gene were averaged in an 11-gene sliding windows.

