

ABSTRACT
The kinetics of microbial respiration suggests that, if excess organic matter is present, oxygen should fall to nanomolar levels in the range of the Michaelis-Menten constants (Km). Yet even in many biologically productive coastal regions, lowest observed O2 concentrations often remain several orders of magnitude higher than respiratory Km values. We propose the hypoxic barrier hypothesis (HBH) to explain this apparent discrepancy. The HBH postulates that oxidative enzymes involved in organic matter catabolism are kinetically limited by O2 at concentrations far higher than the thresholds for respiration. We found support for the HBH in a meta-analysis of 1,137 O2 Km values reported in the literature: the median value for terminal respiratory oxidases was 350 nM, but for other oxidase types, the median value was 67 μM. The HBH directs our attention to the kinetic properties of an important class of oxygen-dependent reactions that could help explain the trajectories of ocean ecosystems experiencing O2 stress.
KEYWORDS: dissolved organic matter, ocean respiration, oxygen minimum zones, oxygenase Km, ocean respiration, dissolved organic matter
INTRODUCTION
Marine suboxic and anoxic zones are hot spots of microbially mediated biogeochemical transformations that regulate the nitrogen budget and air-sea fluxes of greenhouse gases of the global ocean (1). Because dissolved oxygen (DO) also organizes the structure and dynamics of ocean food webs, understanding the processes that regulate expansion of suboxic and anoxic zones in response to past and current climate changes is a pressing challenge (2). Suboxic and anoxic zones are embedded within broader oxygen minimum zones (OMZ) that comprise some 8% of the surface area of the ocean. While recent advances in nanomolar-scale DO measurement technologies have enabled precise delineation of the presence of suboxia and anoxia (3), we contend that a perplexing yet fundamental question has been overlooked. Given our canonical understanding of microbial respiration kinetics, why are suboxia and anoxia not a much more pervasive feature of the ocean’s low-oxygen zones?
Of biological reactions that consume O2, by far the most important, in terms of mass, is carbon respiration. Michaelis-Menten half-saturation (Km) constants for respiration are typically very low, on the order of a few nanomolar, although higher values have been reported (4) (Fig. 1). Thus, if labile organic carbon, i.e., compounds that readily can be used as a source of electrons for respiration, is delivered in excess to a microbial ecosystem, DO declines at a rate determined by the respiratory capacity of the microorganisms present and the supply of organic matter. Importantly, the minimum DO attainable should reflect the well-described high-affinity, nanomolar-scale Km of microbial respiratory oxidases (5). Other factors that can influence DO in aquatic ecosystems include photosynthesis when light is present; oxygen transport by ocean currents and mixing; diffusion, which can limit respiration, particularly in aggregates of cells; impacts of low oxygen on grazing metazoa (6), which require higher oxygen concentrations than bacteria; nonrespiratory biochemical reactions that consume oxygen; and abiotic reactions that consume oxygen (7). Nonetheless, DOM formation and oxidation are the mechanistic centerpiece in our fundamental understanding of microbial-scale processes leading to low-oxygen states and predictions of global ocean oxygen dynamics.
FIG 1.
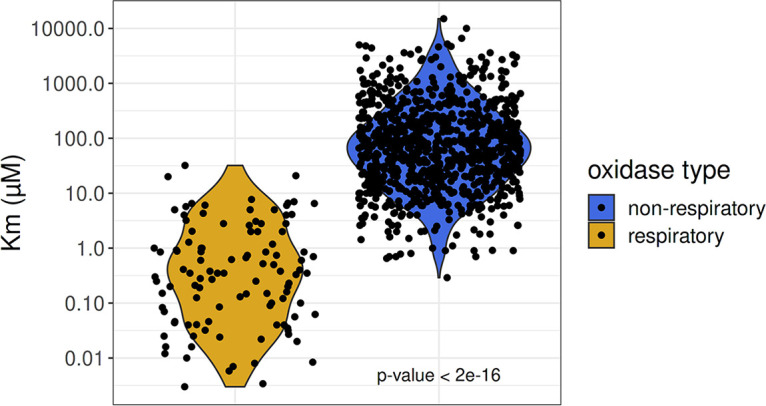
Km values are significantly smaller in respiratory oxidases compared to other oxygenases. Km DO (dissolved oxygen) values for respiratory oxidases (yellow; n = 109) and other oxygenases (blue; n = 890) are depicted on a log10 scale. The relatively high (e.g., 101 μM) Km values reported for oxidase enzymes indicate a potential bottleneck in the supply of electrons from organic matter to respiration. The reported P value is from a t test using the Satterthwaite approximations to degrees of freedom of a linear mixed model fit by maximum likelihood. Data and citations can be found in Table S1 in the supplemental material.
Literature reports of Km values for oxygenase enzymes and terminal respiratory oxidases used to construct Fig. 1 and Fig. S1. Download Table S1, XLSX file, 0.10 MB (98.1KB, xlsx) .
Copyright © 2021 Giovannoni et al.
This content is distributed under the terms of the Creative Commons Attribution 4.0 International license.
Eastern boundary upwelling systems (EBUS) represent one of the ocean’s most productive biomes. In these coastal ecosystems, oxygen-poor subsurface waters uplifted from the vertical periphery or core of open-ocean OMZs receive elevated organic carbon inputs from surface phytoplankton blooms. Figure 2 shows relative water volumes for DO concentrations across these systems. Of the ocean’s four major EBUS, only the Peru-Chile current system in the Eastern Tropical Pacific Ocean persistently exhibits DO-deficient states in continental shelf waters. For both Pacific EBUS, there is an accumulation of water volumes below 100 μM but a sharp drop-off in volume of waters that reach suboxic (<5 μM) or anoxic (∼0 μM) states in the upper ocean (0 to 400 m), including continental shelf waters where remineralization and oxygen loss are most active (Fig. 2b). The pattern is striking; despite the nanomolar-scale of respiratory Km values, respiration in productive EBUS is able to draw down DO to hypoxic levels but rarely is able to consume the last 10 to 60 μM DO. While the depth of OMZs extends below 400 m, the failure of suboxic and anoxic volumes to accumulate despite the presence of large volumes of hypoxic water persists when we expand our sampling to 1,000 m (Fig. 2d).
FIG 2.
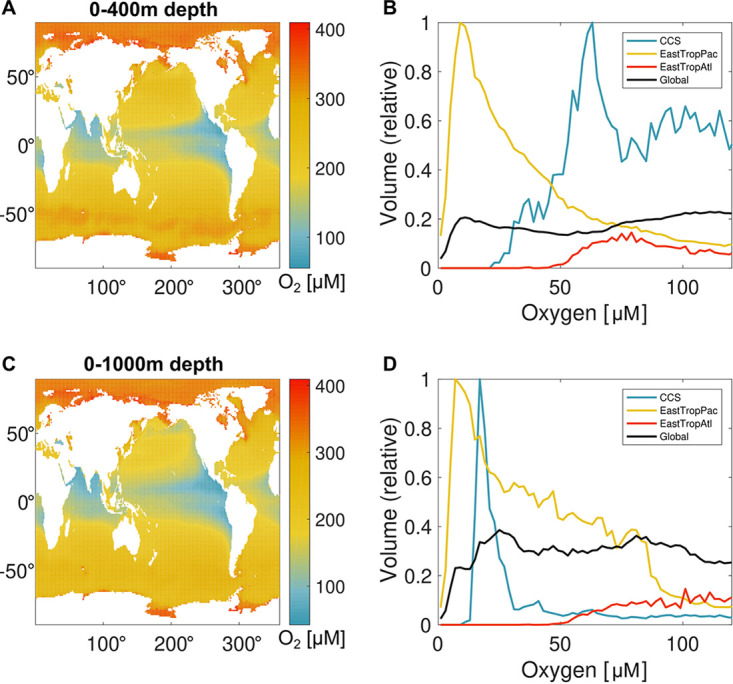
Climatological distribution and volumetric census of DO. Observation-based maps of DO averaged over the upper (a) 0-400 m and (c) 0-1000 m of the global ocean reflect the combination of temperature-dependent gas saturation in surface water and the integrated consumption of DO during respiration of organic matter over decadal to centennial time scales of ocean circulation at subsurface depths. For each depth range, the volume of water at each DO level (panel b and d) is summed globally and for major EBUS regions: the California Current System (CCS), Eastern Tropical Pacific (EastTropPac), and Eastern Tropical Atlantic (EastTropAtl), which all exhibit a peak at low DO, albeit at different concentrations.
To explain the observations in Fig. 2, we propose the hypoxic barrier hypothesis (HBH), which states that dissolved O2 kinetically limits the activity of oxygenase enzymes involved in the breakdown of organic matter in the range of oxygenase Km values (median value, 67 μM) causing a decline in DOM oxidation rates in ecosystems experiencing oxygen stress and an accumulation of DOM that is catabolized by pathways that require oxygenases. The HBH ascribes the decline in O2 frequency distributions of suboxic and anoxic waters (Fig. 2 and Fig. S2 in the supplemental material) to fundamental biochemical properties of cells, particularly the mechanisms by which oxidative enzymes cleave semilabile organic matter, making it accessible to further oxidation.
Cumulative frequency distribution of DO observations from continental shelf depths (5 to 400 m, i.e., above the OMZ) for the northern (red line), central (light blue line), and southern (dark blue line) California Current System (CCS). Note the rarity of DO observations of <25 μM and an apparent hinge in the frequency of observations as DO increases beyond that concentration. Download FIG S2, TIF file, 0.5 MB (499.2KB, tif) .
Copyright © 2021 Giovannoni et al.
This content is distributed under the terms of the Creative Commons Attribution 4.0 International license.
Oxygen depletion by respiration in aquatic systems.
How far can respiring marine bacteria lower oxygen concentrations when they are provided with an ample supply of reductant for respiration, as would be expected for plankton in the presence of an excess of labile organic carbon? The Pasteur point is an influential concept based on the observation that facultative anaerobes switch to fermentation at ca. 2.2 μM O2, approximately an order of magnitude below the average Km for oxygenases (Fig. 1), steep declines in suboxic and anoxic water volumes in EBUS (Fig. 2), and the ca. 25-μM inflection in cumulative frequency distribution of DO observations recorded in the California current system (CCS) (Fig. S2). Newer information suggests that the limits of bacterial respiration are in the nanomolar range. This is consistent with the observation of high-affinity cytochromes that exhibit O2 Km between 3 and 200 nM (8) (Fig. 1). Higher O2 Michaelis constants have sometimes been reported for marine bacteria, but it has been suggested that higher values obtained with whole cells reflect diffusion limitation, which can be expected to inflate apparent O2 Michaelis constants in proportion to cell sizes and respiration rates. Stolper et al. showed that Escherichia coli cells could grow at less than 3 nM O2, a sufficiently low concentration to limit growth by diffusion but high enough to sustain growth through O2 respiration (8). Our meta-analysis indicates that cells grown on highly labile carbon compounds, such as glucose, display whole-cell O2 Km values that extend to nanomolar O2 concentrations. We conclude that a substantial background of observations and theory supports the conclusion that the respiration rate of chemoheterotrophic cells should not be limited by O2 at concentrations found in ocean hypoxic zones or the Pasteur point at ca. 2.2 μM.
The accumulation of hypoxic and scarcity of suboxic or anoxic volumes in the ocean nonetheless suggest that negative feedbacks between oxygen decline and respiration may be at play. Direct measurements of microbial O2 Km in natural systems are rare, but available evidence points to Km values far higher than the nanomolar values reported from laboratory cultures with labile carbon sources. Working in the Arabian Sea OMZ, Keil et al. (9) observed an apparent Km of 20 μM O2 for microbial community respiration. In the Nambian and Peruvian OMZ, Kalvelage et al. (10) reported a linear decline in respiration rate between 20 and 0 μM O2. In the Chesapeake Bay, a hypoxia-prone system, microbial respiration rates saturate at O2 above 25 μM (11), a pattern that we have similarly found for the CCS OMZ (Fig. S3). Holtappels et al. (12) further reported linear declines in respiration rates between 14 and 1 μM O2 in waters collected from a fjord in Denmark. These results are surprising because researchers using the same methods have also found many instances of nM Km values for microbial respiration. This suggests a bimodal distribution of O2 Km values that differ by upwards of 3 orders of magnitude. Telescoping out further, global models of ocean O2 and carbon export converge on Km values of between 4 and 20 μM O2 in order to optimize fit between model and observations (13, 14). What accounts for the disparity between accumulation of hypoxic water volumes, the micromolar-scale Kms reported from natural systems and used to fit models and nanomolar-scale Kms predicted by respiratory oxidases?
Examples of respiration rates from field collected samples that exhibited nonsaturating dynamics at tens of micromolar (O2). In each instance, respiration rates were assayed in samples where O2 was manipulated independently. Data from the CCS were measured via O2 optode equipped glass bottles from water samples collected within the OMZ. Oxygen was increased by allowing air to be momentarily entrained as bottles were filled. Download FIG S3, TIF file, 0.4 MB (451.9KB, tif) .
Copyright © 2021 Giovannoni et al.
This content is distributed under the terms of the Creative Commons Attribution 4.0 International license.
Biochemistry offers a mechanistic explanation for this apparent disparity. Evidence in the scientific literature suggests that microbial respiration of some types of organic matter slows when oxygen concentrations fall low enough to inhibit catabolic oxygenase enzymes: Kroonman et al. (15), studying 3-chlorobenzoate degradation by the bacterium Alcaligenes, reported two Km values for O2 uptake. They attributed the lower value (65 nM) to respiration and the higher value (7 to 17 μM) to the activity of dioxygenases. Leahy and Olsen (16), studying toluene degradation by Pseudomonads, also reported biphasic kinetics for toluene catabolism as a function of oxygen concentration. The slope of the oxygen response declined with an inflection at 20 to 30 μM O2. In both of these cases, the behavior of the cultured cells oxidizing recalcitrant compounds is remarkably similar to the generalized behavior of ocean ecosystems approaching hypoxia.
To further explore the distribution of O2 Km values among biological reactions, we conducted a meta-analysis of published data, shown in Fig. 1, Fig. S1A, and Table S1. For O2 Km values reported in the literature, the median value for terminal respiratory oxidases was 350 nM, but for other oxidase types, the median value was 67 μM. The difference of ∼100-fold in median values was supported by a P value of <2e−16 in a t test of the linear mixed-effect model coefficient comparing the log-transformed O2 Km values (17). The bimodal distribution of O2 Km observed at the enzyme scale is also repeated in whole-cell studies. Cells that are grown on more complex organic carbon sources have a median respiratory Km value of 20 μM, while cells grown on highly labile organic carbon such as glucose have median Km of 690 nM (Fig. S1B).
Oxidase density plot. This plot illustrates the distribution of oxygenase Km values reported in the literature for respiratory and nonrespiratory oxidases (A) compared to whole-cell assays, including labile and semilabile carbon sources (B). Download FIG S1, TIF file, 0.5 MB (516.3KB, tif) .
Copyright © 2021 Giovannoni et al.
This content is distributed under the terms of the Creative Commons Attribution 4.0 International license.
Many enzymes that catalyze the biological breakdown of organic matter use oxygen as a substrate, yielding partially oxidized products that are metabolized further through catabolic pathways. These enzymes are often classified as either monooxygenases (mixed-function oxidases) or dioxygenases. Enzymes in both families evolved to use O2 as a substrate, but monooxygenases incorporate a single oxygen atom into the substrate, reducing the second atom to water, whereas dioxygenases typically add both atoms of the reacting O2 to the product. A geochemically important example of a monooxygenase is the heme-dependent Mn peroxidase that catalyzes oxidation of lignin, a phenolic oligomer. Fungal ligninases belong in the heme-dependent peroxidase superfamily (18). Ligninases evolved in the Paleozoic era, and it has been postulated that their origin resulted in widespread biodegradation of wood, the end of the carboniferous period, and rises in global atmospheric CO2 (19). Another superfamily of oxidases, the flavin-dependent monooxygenases, are among the most diverse and prevalent proteins known. They catalyze a wide range of reactions, for example, hydroxylation, Baeyer-Villiger oxidation, oxidative decarboxylation, epoxidation, desulfurization, sulfoxidation, and oxidative denitration (20). Many of the reactions catalyzed by flavin-dependent monooxygenases initiate the catabolism of compounds that are otherwise recalcitrant to oxidation. These enzymes share a mechanism in which reduced flavin reacts with oxygen to produce a flavin C4a-(hydro)peroxide that then reacts with electrophilic or nucleophilic substrates, typically resulting in the consumption of one diatomic oxygen molecule, the addition of an oxygen atom to the substrate, and the release of water. Also important are the dioxygenases, which belong to a different protein family and also feature prominently in DOM degradation, particularly for aromatic compounds. These protein families came to the attention of oceanographers recently when it was discovered that cells of one of the important oceanic bacterial clades, SAR202, harbor expanded clusters of paralogous genes from both of these protein types (21). It has been proposed that these enzymes participate in the oxidation of semilabile organic matter, initiating its breakdown.
The meta-analysis of O2 Km values presented in Fig. 1 suggests that micromolar DO sensitivity is ubiquitous across metabolic processes. Among the “other oxidase” types, we observed no clear trends that associated O2 Km values with protein families sorted by the Clusters of Orthologous Groups (COG) database or other precise functional groups, such as enzyme commission classifications. In contrast, cytochrome respiratory proteins with heme cofactors consistently displayed a much higher affinity for oxygen than other protein types. Phylogenetically, the distribution of O2 Km values included diverse bacteria, including Proteobacteria, Actinobacteria, Firmicutes, and Cyanobacteria, as well as eukaryotic organisms, including fungi, humans, and other chordates. O2 Km values showed a 100-fold difference between respiratory and nonrespiratory oxidases regardless of taxonomic group. We conclude that this pattern is robust to phylogenetic bias in O2 Km value sampling. While our focus in the current work is marine systems, the HBH in principle applies to all ecosystems.
The role of oxidases in organic matter degradation.
Oceanographers classify organic matter by its half-life, frequently using the category “labile dissolved organic matter” (LDOM) to describe dissolved organic matter that is oxidized in minutes to hours, or at most, a few days, while the term “semilabile” (SLDOM), and sometimes “recalcitrant,” is used to refer to dissolved organic matter that persists longer but is eventually oxidized. Here, we introduce a new term, “oxygen-dependent DOM” (ODDOM), to describe DOM that is catabolized via reactions that require the activity of oxygenases and thus are susceptible to inhibition when O2 concentrations reach values in the range of ca. 10 to 100 μM. We’ll confine the discussion to dissolved forms of organic matter, although most organic matter enters ecosystems as particulate organic matter (POM) and is subsequently converted to DOM before being used by microorganisms. Implicit in the above categories is the idea that different kinds of organic matter are accessible to biological oxidation through different mechanisms and at different rates.
The HBH is consistent with the distribution of ocean anoxic zones if one assumes organic matter supplies are uneven. If LDOM is oversupplied relative to oxygen, for example, by high rates of export production in systems with restricted circulation, then the activities of respiratory terminal cytochrome complexes would be expected to readily draw down DO to nanomolar concentrations in accordance with their nanomolar Km values. In natural systems, LDOM is rapidly depleted. As hypothesized, the activities of nonrespiratory oxidases limit the supply of reductant to respiratory oxidases. This acts as a bottleneck that slows the rate of respiration as DO declines. With sufficient time, DO should reach minimum values as expected from nanomolar Km values of respiratory oxidases. Such conditions can be met in the core of OMZs that have been isolated from the atmosphere over decadal to century time scales, and evidence of this can be seen in Fig. 2.
The large disparity in Kms we report between respiratory oxygenases and other oxygenase types has implications for microbial cell evolution and metabolic regulation at the cellular level. Inside of cells’ respiratory oxygenases could outcompete other oxygenases, exacerbating the slowing of some oxygen-dependent cellular processes at low oxygen. To avoid this, cells may have evolved metabolic regulation that avoids such competitive interactions, for example, by shifting to alternate electron acceptors before O2 is depleted (22). This topic, which needs exploration, could help us understand how microbial cells have adapted to suboxic environments, which are far more common in the ocean than anoxic environments.
Testing the HBH.
The HBH sets forth a number of central predictions that are testable by experimentation, observation, and modeling. The impact of biphasic oxygen dependence predicted by the HBH should be manifested as a broad potential for oxygen to limit microbial respiration across hypoxic systems in the range of oxygenase Km values (median value, 67 μM) when LDOM is depleted, but not if excess LDOM is present. To test that prediction, we measured rates of respiration (oxygen uptake) in water samples from the Northern California Current System OMZ, where DO minimum reach only ∼5 μM, well above canonical nanomolar Km for cytochrome oxidases. DO was increased by the simple expedient of allowing air to be momentarily entrained during filling (Fig. S3). In our experiments and other similar experiments, we found, among published work, the addition of DO caused respiration rates to rise relative to controls. This observation could be attributed to the limitation of respiration by diffusion (20), but alternatively, it could result from mechanisms described in the HBH model we propose.
There are many other experimental avenues to testing the HBH that have not been explored. Figure S2 scratches the surface of what could done with field experiments and mesocosms to verify predictions of the HBH. For example, experiments that test the biological availability of DOM at high (e.g., 200 μM) and moderate (e.g., 20 μM) DO could challenge these ideas. Mechanisms invoked by the HBH would lead to changes in the chemical composition of DOM as DO declines: the ratio of LDOM to ODDOM should decrease as DO approaches the Km values of catabolic oxygenase enzymes for O2. Measurements of DOM chemistry could determine whether these changes occur as predicted. ODDOM, a term coined herein to segregate DOM into categories by chemical composition and oxygenase involvement in catabolism, is at present a theoretical concept, albeit grounded in the fundamentals of biochemistry. Although chemical oceanographers do not at present measure ODDOM, in principle methods such as high-resolution nuclear magnetic resonance (NMR), high-performance liquid chromatography (HPLC), and liquid chromatography-tandem mass spectrometry (LC-MS/MS) could be applied for this purpose and could be used to test predictions of the HBH. Omics approaches, including functional genomics, provide an avenue that could be applied in marine systems to measure the expression and activity of oxygenase enzymes involved in ODDOM metabolism and to characterize the responses of plankton cells and communities to suboxia.
The HBH has broader implications that could be explored with global data. It posits that rates of oxygen loss and DOM oxidation slow as DO approaches hypoxia, setting the upper bounds for the size of oceanic anoxic zones and organic carbon pools within. This can be evaluated in detail by modeling studies that test the sensitivity of model data comparisons to changes in assumptions about microbial kinetic constants for oxygen.
Alternatives to the HBH.
While we propose HBH to explain declines in oxygen frequency distributions at unexpected high values (Fig. 2 and Fig. S2) and the rarity of suboxia and anoxia across productive, low-oxygen EBUS, alternate scenarios could explain this phenomenon. For example, consistent barriers to oxygen diffusion to the terminal oxidases of respiratory systems, feedback mechanisms involving the production of sulfides and/or depletion of DO in microhabitats, or oxygen limitation of metazoan grazing could play a role in suppressing respiration at low oxygen concentrations. Alternatively, there may be constraints on supply of organic carbon or positive feedbacks on the resupply of DO by advection or diffusion as DO approaches hypoxia.
Public interest and policy.
The relevance of this issue to public interests in ecosystem management could not be more profound. Ocean deoxygenation, the decline in ocean oxygen inventories, has emerged as a leading pathway for climate change impacts in the sea. This decline has been linked with expansion of hypoxic and anoxic zones. Oxygen-deficient zones are hot spots of biogeochemical transformations whose growth can have profound impacts on marine biodiversity, vertical organic carbon flux, the sustainability of fisheries, and feedbacks that govern ocean nitrogen budgets and flux of radiatively active N2O. The ability to accurately forecast such ecosystem changes is central for informing responsive climate change mitigation and adaptation policies. However, the disagreement between observations and the textbook understanding of microbial respiration raises fundamental questions about the mechanisms that underlie our conceptual and numerical models of the ocean dynamics as climate change intensifies. The HBH offers a testable framework for examining a potentially flawed fundamental principle that governs our thinking about OMZ formation. If this hypothesis is correct, it will open previously overlooked avenues of research at the intersection of oxygenase enzyme evolution, oxygenase-dependent metabolism in microbial communities, and OMZ dynamics.
Conclusion.
If these ideas have the power to even partially explain the kinetics of ocean oxygen depletion, they could contribute to a better understanding of climate change impacts on ocean deoxygenation and DOM chemistry. The data in Fig. 1 show us that the HBH is founded on sound basic principles, but the impact of oxygenase “barrier” we describe is relative to many other processes, mentioned above, that can also slow respiration, most notably diffusion. Sorting out the magnitude of catabolic oxygenase enzyme contributions to DOM oxidation, whether that number be large or small, will help us assess how the trajectories of aquatic systems experiencing oxygen declines are shaped by the fundamental biochemistry described in the HBH.
MATERIALS AND METHODS
Data collection.
Scientific literature was mined for characterized oxygenase enzymes with published Km values for dissolved oxygen for both individual enzyme assays as well as whole-cell assays (Table S1 in the supplemental material). Metadata, including enzyme name and host scientific organism name, were extracted from each article. We used a combination of the BRENDA enzyme database, UniProt protein database, and KEGG database searches to determine putative protein accessions, KEGG ortholog IDs, and EC numbers associated with the published enzyme data. Repeated entries for the same organism-protein pairs were included due to the various testing conditions per study.
Basin and global inventories of DO volumes were compiled from the World Ocean Atlas 2018 (https://www.ncei.noaa.gov/products/world-ocean-atlas). Dissolved oxygen observations (5 to 400 m) from CTD profiles were compiled from Chan et al. 2008, https://www3.mbari.org/bog/, and https://www.calcofi.org/ for the northern (n = 107,032; 1950 to 2006), central (n = 4,372; 1997 to 2013), and southern (n = 4,372; 1997 to 2013) CCS, respectively (23).
Respiration rate experiment.
Water samples were drawn from above and within the CCS OMZ (46°47.56′N, 125°11.83′W, 1,000 m station depth) and filled into 300-ml borosilicate glass biochemical oxygen demand (BOD) bottles that each contained an oxygen optode dot (PreSens Precision Sensing GmbH). On filling, DO was increased in a subset of samples by allowing air to be entrained momentarily in the Niskin outflow tubing. Bottles were incubated in an ∼6°C water bath in the dark. DO change over 48 h was measured through the glass via detection of phase shift luminescence.
Boxplot generation.
Km DO values were split into two primary groups dependent upon general protein function, either respiratory oxidases or nonrespiratory oxidases. Km DO values were also gathered for whole cells, whereby labile and semilabile carbon sources were compared, mirroring the respiratory and nonrespiratory individual enzyme assays. Plots were generated with the grouped Km DO values using R v4.0.2 (24) and ggplot2 (25). A linear mixed-effects model was used to control for repeated O2 Km measurements from the same organism, with the formula log(Km) ≈ oxidase type + (1 | organism). The model was fit using maximum likelihood, and the t test to confirm significant difference of the coefficient for oxidase type was done using Satterthwaite’s method for degrees of freedom (17). Log (natural)-transformed values were used to approximate normality in the data. R code for this analysis can be found at github repo (https://github.com/davised/HBH-2021).
ACKNOWLEDGMENTS
We thank the reviewers, John Coates and Dave Valentine, for their many useful comments. John Coates offered the important insight that intracellular competition with respiratory oxygenases could contribute to the inhibition of nonrespiratory oxygenases. We are grateful to Adam Schneiderhan for his contributions to early discussions.
This work was funded by the National Science Foundation grant DEB-1639033, National Oceanic and Atmospheric Administration (NOAA) grant NA18NOS4780169, a SciRIS award from the Oregon State University College of Science, and a grant from Simons Foundation International.
We declare no real or perceived financial conflicts of interest.
Footnotes
This article is a direct contribution from Stephen J. Giovannoni, a Fellow of the American Academy of Microbiology, who arranged for and secured reviews by John Coates, University of California, Berkeley, and David Valentine, University of California, Santa Barbara.
Citation Giovannoni S, Chan F, Davis E, II, Deutsch C, Wolf S. 2021. Biochemical barriers on the path to ocean anoxia? mBio 12:e01332-21. https://doi.org/10.1128/mBio.01332-21.
Contributor Information
Stephen Giovannoni, Email: steve.giovannoni@oregonstate.edu.
Alan G. Barbour, University of California, Irvine
REFERENCES
- 1.Levin LA. 2018. Manifestation, drivers, and emergence of open ocean deoxygenation. Annu Rev Mar Sci 10:229–260. doi: 10.1146/annurev-marine-121916-063359. [DOI] [PubMed] [Google Scholar]
- 2.Deutsch C, Brix H, Ito T, Frenzel H, Thompson L. 2011. Climate-forced variability of ocean hypoxia. Science 333:336–339. doi: 10.1126/science.1202422. [DOI] [PubMed] [Google Scholar]
- 3.Revsbech NP, Larsen LH, Gundersen J, Dalsgaard T, Ulloa O, Thamdrup B. 2009. Determination of ultra-low oxygen concentrations in oxygen minimum zones by the STOX sensor. Limnol Oceanogr Methods 7:371–381. doi: 10.4319/lom.2009.7.371. [DOI] [Google Scholar]
- 4.Longmuir IS. 1954. Respiration rate of bacteria as a function of oxygen concentration. Biochem J 57:81–87. doi: 10.1042/bj0570081. [DOI] [PMC free article] [PubMed] [Google Scholar]
- 5.Zakem EJ, Follows MJ. 2017. A theoretical basis for a nanomolar critical oxygen concentration. Limnol Oceanogr 62:795–805. doi: 10.1002/lno.10461. [DOI] [Google Scholar]
- 6.Cavan EL, Trimmer M, Shelley F, Sanders R. 2017. Remineralization of particulate organic carbon in an ocean oxygen minimum zone. Nat Commun 8:14847. doi: 10.1038/ncomms14847. [DOI] [PMC free article] [PubMed] [Google Scholar]
- 7.Robinson C. 2019. Microbial respiration, the engine of ocean deoxygenation. Front Mar Sci 5:533. doi: 10.3389/fmars.2018.00533. [DOI] [Google Scholar]
- 8.Stolper DA, Revsbech NP, Canfield DE. 2010. Aerobic growth at nanomolar oxygen concentrations. Proc Natl Acad Sci U S A 107:18755–18760. doi: 10.1073/pnas.1013435107. [DOI] [PMC free article] [PubMed] [Google Scholar]
- 9.Keil RG, Neibauer JA, Biladeau C, van der Elst K, Devol AH. 2016. A multiproxy approach to understanding the “enhanced” flux of organic matter through the oxygen-deficient waters of the Arabian Sea. Biogeosciences 13:2077–2092. doi: 10.5194/bg-13-2077-2016. [DOI] [Google Scholar]
- 10.Kalvelage T, Lavik G, Jensen MM, Revsbech NP, Loscher C, Schunck H, Desai DK, Hauss H, Kiko R, Holtappels M, LaRoche J, Schmitz RA, Graco MI, Kuypers MMM. 2015. Aerobic microbial respiration in oceanic oxygen minimum zones. PLoS One 10:e0133526. doi: 10.1371/journal.pone.0133526. [DOI] [PMC free article] [PubMed] [Google Scholar]
- 11.Sampou P, Kemp WM. 1994. Factors regulating plankton community respiration in Chesapeake Bay. Mar Ecol Prog Ser 110:249–258. doi: 10.3354/meps110249. [DOI] [Google Scholar]
- 12.Holtappels M, Tiano L, Kalvelage T, Lavik G, Revsbech NP, Kuypers MMM. 2014. Aquatic respiration rate measurements at low oxygen concentrations. PLoS One 9:e89369. doi: 10.1371/journal.pone.0089369. [DOI] [PMC free article] [PubMed] [Google Scholar]
- 13.Laufkotter C, John JG, Stock CA, Dunne JP. 2017. Temperature and oxygen dependence of the remineralization of organic matter. Global Biogeochem Cycles 31:1038–1050. doi: 10.1002/2017GB005643. [DOI] [Google Scholar]
- 14.DeVries T, Weber T. 2017. The export and fate of organic matter in the ocean: new constraints from combining satellite and oceanographic tracer observations. Global Biogeochem Cycles 31:535–555. doi: 10.1002/2016GB005551. [DOI] [Google Scholar]
- 15.Krooneman J, Wieringa EB, Moore ER, Gerritse J, Prins RA, Gottschal JC. 1996. Isolation of Alcaligenes sp. strain L6 at low oxygen concentrations and degradation of 3-chlorobenzoate via a pathway not involving (chloro)catechols. Appl Environ Microbiol 62:2427–2434. doi: 10.1128/aem.62.7.2427-2434.1996. [DOI] [PMC free article] [PubMed] [Google Scholar]
- 16.Leahy JG, Johnson GR, Olsen RH. 1997. Cross-regulation of toluene monooxygenases by the transcriptional activators TbmR and TbuT. Appl Environ Microbiol 63:3736–3739. doi: 10.1128/aem.63.9.3736-3739.1997. [DOI] [PMC free article] [PubMed] [Google Scholar]
- 17.Kuznetsova A, Brockhoff PB, Christensen RHB. 2017. lmerTest package: tests in linear mixed effects models. J Stat Softw 82:26. doi: 10.18637/jss.v082.i13. [DOI] [Google Scholar]
- 18.Fox NK, Brenner SE, Chandonia JM. 2014. SCOPe: Structural Classification of Proteins–extended, integrating SCOP and ASTRAL data and classification of new structures. Nucleic Acids Res 42:D304–309. doi: 10.1093/nar/gkt1240. [DOI] [PMC free article] [PubMed] [Google Scholar]
- 19.Floudas D, Binder M, Riley R, Barry K, Blanchette RA, Henrissat B, Martinez AT, Otillar R, Spatafora JW, Yadav JS, Aerts A, Benoit I, Boyd A, Carlson A, Copeland A, Coutinho PM, de Vries RP, Ferreira P, Findley K, Foster B, Gaskell J, Glotzer D, Gorecki P, Heitman J, Hesse C, Hori C, Igarashi K, Jurgens JA, Kallen N, Kersten P, Kohler A, Kues U, Kumar TK, Kuo A, LaButti K, Larrondo LF, Lindquist E, Ling A, Lombard V, Lucas S, Lundell T, Martin R, McLaughlin DJ, Morgenstern I, Morin E, Murat C, Nagy LG, Nolan M, Ohm RA, Patyshakuliyeva A, et al. 2012. The Paleozoic origin of enzymatic lignin decomposition reconstructed from 31 fungal genomes. Science 336:1715–1719. doi: 10.1126/science.1221748. [DOI] [PubMed] [Google Scholar]
- 20.Huijbers MM, Montersino S, Westphal AH, Tischler D, van Berkel WJ. 2014. Flavin dependent monooxygenases. Arch Biochem Biophys 544:2–17. doi: 10.1016/j.abb.2013.12.005. [DOI] [PubMed] [Google Scholar]
- 21.Landry Z, Swan BK, Herndl GJ, Stepanauskas R, Giovannoni SJ. 2017. SAR202 genomes from the dark ocean predict pathways for the oxidation of recalcitrant dissolved organic matter. mBio 8:e00413-17. doi: 10.1128/mBio.00413-17. [DOI] [PMC free article] [PubMed] [Google Scholar]
- 22.Kits KD, Klotz MG, Stein LY. 2015. Methane oxidation coupled to nitrate reduction under hypoxia by the Gammaproteobacterium Methylomonas denitrificans, sp nov type strain FJG1. Environ Microbiol 17:3219–3232. doi: 10.1111/1462-2920.12772. [DOI] [PubMed] [Google Scholar]
- 23.Chan F, Barth JA, Lubchenco J, Kirincich A, Weeks H, Peterson WT, Menge BA. 2008. Emergence of anoxia in the California Current Large Marine Ecosystem. Science 319:920. doi: 10.1126/science.1149016. [DOI] [PubMed] [Google Scholar]
- 24.R Core Team. 2020. R: a language and environment for statistical computing. R Foundation for Statistical Computing, Vienna, Austria. https://www.R-project.org/. [Google Scholar]
- 25.Wickham H. 2016. Ggplot2: Elegant graphics for data analysis. Springer-Verlag, New York, NY. [Google Scholar]
Associated Data
This section collects any data citations, data availability statements, or supplementary materials included in this article.
Supplementary Materials
Literature reports of Km values for oxygenase enzymes and terminal respiratory oxidases used to construct Fig. 1 and Fig. S1. Download Table S1, XLSX file, 0.10 MB (98.1KB, xlsx) .
Copyright © 2021 Giovannoni et al.
This content is distributed under the terms of the Creative Commons Attribution 4.0 International license.
Cumulative frequency distribution of DO observations from continental shelf depths (5 to 400 m, i.e., above the OMZ) for the northern (red line), central (light blue line), and southern (dark blue line) California Current System (CCS). Note the rarity of DO observations of <25 μM and an apparent hinge in the frequency of observations as DO increases beyond that concentration. Download FIG S2, TIF file, 0.5 MB (499.2KB, tif) .
Copyright © 2021 Giovannoni et al.
This content is distributed under the terms of the Creative Commons Attribution 4.0 International license.
Examples of respiration rates from field collected samples that exhibited nonsaturating dynamics at tens of micromolar (O2). In each instance, respiration rates were assayed in samples where O2 was manipulated independently. Data from the CCS were measured via O2 optode equipped glass bottles from water samples collected within the OMZ. Oxygen was increased by allowing air to be momentarily entrained as bottles were filled. Download FIG S3, TIF file, 0.4 MB (451.9KB, tif) .
Copyright © 2021 Giovannoni et al.
This content is distributed under the terms of the Creative Commons Attribution 4.0 International license.
Oxidase density plot. This plot illustrates the distribution of oxygenase Km values reported in the literature for respiratory and nonrespiratory oxidases (A) compared to whole-cell assays, including labile and semilabile carbon sources (B). Download FIG S1, TIF file, 0.5 MB (516.3KB, tif) .
Copyright © 2021 Giovannoni et al.
This content is distributed under the terms of the Creative Commons Attribution 4.0 International license.