

Key Points
Question
What is the absolute risk of rupture of an intracranial aneurysm with growth detected during follow-up?
Findings
In this cohort study including 312 patients with aneurysms with growth, within 1 year after growth detection, the absolute risk of rupture was 4.3%. In the triple-S prediction model based on 3 independent predictors of rupture (size, site, and shape), the 1-year risk of rupture ranged from 2.1% to 10.6%.
Meaning
In this study, the triple-S prediction model was useful in estimating the risk of rupture after detection of growth, which can serve as a starting point for discussing preventive aneurysm treatment.
This cohort study evaluates the absolute risk of rupture of an aneurysm after detection of growth during follow-up and develops a prediction model for rupture.
Abstract
Importance
Unruptured intracranial aneurysms not undergoing preventive endovascular or neurosurgical treatment are often monitored radiologically to detect aneurysm growth, which is associated with an increase in risk of rupture. However, the absolute risk of aneurysm rupture after detection of growth remains unclear.
Objective
To determine the absolute risk of rupture of an aneurysm after detection of growth during follow-up and to develop a prediction model for rupture.
Design, Setting, and Participants
Individual patient data were obtained from 15 international cohorts. Patients 18 years and older who had follow-up imaging for at least 1 untreated unruptured intracranial aneurysm with growth detected at follow-up imaging and with 1 day or longer of follow-up after growth were included. Fusiform or arteriovenous malformation-related aneurysms were excluded. Of the 5166 eligible patients who had follow-up imaging for intracranial aneurysms, 4827 were excluded because no aneurysm growth was detected, and 27 were excluded because they had less than 1 day follow-up after detection of growth.
Exposures
All included aneurysms had growth, defined as 1 mm or greater increase in 1 direction at follow-up imaging.
Main Outcomes and Measures
The primary outcome was aneurysm rupture. The absolute risk of rupture was measured with the Kaplan-Meier estimate at 3 time points (6 months, 1 year, and 2 years) after initial growth. Cox proportional hazards regression was used to identify predictors of rupture after growth detection.
Results
A total of 312 patients were included (223 [71%] were women; mean [SD] age, 61 [12] years) with 329 aneurysms with growth. During 864 aneurysm-years of follow-up, 25 (7.6%) of these aneurysms ruptured. The absolute risk of rupture after growth was 2.9% (95% CI, 0.9-4.9) at 6 months, 4.3% (95% CI, 1.9-6.7) at 1 year, and 6.0% (95% CI, 2.9-9.1) at 2 years. In multivariable analyses, predictors of rupture were size (7 mm or larger hazard ratio, 3.1; 95% CI, 1.4-7.2), shape (irregular hazard ratio, 2.9; 95% CI, 1.3-6.5), and site (middle cerebral artery hazard ratio, 3.6; 95% CI, 0.8-16.3; anterior cerebral artery, posterior communicating artery, or posterior circulation hazard ratio, 2.8; 95% CI, 0.6-13.0). In the triple-S (size, site, shape) prediction model, the 1-year risk of rupture ranged from 2.1% to 10.6%.
Conclusion and Relevance
Within 1 year after growth detection, rupture occurred in approximately 1 of 25 aneurysms. The triple-S risk prediction model can be used to estimate absolute risk of rupture for the initial period after detection of growth.
Introduction
Unruptured intracranial aneurysms (UIAs) occur in approximately 3% of the adult population.1 The number of incidentally discovered UIAs has increased owing to the rising availability and use of brain imaging.2 Most UIAs are smaller than 7 mm and have a low risk of rupture.3 Preventive endovascular or neurosurgical aneurysm treatment is often considered, but these treatment options carry a substantial risk of procedure-related complications.4 In many patients with small aneurysms, the aneurysm remains untreated because the risk of treatment complications is estimated to be higher than the risk of rupture. Most of these patients are monitored over time with repeated magnetic resonance angiography or computed tomography angiography to detect aneurysm growth. If aneurysm growth is detected, the aneurysm is often treated. This policy is based on observations that aneurysms with detected growth have a higher risk of rupture than aneurysms without growth.5,6,7,8,9,10 Although the relative risk of rupture after detection of growth is increased, the absolute risk of rupture after detection of aneurysm growth is unknown. This absolute risk is pivotal for consultation with patients after detection of growth of the aneurysm, because the risk of rupture needs to be weighed against the risk of treatment complications. The purpose of this multicenter cohort study was to determine the absolute risk of rupture of an aneurysm after detection of growth on follow-up imaging and to develop a prediction model for rupture based on predictors of rupture.
Methods
Design and Population
In this retrospective cohort study, individual patient data were obtained for patients with at least 1 UIA with growth detected on follow-up imaging from 15 cohorts in the following countries: Canada (Toronto), China (Hong Kong), Germany (Mannheim), Japan (Akita, Toon City, and Tokyo [3 cohorts]), Finland (Kuopio and Turku), the Netherlands (Amsterdam, Nijmegen, Utrecht, and the Hague), and the United Kingdom (Glasgow). This study followed the Strengthening the Reporting of Observational Studies in Epidemiology (STROBE) reporting guideline. Approval for data collection was obtained from the institutional research ethics board of all participating centers. The need for informed consent was waived and granted by the regulatory authority because data were deidentified.
We included cohorts with consecutive patients 18 years and older with at least 1 untreated UIA with growth detected at follow-up imaging, and with 1 day or longer follow-up after growth. Growth was defined as 1 mm or greater increase in 1 direction of the UIA on magnetic resonance angiography, computed tomography angiography, or digital subtraction angiography.11 Exclusion criteria were fusiform or arteriovenous malformation-related aneurysm and no indication for follow-up imaging according to the treating physician, for example because of comorbidity, advanced age, or patient preference.
Measurements
From medical records, including radiology reports, the following data were collected by local investigators: age, sex, history of subarachnoid hemorrhage, smoking status at time of detection of growth, maximum aneurysm size before growth, date of last imaging before growth, date of imaging that detected growth, maximum aneurysm size at imaging that detected growth, aneurysm shape, aneurysm site, treatment after growth during follow-up, date of treatment after growth, rupture after growth, date of rupture after growth, date of last imaging after growth and date of last follow-up visit after growth. Geographic regions were subdivided into 3 groups: Japan, Finland, and North-America, Europe (other than Finland) and China. These categories were based on a previous pooled analysis of 6 prospective cohort studies, which showed an increase in risk of rupture among Japanese and Finnish patients.3 Irregular aneurysm shape was defined as the presence of blebs, aneurysm wall protrusions, daughter sacs, or multiple lobes.12 Aneurysm size was measured on a 0.1-mm scale by a radiologist or neuroradiologist at the participating center as part of standard clinical care. Measurements were made using electronic calibers on time-of-flight magnetic resonance angiography scans, computed tomography angiography scans, and rotational digital subtraction angiography scans and calibrated calipers on 2-dimensional digital subtraction angiography scans. Next, aneurysm morphology was determined by visual assessment by the radiologist or neuroradiologist of the participating center. The local investigator retrospectively collected these aneurysm measurements from the radiology report for the purpose of this study. Growth factor was calculated by dividing the maximum aneurysm size at imaging that detected growth by the maximum size before growth. Based on the PHASES score, aneurysm site was subdivided into 3 categories: internal carotid artery (excluding posterior communicating artery), middle cerebral artery, and anterior cerebral arteries, posterior communicating artery, or posterior circulation.3
The primary outcome was rupture of an aneurysm after detection of growth. The period of observation for each UIA after detection of growth was defined as the period between date of imaging that detected growth and date of rupture, date of treatment, or date of last patient contact (last checked in January 2020). Vascular imaging was conducted in the context of standard follow-up in accordance with local institutional guidelines. The decision to recommend aneurysm treatment or watchful waiting to patients with UIAs was determined by the local multidisciplinary team.
Statistical Analysis
Analyses were aneurysm based. The Kaplan-Meier estimate was used to determine the absolute risk of aneurysm rupture at 6 months, 1 year, and 2 years. Patients were monitored until aneurysm rupture, treatment, or last patient contact. A stratified analysis was performed to investigate potential sex differences in risk of rupture. The impact of the potential predictors on rupture was analyzed with univariable and multivariable Cox proportional hazards models. Potential predictors of rupture were age, sex, previous subarachnoid hemorrhage from another aneurysm, smoking status at time of detection of growth, geographic region, aneurysm size at follow-up imaging that detected growth, growth factor, aneurysm shape at follow-up imaging that detected growth, and aneurysm site. The full model was simplified by exclusion of potential predictors with a backward selection procedure based on a P value less than .20. The log minus log plot for each predictor was visually checked for possible deviations from the assumption of proportional hazards. Results were reported as hazard ratios (HRs) with 95% CIs. Kaplan-Meier curves were used to examine the absolute risk of rupture for each selected predictor. To test the equality of the survival distributions for the different levels of each predictor, the log-rank test pooled over strata was used. A P value less than .05 indicated statistical significance.
In additional analyses, we built a prediction model. As Cox proportional hazard models are known to overestimate predicted risks when applying the model to new patients, shrinkage was applied using Ridge regression. The amount of shrinkage was based on the full model with all potential predictors to reflect the selection of predictors. Regression coefficients from this analysis were used to estimate 6-month, 1-year, and 2-year risks of rupture. The discriminative ability of this model was estimated with the C statistic, which indicates to what extent the model could distinguish between aneurysms that did and did not rupture during follow-up.13
Two variables showed missing values: age at time of growth was missing for 1 patient and smoking status for 51 patients. Because data were missing randomly, we used multiple imputation to determine the impact of these variables on the risk of rupture. As we did not include these predictors in the final analysis, all analyses were based on complete data. Statistical analyses were performed in SPSS version 25.0 (IBM) and R version 4.0.2 (The R Foundation).
Results
We screened 5166 patients who had follow-up imaging for 6928 untreated UIAs. Of these, 4827 patients were excluded because no aneurysm growth was detected during follow-up and 27 patients were excluded because they had less than 1 day follow-up after detection of growth. The reasons for less than 1 day follow-up for these 27 patients were: 13 patients had no clinical follow-up after growth, 8 patients had treatment on the same day of aneurysm growth detection, and 6 patients had rupture on the same day that growth was detected. As a result, we included 312 patients with 329 aneurysms with detected growth. The total follow-up after growth was 864 aneurysm-years (median, 1.3 years; interquartile range [IQR], 0.4-4.0). Patient and aneurysm characteristics at baseline are shown in Table 1. The mean (SD) age at time of detection of aneurysm growth was 61 (12) years, and 223 patients (71%) were women. Aneurysm growth was 1 to 2 mm in 200 aneurysms (61%), ≥2 to 3 mm in 63 aneurysms (19%), and ≥3 mm in 66 aneurysms (20%). After detection of growth, 134 aneurysms (41%) in 128 patients (41%) were treated after a median (IQR) of 0.4 (0.2-0.8) years. The median (IQR) absolute growth of the treated aneurysms was 1.8 (1.2-3.0) mm compared with 1.5 (1.1-2.1) mm of aneurysms that were not treated after detection of growth. More detailed information on treated and untreated aneurysms is shown in Table 2.
Table 1. Patient and Aneurysm Characteristics.
| Characteristic | No. (%) | ||
|---|---|---|---|
| Total (N = 312) | Patients with ruptured aneurysm (n = 24) | Patients with unruptured aneurysm (n = 288) | |
| Female | 223 (71) | 17 (71) | 206 (72) |
| Male | 89 (29) | 7 (29) | 82 (28) |
| Age, mean (SD), ya | 61 (12) | 65 (10) | 60 (12) |
| <70 | 235 (75) | 16 (67) | 219 (76) |
| ≥70 | 77 (25) | 8 (33) | 69 (24) |
| Previous SAH from another aneurysm | 45 (14) | 4 (17) | 41 (14) |
| Smokingb,c | 128 (41) | 7 (29) | 109 (38) |
| Geographic region | |||
| North America, Europe (except Finland), and Chinad | 205 (66) | 16 (67) | 191 (66) |
| Japan | 64 (21) | 4 (17) | 57 (20) |
| Finland | 43 (14) | 4 (17) | 40 (14) |
| Multiple growing aneurysms | 16 (5) | 1 (4) | 15 (5) |
| Included aneurysms, No. | 329 | 25 | 304 |
| Aneurysm size before growth, median (IQR), mm | 4.5 (2.8-7.0) | 6.3 (4.1-8.4) | 4.2 (2.6-7.0) |
| <5.0 | 180 (55) | 7 (28) | 173 (57) |
| 5.0-6.9 | 58 (18) | 7 (28) | 51 (17) |
| 7.0-9.9 | 51 (16) | 8 (32) | 43 (14) |
| ≥10.0 | 40 (12) | 3 (12) | 37 (12) |
| Aneurysm size after growth, median (IQR), mm | 6.0 (4.3-9.0) | 8.0 (6.0-11.0) | 6.0 (4.3-9.0) |
| <5.0 | 108 (33) | 4 (16) | 104 (34) |
| 5.0-6.9 | 83 (25) | 5 (20) | 78 (26) |
| 7.0-9.9 | 65 (20) | 8 (32) | 57 (19) |
| ≥10.0 | 73 (22) | 8 (32) | 65 (21) |
| Absolute growth, median (IQR), mm | 1.6 (1.1-2.3) | 2.0 (1.4-3.0) | 1.5 (1.1-2.3) |
| Growth factor, median (IQR)e | 1.4 (1.3-1.6) | 1.3 (1.2-1.4) | 1.4 (1.3-1.6) |
| Irregular aneurysm shapef | 109 (33) | 14 (56) | 95 (31) |
| Aneurysm site | |||
| ICA | 82 (25) | 2 (8) | 80 (26) |
| MCA | 106 (32) | 12 (48) | 94 (31) |
| Pcom | 27 (8) | 0 (0) | 27 (9) |
| Acom | 49 (15) | 3 (12) | 46 (15) |
| ACA (including pericallosal arteries) | 17 (5) | 3 (12) | 14 (5) |
| Basilar tip | 25 (8) | 4 (16) | 21 (7) |
| Vertebrobasilar arteries (excluding basilar tip) | 23 (7) | 1 (4) | 22 (7) |
| Follow-up in years after detection of growth, median (IQR) | 1.3 (0.4-4.0) | 1.1 (0.1-3.0) | 1.4 (0.4-4.2) |
Abbreviations: ACA, anterior cerebral arteries; Acom, anterior communicating artery; ICA, internal carotid artery; IQR, interquartile range; MCA, middle cerebral artery; Pcom, posterior communicating artery; SAH, subarachnoid hemorrhage.
Missing values were imputed for 1 patient.
Missing values were imputed for 51 patients.
Smoking was defined as smoking status (yes/no) at time of detection of growth.
The included countries were Canada, Germany, the Netherlands, the United Kingdom, and China.
The growth factor was calculated by dividing the maximum aneurysm size at imaging that first detected growth by the maximum size before growth.
Irregular aneurysm shape was defined as the presence of blebs, aneurysm wall protrusions, daughter sacs, or multiple lobes.
Table 2. Characteristics of Patients and Aneurysms During Follow-up After Growth Detection.
| Characteristic | No. (%) | |
|---|---|---|
| Treated | Untreated | |
| Included patients, No. | 128 | 184 |
| Female | 97 (76) | 126 (68) |
| Male | 31 (24) | 58 (32) |
| Age, mean (SD), ya | 56 (11) | 64 (12) |
| <70 | 113 (88) | 122 (66) |
| ≥70 | 15 (12) | 62 (34) |
| Previous SAH from another aneurysm | 24 (19) | 21 (11) |
| Smokingb,c | 56 (44) | 60 (33) |
| Geographic region | ||
| North America, Europe (except Finland), and Chinad | 91 (72) | 114 (62) |
| Japan | 8 (6) | 56 (30) |
| Finland | 29 (23) | 14 (8) |
| Multiple growing aneurysms | 8 (6) | 8 (4) |
| Included aneurysms, No. | 134 | 195 |
| Aneurysm size before growth, median (IQR), mm | 4.8 (3.0-7.0) | 4.3 (2.6-7.0) |
| <5.0 | 70 (52) | 110 (56) |
| 5.0-6.9 | 24 (18) | 34 (17) |
| ≥7.0 | 40 (30) | 51 (26) |
| Aneurysm size after growth, median (IQR), mm | 6.4 (4.5-9.5) | 6.0 (4.2-9.0) |
| <5.0 | 40 (30) | 68 (35) |
| 5.0-6.9 | 32 (24) | 51 (26) |
| ≥7.0 | 62 (46) | 76 (39) |
| Absolute growth, median (IQR), mm | 1.8 (1.2-3.0) | 1.5 (1.1-2.1) |
| Growth factor, median (IQR)e | 1.4 (1.2-1.7) | 1.4 (1.3-1.6) |
| Irregular aneurysm shapef | 58 (43) | 51 (26) |
| Aneurysm site | ||
| ICA | 38 (28) | 44 (23) |
| MCA | 50 (37) | 56 (29) |
| ACA/Pcom/posterior circulationg | 46 (34) | 95 (49) |
| Follow-up after detection of growth, median (IQR), y | 0.4 (0.2-0.8) | 3.1 (1.4-5.8) |
Abbreviations: ACA, anterior cerebral arteries (including the anterior cerebral artery, anterior communicating artery, and pericallosal artery); ICA, internal carotid artery; IQR, interquartile range; MCA, middle cerebral artery; Pcom, posterior communicating artery; SAH, subarachnoid hemorrhage.
Missing values were imputed for 1 patient.
Missing values were imputed for 51 patients.
Smoking was defined as smoking status (yes/no) at time of detection of growth.
The included countries are Canada, Germany, the Netherlands, the United Kingdom, and China.
The growth factor was calculated by dividing the maximum aneurysm size at imaging that first detected growth by the maximum size before growth.
Irregular aneurysm shape was defined as the presence of blebs, aneurysm wall protrusions, daughter sacs, or multiple lobes.
Including vertebral artery, basilar artery, cerebellar arteries, and posterior cerebral artery.
Aneurysm Rupture
The number of aneurysms that were monitored and at risk of rupture was 226 at 6 months, 179 at 1 year, and 153 at 2 years. Aneurysm rupture after detection of growth occurred in 25 aneurysms (7.6%) in 24 patients after a median (IQR) of 1.1 (0.1-3.0) years. The absolute cumulative risks of rupture after growth were 2.9% (95% CI, 0.9-4.9) at 6 months, 4.3% (95% CI, 1.9-6.7) at 1 year, and 6.0% (95% CI, 2.9-9.1) at 2 years. The risk of rupture declined over time: 0.48% per month (95% CI, 0.15-0.82) during the first 6 months, 0.23% per month (95% CI, 0.17-0.30) between 7 and 12 months, and 0.14% per month (95% CI, 0.08-0.40) between 12 and 24 months. After 6 years of follow-up, 45 aneurysms were still being monitored and none of these ruptured during the remaining 111 aneurysm-years of follow-up. Stratified analyses in male and female individuals did not show sex differences in risk of rupture.
In multivariable analysis, predictors of rupture were aneurysm size (7 mm or larger HR, 3.1; 95% CI, 1.4-7.2), aneurysm shape (irregular HR, 2.9; 95% CI, 1.3-6.5), and aneurysm site (middle cerebral artery HR, 3.6; 95% CI, 0.8-16.3; anterior cerebral artery, posterior communicating artery, or posterior circulation HR, 2.8; 95% CI, 0.6-13.0) (Table 3). Kaplan-Meier curves are shown in the Figure. The shrinked HRs of the selected predictors were used for the final prediction model (Table 4). This triple-S (aneurysm size, site, and shape) risk prediction model estimated 6-month, 1-year, and 2-year risks of rupture for an aneurysm after detection of growth. In the triple-S risk prediction model, the 1-year risk of rupture ranged from 2.1% to 10.6%. The C index of this model was 0.72 (95% CI, 0.62-0.82).
Table 3. Comparison Between Ruptured and Unruptured Aneurysms After Detection of Growth.
| Potential predictors | Ruptured, No. (%) | Unruptured, No. (%) | Univariable HR (95% CI) | Multivariable, HR (95% CI) | Shrinked HRa |
|---|---|---|---|---|---|
| Included aneurysms | 25 (8) | 304 (92) | NA | NA | NA |
| Male | 7 (8) | 86 (92) | [Reference] | NA | NA |
| Female | 18 (8) | 218 (92) | 1.05 (0.44-2.51) | NA | NA |
| Age <70 y | 17 (7) | 233 (93) | [Reference] | NA | NA |
| Age ≥70 yb | 8 (10) | 71 (90) | 1.22 (0.52-2.83) | NA | NA |
| No previous SAH | 21 (7) | 262 (93) | [Reference] | NA | NA |
| Previous SAH from another aneurysm | 4 (9) | 42 (91) | 1.18 (0.41-3.45) | NA | NA |
| No smoking | 12 (6) | 178 (94) | [Reference] | NA | NA |
| Smokingc,d | 13 (9) | 126 (91) | 0.86 (0.37-2.00) | NA | NA |
| Geographic region | |||||
| North America, Europe (except Finland), and Chinae | 17(8) | 216 (92) | [Reference] | NA | NA |
| Japan | 4 (6) | 63 (94) | 0.44 (0.15-1.34) | NA | NA |
| Finland | 4 (9) | 46 (91) | 1.02 (0.34-3.03) | NA | NA |
| Aneurysm size after growth <7 mm | 9 (5) | 182 (95) | [Reference] | [Reference] | [Reference] |
| Aneurysm size after growth ≥7 mm | 16 (12) | 122 (88) | 3.22 (1.42-7.33) | 3.13 (1.36-7.22) | 1.81 |
| Absolute growth, median (IQR), mm | 2.0 (1.4-3.0) | 1.5 (1.1-2.3) | 1.11 (0.93-1.31) | NA | NA |
| Growth factor, median (IQR)f | 1.3 (1.2-1.4) | 1.4 (1.3-1.6) | 0.69 (0.25-1.91) | NA | NA |
| Regular aneurysm shape | 11 (5) | 209 (95) | [Reference] | [Reference] | [Reference] |
| Irregular aneurysm shapeg | 14 (13) | 95 (87) | 3.41 (1.54-7.54) | 2.88 (1.28-6.47) | 1.90 |
| Aneurysm site | |||||
| ICA | 2 (2) | 80 (98) | [Reference] | [Reference] | [Reference] |
| MCA | 12 (11) | 94 (89) | 5.36 (1.20-23.99) | 3.55 (0.77-16.29) | 1.48 |
| ACA/Pcom/posterior circulationh | 11 (8) | 130 (92) | 3.44 (0.76-15.51) | 2.83 (0.62-12.96) | 1.17 |
Abbreviations: ACA, anterior cerebral arteries (including the anterior cerebral artery, anterior communicating artery, and pericallosal artery); HR, hazard ratio; ICA, internal carotid artery; IQR, interquartile range; MCA, middle cerebral artery; Pcom, posterior communicating artery; SAH, subarachnoid hemorrhage.
Ridge regression was used for shrinkage of the HRs.
Missing values were imputed for 1 aneurysm.
Missing values were imputed for 51 aneurysms.
Smoking was defined as smoking status (yes/no) at time of detection of growth.
The included countries are Canada, Germany, The Netherlands, the United Kingdom, and China.
The growth factor was calculated by dividing the maximum aneurysm size at imaging that first detected growth by the maximum size before growth.
Irregular aneurysm shape was defined as the presence of blebs, aneurysm wall protrusions, daughter sacs, or multiple lobes.
Including vertebral artery, basilar artery, cerebellar arteries, and posterior cerebral artery.
Figure. Time to Rupture After Observation of Intracranial Aneurysm Growth.
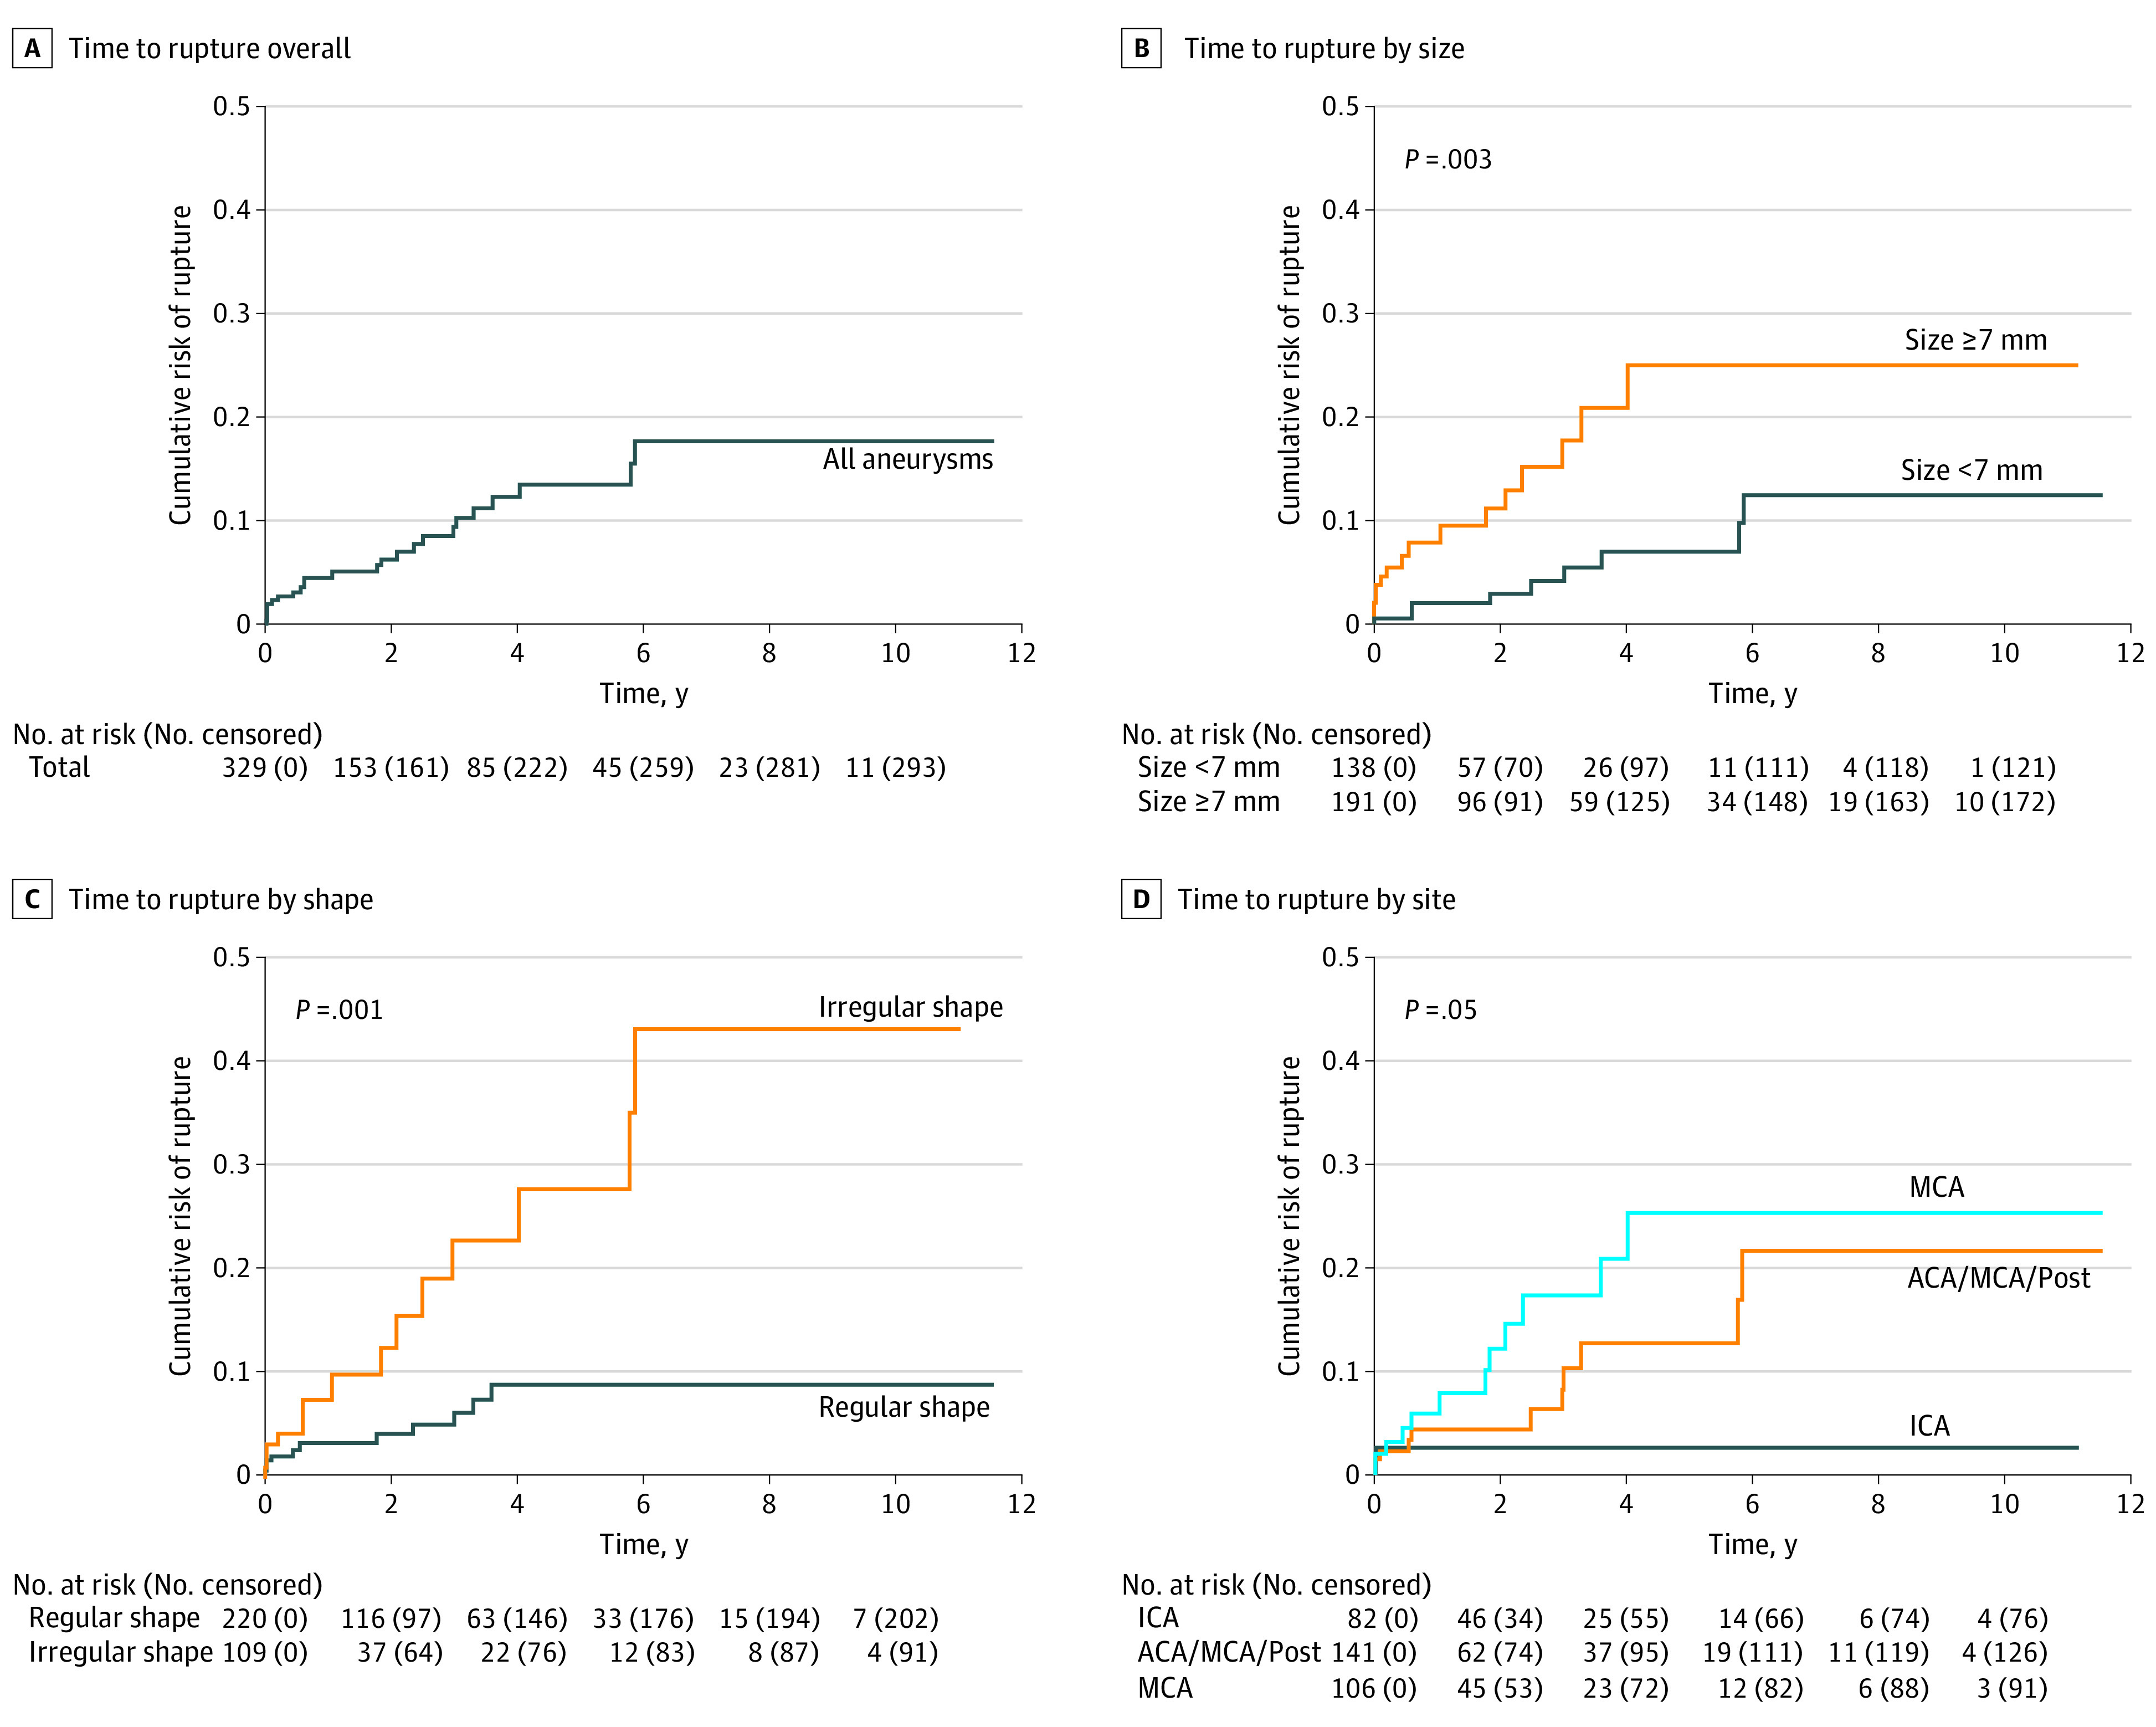
Table 4. Triple-S Prediction Model for Estimating Rupture Risk After Aneurysm Growtha.
| Size | Shape | Estimated risk of rupture, % | ||||||||
|---|---|---|---|---|---|---|---|---|---|---|
| ICA | Site | MCA | ||||||||
| ACA/Pcom/posterior circulationb | ||||||||||
| 6-mo | 1-y | 2-y | 6-mo | 1-y | 2-y | 6-mo | 1-y | 2-y | ||
| <7 mm | Regular | 1.4 | 2.1 | 3.0 | 1.6 | 2.4 | 3.5 | 2.1 | 3.1 | 4.5 |
| Irregularc | 2.7 | 4.0 | 5.7 | 3.1 | 4.6 | 6.7 | 3.9 | 5.9 | 8.5 | |
| ≥7 mm | Regular | 2.5 | 3.8 | 5.5 | 3.0 | 4.4 | 6.4 | 3.8 | 5.6 | 8.1 |
| Irregular | 4.8 | 7.2 | 10.4 | 5.6 | 8.4 | 12.2 | 7.2 | 10.6 | 15.4 | |
Abbreviations: ACA, anterior cerebral arteries (including the anterior cerebral artery, anterior communicating artery, and pericallosal arteries); ICA, internal carotid artery; MCA, middle cerebral artery; Pcom, posterior communicating artery.
Aneurysm growth was defined as an increase of ≥1 mm in at least 1 direction.
Including vertebral artery, basilar artery, cerebellar arteries, and posterior cerebral artery.
Irregular aneurysm shape is defined as the presence of blebs, aneurysm wall protrusions, daughter sacs, or multiple lobes.
Discussion
In this cohort study, within 1 year after detection of growth, rupture occurred in approximately 1 of 25 aneurysms. With the triple-S risk prediction model, based on 3 easily retrievable predictors (aneurysm size, site, and shape), absolute risks of rupture could be estimated for the initial period after detection of growth of an aneurysm, with risks in the first year varying from 2.1% to 10.6%.
The high risk of rupture we found for aneurysms after detection of growth is in line with previous studies in which a higher risk of rupture was found for aneurysms with growth detected at follow-up imaging compared with aneurysms without growth.5,6,7,8,9 These studies provided only relative risks, which are more difficult to interpret in clinical practice than absolute risks. Moreover, all previous studies were single-center studies with a limited number of aneurysms with growth, which precluded identification of predictors of rupture. In addition, there was substantial heterogeneity in the definition of growth across studies. With our study, we tried to overcome the limitations of previous studies. We can now estimate the absolute risks of rupture for the initial 2 years after detection of growth based on 3 easily retrievable predictors.
Growth of a UIA is not a linear but rather a stochastic process.8,14,15,16,17 The high risk of rupture we found after growth may reflect a period of increased instability of the aneurysm wall, which initially leads to growth and then to rupture. However, after growth, the aneurysm may stabilize again; we found that aneurysms can remain stable without rupture up to 12 years after detection of growth. The fact that aneurysm growth is often not followed by rupture explains how small aneurysms can become large aneurysms over time. If a large aneurysm is detected at first-ever brain imaging, it most likely means this aneurysm had multiple episodes of instability with growth but without rupture in the past. This implies that not all growing aneurysms need preventive treatment after growth is observed. The triple-S prediction model can help determine which aneurysms should undergo preventive occlusion and for which aneurysms follow-up imaging can be continued.
In current clinical practice, the most important factors that are taken into account for treatment decisions in patients with a UIA are the estimated risks of aneurysm rupture and treatment complications, patient anxiety, and life expectancy. For newly detected aneurysms, the PHASES score can be used to estimate the risk of aneurysm rupture.3 For aneurysms showing growth during follow-up imaging, the triple-S prediction model provides estimates of the risk of rupture in the initial period after growth detection. Comparing the results of our study with those of the PHASES score, for most aneurysm categories, the 1-year risk of rupture after growth detection is higher than the 5-year risk of rupture after aneurysm detection. This means that the indication for preventive aneurysm occlusion is stronger for an aneurysm with recently detected growth than for a similar aneurysm without detected growth. The triple-S prediction model also shows that for some aneurysms the absolute risk of rupture remains small after detection of growth, and careful weighing of the risk of rupture vs the risk of treatment complications is needed.
Strengths and Limitations
A strength of this study is that it included individual patient data pooled from 15 international cohorts. We thereby had sufficient numbers of patients with aneurysm rupture after detection of growth to assess multiple risk factors for growth. In all included cohorts, growth was defined according to the accepted standards recommended by the National Institutes of Health Common Data Elements Project on Unruptured Intracranial Aneurysms and Subarachnoid Hemorrhage.11 Furthermore, we provided the absolute risks of rupture for 3 time points in the initial 2 years after detection of aneurysm growth. Based on the risk factors we identified, we were able to make a clinically applicable prediction model for rupture risk estimation after detection of growth of an aneurysm. Patients were included from cohorts with low- and high-risk populations from 7 countries and 3 continents, which adds to the external validity of our findings.
A few study limitations need to be addressed. First, this study cannot be regarded as a natural history study of risk of rupture after growth of an aneurysm because of the inevitable selection that has occurred in the included cohorts. Patients’ decisions whether or not to undergo preventive treatment, follow-up imaging, or neither determines the selection of patients with follow-up imaging. From those with growth detected at follow-up imaging, many would have had preventive aneurysm treatment shortly after detection of aneurysm growth, leading to selection bias toward patients with lower risks of rupture. However, this type of bias is unavoidable in observational studies. Second, the indication for and timing of follow-up imaging were decided by the treating physicians of the local institutions and therefore varied between cohorts and patients. In patients with a longer time interval between 2 scans, potential growth in an early phase of this interval would result in a longer interval prior to the next follow-up scan. Thus the risk of rupture would have already decreased after detection of growth. Third, we did not perform a sample size calculation for this study, as reasonable estimates for a calculation were not known prior to this study. In a post hoc power analysis, we evaluated the number of ruptures needed to detect increasing HRs from 1.3 to 2.0 with 0.80 power. This analysis (eAppendix in the Supplement) suggests that with the 25 ruptures observed in this study, an HR of 1.65 may be detected. As a result, any predictor with a lower HR may have been excluded from the model. Fourth, it is possible that we missed some outcome events, because rupture could have resulted in sudden death without diagnosis of subarachnoid hemorrhage or presentation in another hospital without informing the treating physician of the participating center. Because of these limitations, the presented risks are probably an underestimation of the risk of rupture after growth. Fifth, to our knowledge, no guidelines previously existed for optimal UIA measurement methods, and no optimal threshold value for aneurysms growth based on optimal reliability and agreement measures is available. Therefore, we applied thresholds for aneurysm growth based on the best available evidence in the literature and used the definition of growth of 1 mm as suggested by the National Institutes of Health Common Data Elements Project on Unruptured Intracranial Aneurysms and Subarachnoid Hemorrhage, which was based on consensus between aneurysm experts.11
Conclusions
The implications for clinical practice from our study are that preventive endovascular or neurosurgical aneurysm treatment should be reconsidered as soon as aneurysm growth is detected. In such instances of aneurysm growth, our triple-S prediction model can be used by physicians and patients as a starting point for discussing the pros and cons of preventive aneurysm treatment. If it is decided to continue follow-up imaging, it seems reasonable to repeat imaging at a short interval, but actual data on the optimal time interval are lacking and should be gathered in future studies. Future data collection and studies are also needed to validate the prediction model.
eAppendix. Post hoc power analysis
References
- 1.Vlak MHM, Algra A, Brandenburg R, Rinkel GJE. Prevalence of unruptured intracranial aneurysms, with emphasis on sex, age, comorbidity, country, and time period: a systematic review and meta-analysis. Lancet Neurol. 2011;10(7):626-636. doi: 10.1016/S1474-4422(11)70109-0 [DOI] [PubMed] [Google Scholar]
- 2.Gabriel RA, Kim H, Sidney S, et al. Ten-year detection rate of brain arteriovenous malformations in a large, multiethnic, defined population. Stroke. 2010;41(1):21-26. doi: 10.1161/STROKEAHA.109.566018 [DOI] [PMC free article] [PubMed] [Google Scholar]
- 3.Greving JP, Wermer MJH, Brown RD Jr, et al. Development of the PHASES score for prediction of risk of rupture of intracranial aneurysms: a pooled analysis of six prospective cohort studies. Lancet Neurol. 2014;13(1):59-66. doi: 10.1016/S1474-4422(13)70263-1 [DOI] [PubMed] [Google Scholar]
- 4.Algra AM, Lindgren A, Vergouwen MDI, et al. Procedural clinical complications, case-fatality risks, and risk factors in endovascular and neurosurgical treatment of unruptured intracranial aneurysms: a systematic review and meta-analysis. JAMA Neurol. 2019;76(3):282-293. doi: 10.1001/jamaneurol.2018.4165 [DOI] [PMC free article] [PubMed] [Google Scholar]
- 5.Villablanca JP, Duckwiler GR, Jahan R, et al. Natural history of asymptomatic unruptured cerebral aneurysms evaluated at CT angiography: growth and rupture incidence and correlation with epidemiologic risk factors. Radiology. 2013;269(1):258-265. doi: 10.1148/radiol.13121188 [DOI] [PubMed] [Google Scholar]
- 6.Mehan WA Jr, Romero JM, Hirsch JA, et al. Unruptured intracranial aneurysms conservatively followed with serial CT angiography: could morphology and growth predict rupture? J Neurointerv Surg. 2014;6(10):761-766. doi: 10.1136/neurintsurg-2013-010944 [DOI] [PubMed] [Google Scholar]
- 7.Inoue T, Shimizu H, Fujimura M, Saito A, Tominaga T. Annual rupture risk of growing unruptured cerebral aneurysms detected by magnetic resonance angiography. J Neurosurg. 2012;117(1):20-25. doi: 10.3171/2012.4.JNS112225 [DOI] [PubMed] [Google Scholar]
- 8.Chien A, Callender RA, Yokota H, et al. Unruptured intracranial aneurysm growth trajectory: occurrence and rate of enlargement in 520 longitudinally followed cases. J Neurosurg. 2019;132(4):1077-1087. doi: 10.3171/2018.11.JNS181814 [DOI] [PubMed] [Google Scholar]
- 9.Korja M, Lehto H, Juvela S. Lifelong rupture risk of intracranial aneurysms depends on risk factors: a prospective Finnish cohort study. Stroke. 2014;45(7):1958-1963. doi: 10.1161/STROKEAHA.114.005318 [DOI] [PubMed] [Google Scholar]
- 10.Brinjikji W, Zhu YQ, Lanzino G, et al. Risk factors for growth of intracranial aneurysms: a systematic review and meta-analysis. AJNR Am J Neuroradiol. 2016;37(4):615-620. doi: 10.3174/ajnr.A4575 [DOI] [PMC free article] [PubMed] [Google Scholar]
- 11.Hackenberg KAM, Algra A, Salman RAS, et al. ; Unruptured Aneurysms and SAH CDE Project Investigators . Definition and prioritization of data elements for cohort studies and clinical trials on patients with unruptured intracranial aneurysms: proposal of a multidisciplinary research group. Neurocrit Care. 2019;30(suppl 1):87-101. doi: 10.1007/s12028-019-00729-0 [DOI] [PubMed] [Google Scholar]
- 12.Backes D, Vergouwen MDI, Velthuis BK, et al. Difference in aneurysm characteristics between ruptured and unruptured aneurysms in patients with multiple intracranial aneurysms. Stroke. 2014;45(5):1299-1303. doi: 10.1161/STROKEAHA.113.004421 [DOI] [PubMed] [Google Scholar]
- 13.Harrell, FE. Regression Modeling Strategies. Springer International Publishing; 2015. doi: 10.1007/978-3-319-19425-7 [DOI] [Google Scholar]
- 14.Jou LD, Mawad ME. Growth rate and rupture rate of unruptured intracranial aneurysms: a population approach. Biomed Eng Online. 2009;8:11. doi: 10.1186/1475-925X-8-11 [DOI] [PMC free article] [PubMed] [Google Scholar]
- 15.Chang HS. Simulation of the natural history of cerebral aneurysms based on data from the International Study of Unruptured Intracranial Aneurysms. J Neurosurg. 2006;104(2):188-194. doi: 10.3171/jns.2006.104.2.188 [DOI] [PubMed] [Google Scholar]
- 16.Koffijberg H, Buskens E, Algra A, Wermer MJH, Rinkel GJE. Growth rates of intracranial aneurysms: exploring constancy. J Neurosurg. 2008;109(2):176-185. doi: 10.3171/JNS/2008/109/8/0176 [DOI] [PubMed] [Google Scholar]
- 17.Etminan N, Rinkel GJ. Unruptured intracranial aneurysms: development, rupture and preventive management. Nat Rev Neurol. 2016;12(12):699-713. doi: 10.1038/nrneurol.2016.150 [DOI] [PubMed] [Google Scholar]
Associated Data
This section collects any data citations, data availability statements, or supplementary materials included in this article.
Supplementary Materials
eAppendix. Post hoc power analysis