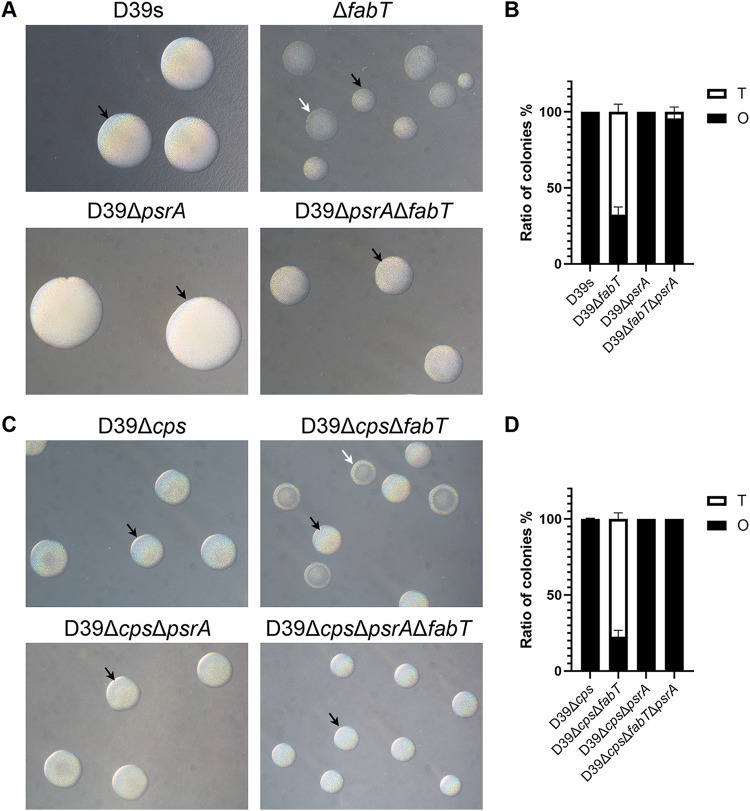
FIG 4.
Colony morphology of fabT and psrA mutants. (A) Encapsulated D39 and derivatives and (C) unencapsulated D39Δcps and derivatives cultured on TSA supplemented with catalase. Phase variation was visualized through oblique lighting after 24 h (encapsulated) and 26 h (unencapsulated). (B) O/T ratio of encapsulated strains. (D) O/T ratio of unencapsulated strains. See Fig. 3 for abbreviations and additional information.

