

Abstract
Iron (Fe) deficiency affects global crop productivity and human health. However, the role of light signaling in plant Fe uptake remains uncharacterized. Here, we find that light‐induced Fe uptake in tomato (Solanum lycopersicum L.) is largely dependent on phytochrome B (phyB). Light induces the phyB‐dependent accumulation of ELONGATED HYPOCOTYL 5 (HY5) protein both in the leaves and roots. HY5 movement from shoots to roots activates the expression of FER transcription factor, leading to the accumulation of transcripts involved in Fe uptake. Mutation in FER abolishes the light quality‐induced changes in Fe uptake. The low Fe uptake observed in phyB, hy5, and fer mutants is accompanied by lower photosynthetic electron transport rates. Exposure to red light at night increases Fe accumulation in wild‐type fruit but has little effects on fruit of phyB mutants. Taken together, these results demonstrate that Fe uptake is systemically regulated by light in a phyB‐HY5‐FER‐dependent manner. These findings provide new insights how the manipulation of light quality could be used to improve Fe uptake and hence the nutritional quality of crops.
Keywords: iron deficiency, light signaling, photoreceptor, Solanum lycopersicum, systematic signaling
Subject Categories: Membrane & Intracellular Transport, Plant Biology
Light‐induced iron uptake in tomato depends on phytochrome B induced accumulation of HY5 protein in the shoot. The movement of HY5 from shoots to roots triggers iron uptake by directly activating FER expression in the roots.
Introduction
Iron (Fe) is an essential element for almost all living organisms. It is central to a variety of cellular activities including chlorophyll (Chl) synthesis, photosynthesis, respiration, oxygen transport, and DNA synthesis (Kobayashi & Nishizawa, 2012; Vigani & Murgia, 2018). The photosynthetic electron transfer chain, particularly photosystems I (PSI) and II (PSII), is rich in Fe‐containing proteins (Nouet et al, 2011). Although Fe is highly abundant in soils, poor solubility and availability in neutral to alkaline soils limit Fe uptake and utilization (Lei et al, 2020). Hence, Fe deficiency constitutes a serious abiotic stress for plants that limits crop productivity (Briat et al, 2015). Moreover, the limited availability of Fe in plant foods particularly vegetables is a main cause of Fe deficiency anemia in humans (DellaValle et al, 2015; He et al, 2016). In fact, Fe deficiency is a serious global health problem that leads to a deterioration in the quality of life for those suffering from Fe deficiency and ultimately chronic diseases (Dahlerup et al, 2015). Therefore, understanding the complex mechanisms of Fe uptake and homeostasis in plants is not only important for crop production, but also for human health.
Plants have developed two main strategies for optimizing Fe uptake in situations of Fe deficiency, i.e., reduction (Strategy I) and chelation (Strategy II). All dicots and non‐graminaceous plants generally acquire Fe via strategy I mechanisms (Schmidt, 2003). Strategy I incorporates three steps. Firstly, root plasma membrane proton pumps such as H+‐ATPase serve to acidify the rhizosphere and increase Fe3+ solubility in the soil. Secondly, Fe3+ is reduced to Fe2+ on root surface by ferric chelate reductase (FCR) encoded by ferric reductase oxidase (FRO). Thirdly, Fe2+ is transported across the membrane by iron‐regulated transporters (IRT) and the natural resistance‐associated macrophage proteins (NRAMP). The expression of several FRO, IRT, and NRAMP genes is Fe responsive and is directly regulated by the central basic helix‐loop‐helix (bHLH) transcription factor FER in tomato or its ortholog FER‐like iron deficiency‐induced transcription factor (FIT) in Arabidopsis, respectively (Ling et al, 2002; Colangelo & Guerinot, 2004). However, little information is available on how FER and FIT are regulated.
The importance of shoots in Fe acquisition has long been recognized. Moreover, the nature of the long‐distance signals that convey information concerning leaf Fe status to the roots is a long‐standing question in Fe research (Grusak & Pezeshgi, 1996; Grillet et al, 2018). To date, many researchers have attempted to identify the systemic signals involved in this process. Several components such as Fe itself, auxin, iron‐nicotianamine transporters, and IRON MAN peptides have been implicated in the regulation of systemic Fe deficiency responses (Maas et al, 1988; Wu et al, 2012; Kumar et al, 2017; Grillet et al, 2018). However, the mechanisms and processes that facilitate systemic Fe uptake in response to Fe deficiency have remained elusive. The studies reported here focus on the identification of components involved in shoot‐to‐root communication during Fe deficiency responses. We examined the role of a light‐controlled systemic signal transmission loop in regulating Fe uptake by the roots and associated photosynthetic electron transport system in the leaves. Data are presented showing that red light activates the phytochrome B (phyB)‐induced protein called ELONGATED HYPOCOTYL 5 (HY5), which is a basic leucine zipper (bZIP) transcription factor. The movement of HY5 from the shoots to the roots triggers Fe uptake by directly activating FER expression in the roots. This pathway maintains Fe homeostasis in leaves and fruits, as well as providing Fe for incorporation into proteins involved in photosynthesis and other important metabolic pathways. These findings not only broaden our understanding of the regulation mechanism of Fe uptake in plants, but also provide new insights concerning how manipulation of light quality might be used to improve the efficiency of Fe uptake and hence the nutritional quality of greenhouse crops.
Results
PhyB plays important roles in light‐regulated Fe uptake
We first determined the sensitivity of tomato to Fe limitation by growing the plants hydroponically with a range of Fe concentrations. The plants grown with 20 μM Fe‐EDTA had the highest levels of biomass accumulation, together with the greatest SPAD readings (an indicator of chlorophyll) and light‐saturated photosynthetic rates (A sat), maximal photochemical efficiencies (Fv/Fm), and photochemical efficiencies at PS I [Y(I)] and PS II [Y(II)], as well as the highest electron transport rates through PS I [ETR (I)] and PS II [ETR(II)] (Appendix Table S1). These parameters were lower at the low (0, 0.2, and 2 μM) and high (200 μM) Fe concentrations. To determine whether Fe uptake is light responsive, we determined the extent of Fe depletion in the nutrient solution at 6‐h intervals in the system where plants were grown at a Fe‐EDTA concentration of 20 μM. We found that Fe uptake at night (at 12–24 h) was only about half that measured during the day (at 0–12 h, Fig 1A). Moreover, the levels of FER, IRT1, FRO1, and NRAMP1 transcripts and the FCR activity in the roots were significantly lower at night compared to the day (Fig 1B and Appendix Fig S1). Other experiments showed that the roots had higher levels of IRT1 transcripts when they were harvested in the light compared to roots that were harvested in the dark, regardless of the changes in photoperiods applied. These findings suggest that IRT1 expression is controlled by light (Appendix Fig S2A and B).
Figure 1. The effects of light and photoreceptors on Fe uptake in tomato plants.
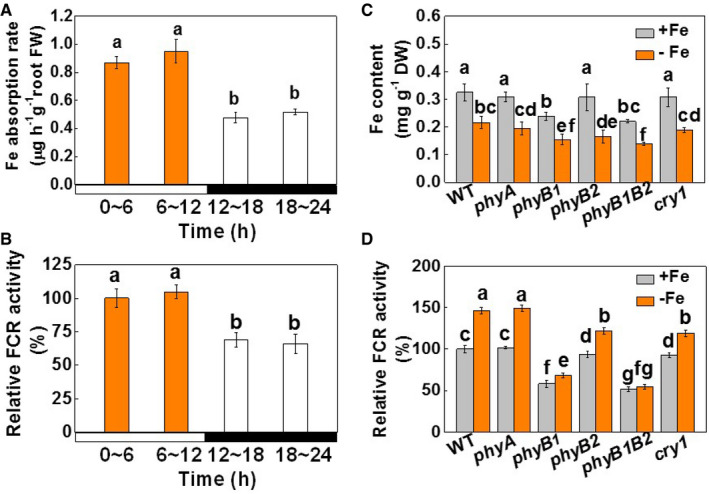
- Fe absorption rates determined every 6 h over a 24‐h period during the day (0–6 and 6–12 h) and at night (12–18 and 18–24 h) under Fe‐sufficient (20 µM, +Fe) conditions. Day and night are indicated by the white and black bars, respectively. Time points 0 and 12 h correspond to 8 AM and 8 PM, i.e., the times for light on and off, respectively.
- Relative FCR activities during the day (at 6 and 12 h) and at night (at 18 and 24 h) under Fe‐sufficient (20 µM, +Fe) conditions. Day and night are indicated by the white and black bars, respectively. Time points 0 and 12 h correspond to 8 AM and 8 PM, i.e., the times for light on and off, respectively.
- Fe contents of the whole plants of wild‐type plants and photoreceptor mutants grown under white light with either Fe‐sufficient (20 µM, +Fe) or Fe‐deficient (2 µM, −Fe) conditions for 7 days.
- Relative FCR activities in the roots of wild‐type plants and photoreceptor mutants grown under white light with either Fe‐sufficient (20 µM, +Fe) or Fe‐deficient (2 µM, −Fe) conditions for 7 days.
Data information: Values are the means ± SD, n = 4 (biological replicates), P < 0.05 (Tukey's test).
We therefore explored whether Fe uptake is a photoreceptor‐dependent process by comparing Fe uptake in wild‐type (WT) tomato plants and in a range of photoreceptor‐deficient mutants, including far‐red light (phyA), red light (phyB1, phyB2, and phyB1B2), and blue light (cry1). Fe accumulation, SPAD values, and FCR activities were similar or slightly lower in the phyA, phyB2, and cry1 mutants than in the WT plants under Fe‐sufficient conditions (Fe‐EDTA at 20 μM) (Fig 1C and D, and Appendix Fig S3A). In marked contrast, Fe accumulation, FCR activity, and SPAD values were much lower in the phyB1 and phyB1B2 mutants than in the WT plants. While growth with a low Fe supply (Fe‐EDTA at 2 μM) resulted in significant decreases in Fe accumulation and SPAD values, FCR activities were significantly increased in the roots of the WT, phyA, and cry1 plants. However, the level of induction was much less in the phyB1 and phyB1B2 mutants than in the WT. In addition, the application of FeSO4 to leaves at a concentration of 0.4 mM significantly increased Chl accumulation and SPAD values, together with increases in Y(I) and Y(II) in the phyB1B2 plants (Appendix Fig S3B). These results suggest that the Fe uptake capacity of the phyB1B2 mutants contributed, at least in part, to the lower chlorophyll contents, and Y(I) and Y(II) values of these plants.
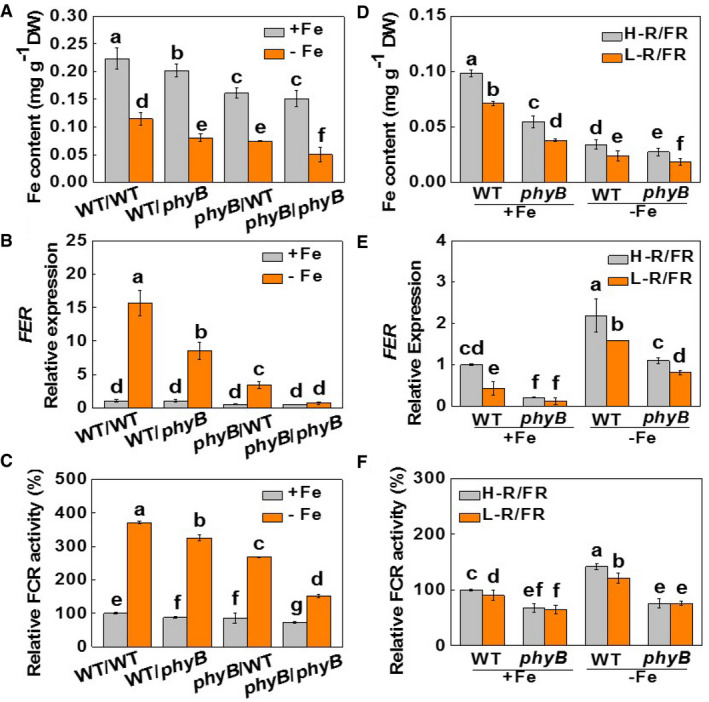
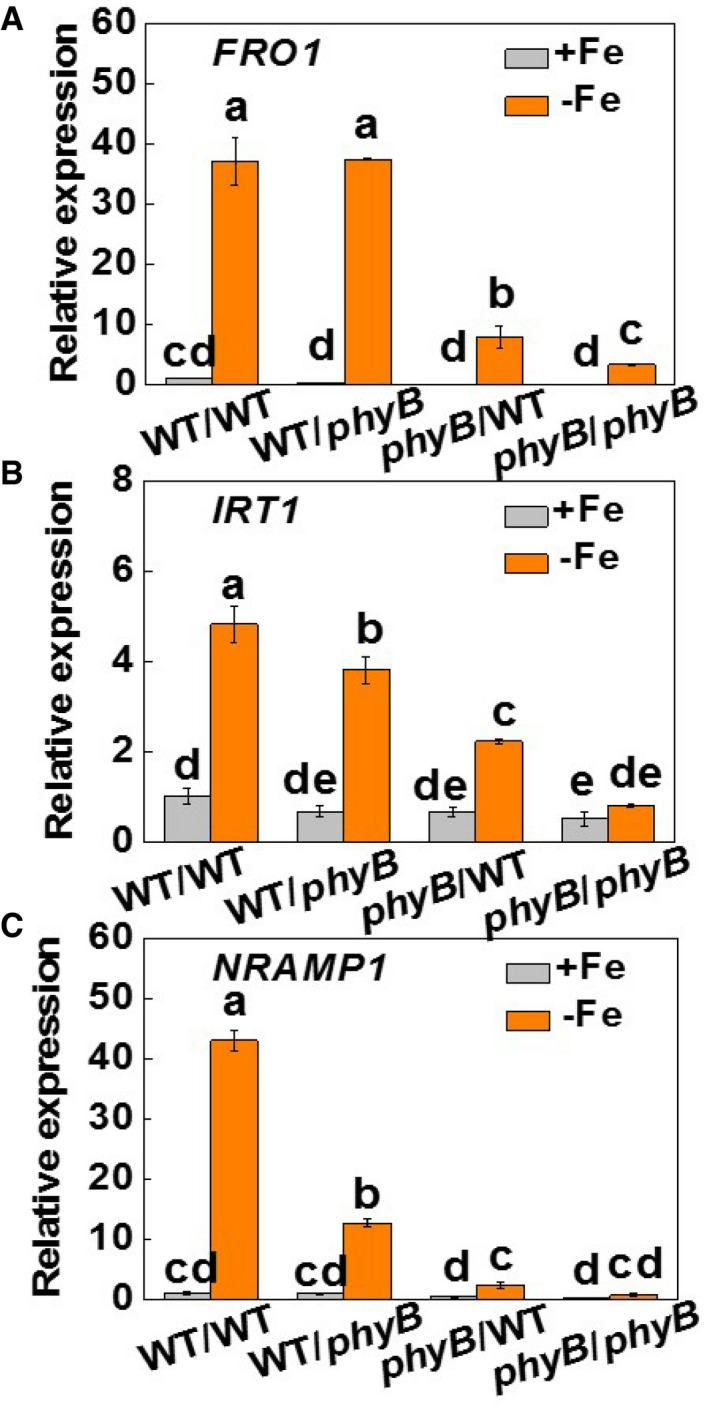
To determine the respective contributions of phyB in shoots and roots to Fe uptake, WT plants at 2‐leaf stage were reciprocally grafted with the phyB1B2 (phyB) mutants. The grafted plants were allowed to grow under 20 μM or 2 μM Fe conditions for 7 days. Compared to the self‐grafted WT plants (WT/WT), plants with phyB as rootstock (WT/phyB) or scion (phyB/WT) or both (phyB/phyB) showed decreased Fe accumulation, together with lower values of Y(I) and Y(II) under both Fe supply levels (Figs 2A and EV1A and B). Crucially, the decreases in Fe concentration and the Y(I) and Y(II) values were lower in the WT/phyB plants and greater in the phyB/WT and phyB/phyB grafts than in the WT/WT plants. In addition, the low Fe supply induced significant increases in the levels of FER, FRO1, IRT1, and NRAMP1 transcripts and in FCR activity in the WT/WT plants. This increase was attenuated in the WT/phyB plants and was greatly diminished in the phyB/WT and phyB/phyB plants respectively (Figs 2B and C, and EV2A–C). Therefore, light‐induced Fe uptake is dependent on the expression of PHYB in the shoots, but not in the roots.
Figure 2. Shoot phyB plays an important role in Fe uptake and photosynthetic electron transport in leaves.
-
A–CFe contents of whole plants, FER expression in roots, and relative FCR activities in the roots of plants grown under Fe‐sufficient (20 µM, +Fe) or Fe‐deficient (2 µM, −Fe) conditions for 7 days. The phyB1B2 (phyB) mutants and wild‐type (WT) plants were reciprocally grafted and grown hydroponically under white light.
-
D–FFe contents of whole plants, FER expression in roots and relative FCR activities in the roots of plants grown under Fe‐sufficient (20 µM, +Fe) or Fe‐deficient (2 µM, −Fe) conditions for 7 days. Plants were exposed to high (H‐, 2.0) or low (L‐, 0.5) red (R) to far‐red (FR) ratios.
Data information: Values are the means ± SD, n = 4 (biological replicates), P < 0.05 (Tukey's test).
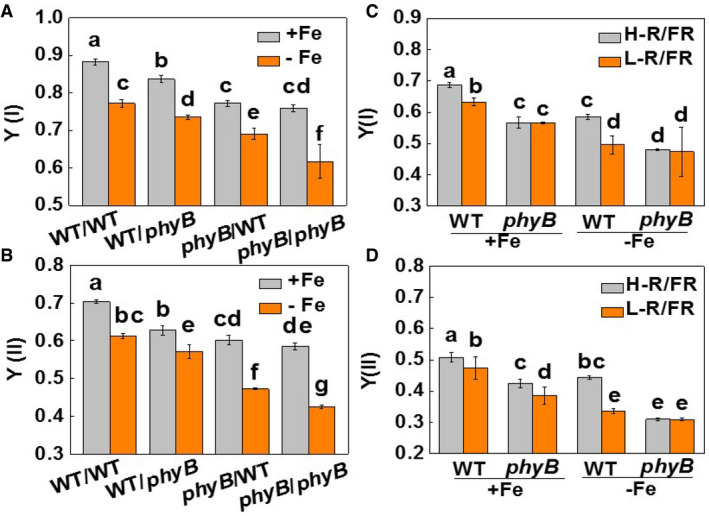
Figure EV1. The role of phyB in the light quality regulation of PSI and PSII [Y(II) and Y(I)].
-
A, BThe photochemical efficiencies of PSI and PSII [Y(I) and Y(II)] in young leaves of plants grown under Fe‐sufficient (20 µM, +Fe) or Fe‐deficient (2 µM, −Fe) conditions for 7 days. The phyB1B2 (phyB) mutants and wild‐type (WT) plants were reciprocally grafted and grown hydroponically under white light.
-
C, DThe photochemical efficiencies of PSI and PSII [Y(I) and Y(II)] in young leaves of plants grown under Fe‐sufficient (20 µM, +Fe) or Fe‐deficient (2 µM, −Fe) conditions for 7 days. The phyB1B2 (phyB) mutants and wild‐type (WT) plants were exposed to high (H‐, 2.0) or low (L‐, 0.5) red (R) to far‐red (FR) ratios.
Data information: Values are the means ± SD, n = 4 (biological replicates), P < 0.05 (Tukey test)
Figure EV2. Shoot phyB is important for the expression of iron deficiency response genes in roots.
-
A–CFRO1, IRT1, and NRAMP1 expression in roots of plants grown under Fe‐sufficient (20 µM, +Fe) or Fe‐deficient (2 µM, −Fe) conditions for 7 days. The phyB1B2 (phyB) mutants and wild‐type (WT) plants were reciprocally grafted and grown hydroponically under white light (200 µmol m−2 s−1).
Data information: Values are the means ± SD, n = 4 (biological replicates), P < 0.05 (Tukey test).
We next examined the phyB‐mediated light quality regulation of Fe uptake by growing WT and phyB plants under either high (H, 2) or low (L, 0.5) red [R, (660 nm) /far‐red [FR, (720 nm)] ratios. The L‐R/FR growth conditions decreased Fe accumulation, Y(I) and Y(II), the levels of FER, FRO1, and IRT1 transcripts, and FCR activities under both Fe‐sufficient and insufficient conditions in the WT plants (Figs 2D–F and EV1C and D, and Appendix Fig S4). However, L‐R/FR‐induced decreases in these parameters were attenuated or abolished in the phyB mutants.
HY5 is essential for tolerance to phyB‐regulated iron deficiency
The light‐dependent activation of phyB increases the accumulation of HY5 at both the transcriptional and protein levels in Arabidopsis (Osterlund et al, 2000; Lee et al, 2016). Consistent with these observations, the levels of HY5 mRNAs were lower in the shoots of the phyB/WT and phyB/phyB plants than in those of the WT/WT and WT/phyB plants under Fe‐sufficient conditions (Fig 3A). Crucially, Fe deficiency induced a significant increase in the abundance of HY5 transcripts only in the shoots of the WT/WT and WT/phyB plants. This increase was absent from the phyB/WT and phyB/phyB shoots (Fig 3A). In comparison, lower levels of HY5 transcripts were measured in the roots of the WT/phyB and phyB/phyB plants at both Fe supply levels (Fig 3B). Ultimately, there was a larger accumulation of the HY5 protein in the leaves and roots of the WT/WT and WT/phyB plants, compared to the phyB/WT and phyB/phyB leaves and roots at both Fe supply levels (Fig 3C). Therefore, the expression of PHYB in shoots plays a more crucial role in the HY5 accumulation than PHYB expression in the roots.
Figure 3. HY5 gene expression is influenced by phyB and the movement of HY5.
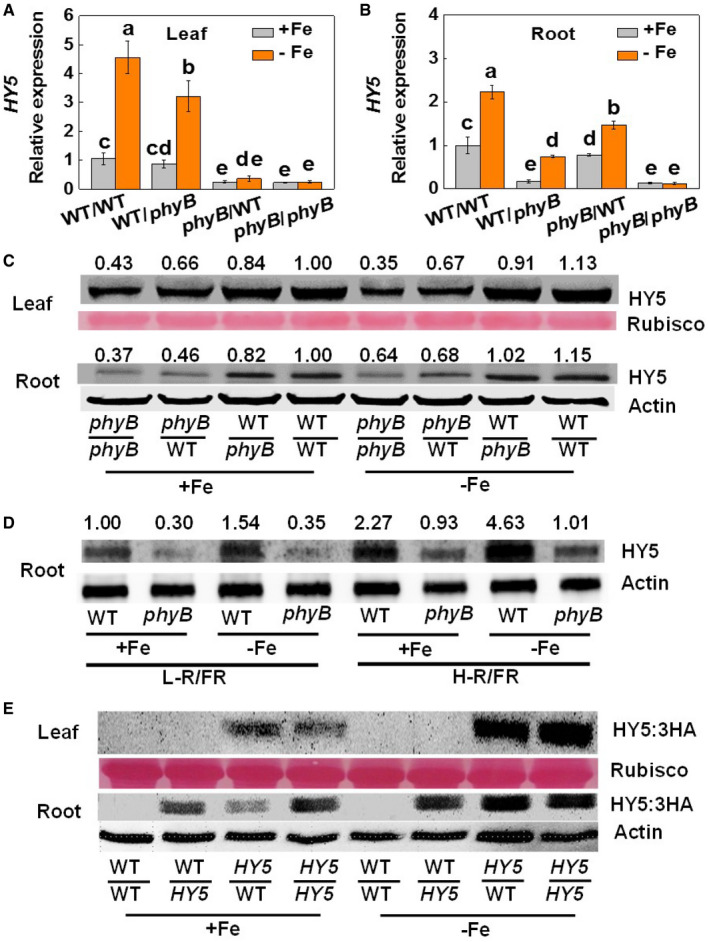
- Levels of HY5 transcripts in leaves of reciprocal grafts of phyB1B2 (phyB) and wild‐type (WT) tomato plants grown under white light (200 µmol m−2 s−1) for 7 days.
- Levels of HY5 transcripts in roots of reciprocal grafts of phyB1B2 (phyB) and wild‐type (WT) tomato plant grown under white light (200 µmol m−2 s−1) for 7 days.
- Accumulation of HY5 protein in leaves and roots of reciprocal grafts of phyB and WT plants grown under white light (200 µmol m−2 s−1) for 7 days. Rubisco and β‐Actin were used as loading controls for leaves and roots in the Western blot analysis, respectively. The values shown above each lane indicate the relative abundance of the HY5 protein.
- Accumulation of HY5 protein in the roots of WT and phyB plants under high (H, 2.0) or low ratio of (L, 0.5) red (R) to far‐red (FR) light conditions. β‐Actin was used as loading controls in the Western blot analysis. The values shown above each lane indicate the relative abundance of the HY5 protein.
- Accumulation of HY5:3HA protein in leaves and roots of reciprocal grafts involving HY5‐OE and WT plants grown under white light (200 µmol m−2 s−1) for 7 days. Rubisco and β‐Actin were used as loading controls for leaves and roots in the Western blot analysis, respectively.
Data information: In (A, B), values are the means ± SD, n = 4 (biological replicates), P < 0.05 (Tukey's test). +Fe: 20 µM Fe‐EDTA; −Fe: 2 µM Fe‐EDTA.
Source data are available online for this figure.
We also determined the accumulation of HY5 protein in the roots of the WT and the phyB mutants under L‐R/FR and H‐R/FR at both Fe supply levels. The phyB mutants had a lower level of HY5 accumulation in the roots under both light quality conditions at both Fe supply levels (Fig 3D). Crucially, while a decrease in the R/FR ratio from 2.0 to 0.5 diminished the accumulation of the HY5 protein in the WT roots, it had little effect on HY5 accumulation in the phyB roots. In addition, the HY5 accumulation induced by a low Fe supply was lower in the phyB roots that those of the WT roots.
Given the greater accumulation of HY5 in the roots of the WT/phyB plants relative to the phyB/phyB mutants, we next investigated whether this response is linked to changes in HY5 transport from the leaves. For these studies, reciprocally grafting between the WT and HY5 overexpressing plants containing a HA tag as scions or rootstocks were grown under Fe‐sufficient or Fe‐deficient conditions (Fig 3E). HY5 overexpressing lines were generated by the constitutive overexpression of the 3HA‐tagged HY5 protein under the control of the 35S promoter. The HA‐tagged HY5 protein was undetectable in the leaves of the WT/WT and WT/HY5 plants, regardless of the Fe level supplied (Fig 3E). In comparison, the HA‐tagged HY5 protein was detectable in both the leaves and the roots of the HY5/WT and self‐grafted HY5 plants (HY5/HY5). These results strongly suggest that HY5 is transported from the leaves to roots. However, HY5 cannot be transported from roots to shoots.
HY5 activates FER expression in the phyB‐regulated iron deficiency tolerance pathway
To examine the role of HY5 in Fe uptake and in the regulation of PSI and PSII electron transport, we prepared reciprocally grafts between HY5‐RNAi (hy5), WT, and HY5‐OE (HY5) plants. The levels of HY5 transcripts were decreased by 83.1% in the hy5 leaves compared to the WT. Conversely, the levels of HY5 transcripts were increased by 25.6‐fold in the HY5 leaves relative to the WT (Appendix Fig S5A). There was a decrease in the accumulation of HY5 protein in the hy5 leaves relative to the WT and an increase in HY5 protein accumulation in the HY5 leaves relative to the WT. The extent of HY5 protein accumulation was lower in the leaves of the hy5 and WT plants at night compared to the daytime levels. However, no day/night differences in HY5 protein accumulation were observed in the HY5 plants (Appendix Fig S5B).
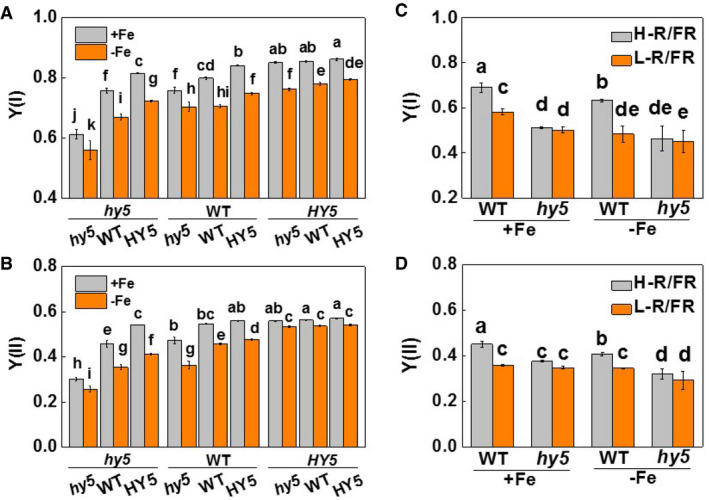
The plants with hy5 as the scion or rootstock had lower SPAD values than the plants with WT as scion or rootstock. In contrast, plants with HY5 as scion or rootstock had higher SPAD values than the WT. These differences were most marked under Fe insufficient conditions (Appendix Fig S6A and B). The plants with hy5 as the scion or rootstock showed lower Fe accumulation, with lower Y(I) and Y(II) values than the plants with WT as the scion or rootstock under Fe‐deficient and Fe‐sufficient conditions (Fig 4A and EV3A and B). Conversely, the plants with HY5 as scion or rootstock had a greater level of Fe accumulation with higher Y(I) and Y(II) values than the plants with WT as the scion or rootstock under similar nutritional conditions. Notably, the hy5/WT plants accumulated less Fe with lower values of Y(I) and Y(II) than the WT/hy5 plants. Consistent with these observations, plants with hy5 as scion or rootstock had lower levels of FER, FRO1, IRT1, and NRAMP1 transcripts, and FCR activities than those with WT as the scion or rootstock under Fe‐deficient and Fe‐sufficient conditions (Figs 4B and C, and EV3A and B, and EV4A–C). In contrast, these parameters were increased when HY5 was used as the scion or rootstock compared to the values obtained when the WT was used as the scion or rootstock under similar conditions. Furthermore, the abundance of HY5 transcripts in the shoots had a greater impact on the levels of FER, FRO1, IRT1, and NRAMP1 transcripts and on FCR activities than HY5 transcript levels in the roots, as indicated by the lower FER transcript level and FCR activities of the roots of the hy5/WT plants relative to the WT/hy5 plants (Figs 4B and C, and EV3A and B, and EV4A–C). These results strongly suggest that the abundance of HY5 transcripts in the shoots makes a major contribution to Fe uptake. We also examined the responses of Fe uptake in the WT and hy5 plants to changes in light quality. Similar to that in Fig 2, Fe accumulation, Y(I) and Y(II) values, the levels of FER, FRO1, and IRT1 transcripts and FCR activities were lower in the WT plants under L‐R/FR conditions, regardless of the Fe supply (Figs 4D–F and EV3C and D, and Appendix Fig S7). However, the effects of L‐R/FR ratios on Fe accumulation, Y(I) and Y(II) values, the abundance of FER, FRO1, and IRT1 transcripts and FCR activities were low or abolished in the hy5 plants.
Figure 4. HY5 plays an important role in light‐regulated Fe uptake in tomato plants.
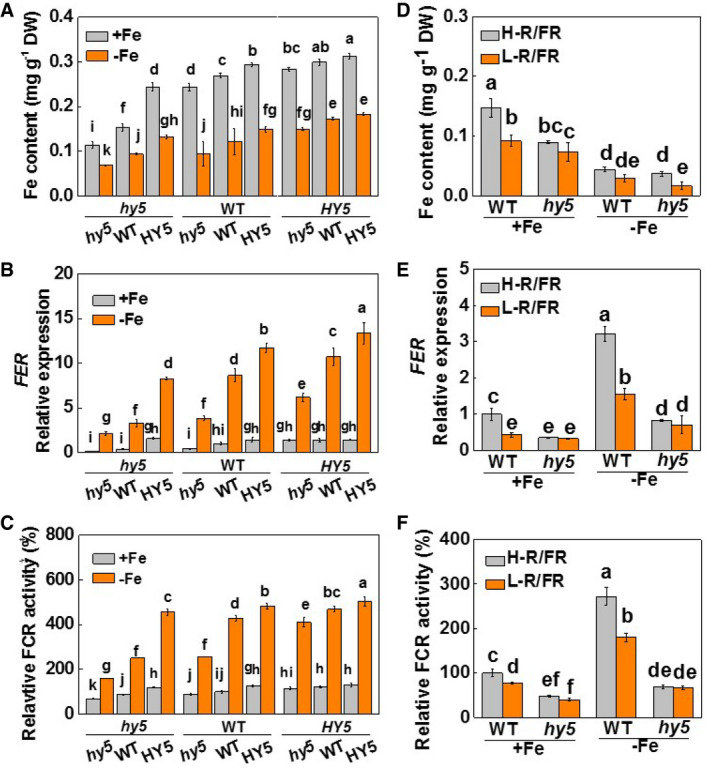
- Fe content of whole plants. Plants with reciprocal grafts of wild‐type (WT), HY5‐RNAi (hy5), and HY5‐overexpression (HY5) were hydroponically grown under white light conditions with either Fe‐sufficient (20 µM, +Fe) or Fe‐deficient (2 µM, −Fe) conditions for 7 days.
- FER expression in roots. Plants with reciprocal grafts of wild‐type (WT), HY5‐RNAi (hy5), and HY5‐overexpression (HY5) were hydroponically grown under white light conditions with either Fe‐sufficient (20 µM, +Fe) or Fe‐deficient (2 µM, −Fe) conditions for 7 days.
- Relative FCR activities in roots. Plants with reciprocal grafts of wild‐type (WT), HY5‐RNAi (hy5), and HY5‐overexpression (HY5) were hydroponically grown under white light conditions with either Fe‐sufficient (20 µM, +Fe) or Fe‐deficient (2 µM, −Fe) conditions for 7 days.
- Fe content of whole plants. WT and hy5 plants were grown under high (H) or low ratios of (L) red (R) to far‐red (FR) light conditions with either Fe‐sufficient (20 µM, +Fe) or Fe‐deficient (2 µM, −Fe) conditions for 7 days.
- FER expression in roots. WT and hy5 plants were grown under high (H) or low ratios of (L) red (R) to far‐red (FR) light conditions with either Fe‐sufficient (20 µM, +Fe) or Fe‐deficient (2 µM, −Fe) conditions for 7 days.
- Relative FCR activities in roots. WT and hy5 plants were grown under high (H) or low ratios of (L) red (R) to far‐red (FR) light conditions with either Fe‐sufficient (20 µM, +Fe) or Fe‐deficient (2 µM, −Fe) conditions for 7 days.
Data information: Values are the means ± SD, n = 4 (biological replicates), P < 0.05 (Tukey's test).
Figure EV3. Changes of PSI and PSII [Y(II) and Y(I)] as influenced by HY5 and light quality.
-
A, BThe photochemical efficiencies of PSI and PSII [Y(I) and Y(II)] in young leaves of plants grown under Fe‐sufficient (20 µM, +Fe) or Fe‐deficient (2 µM, −Fe) conditions for 7 days. Plants with reciprocal grafts of wild‐type (WT), HY5‐RNAi (hy5), and HY5‐overexpression (HY5) were hydroponically grown under white light conditions.
-
C, DThe photochemical efficiencies of PSI and PSII [Y(I) and Y(II)] in young leaves of plants grown under Fe‐sufficient (20 µM, +Fe) or Fe‐deficient (2 µM, −Fe) conditions for 7 days. WT and hy5 plants were exposed to high (H‐, 2.0) or low (L‐, 0.5) red (R) to far‐red (FR) ratios.
Data information: Values are the means ± SD, n = 4 (biological replicates), P < 0.05 (Tukey test).
Figure EV4. Role of HY5 in the regulation of Fe uptake‐related genes in the roots of tomato plants.
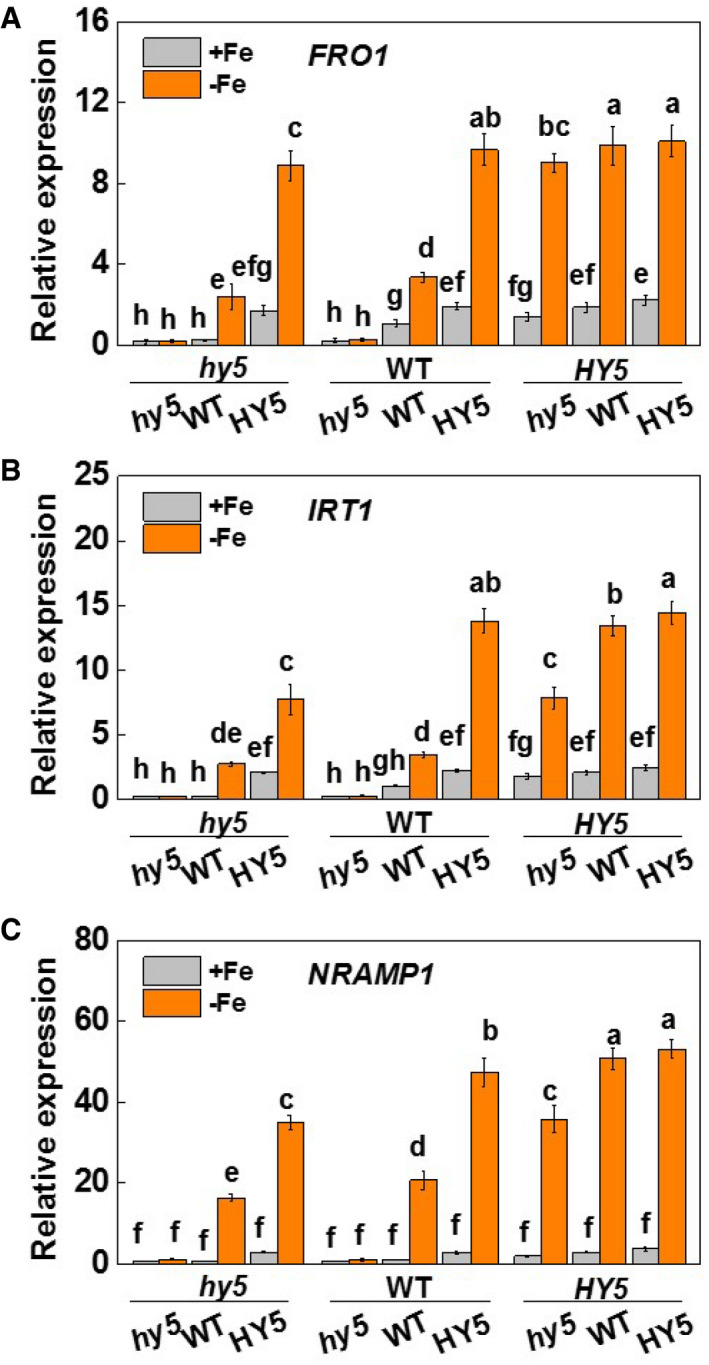
-
A–CFRO1, IRT1, and NRAMP1 expression in roots. Plants with reciprocal grafts of wild‐type (WT), HY5‐RNAi (hy5), and HY5‐overexpression (HY5) were hydroponically grown under white light conditions with either Fe‐sufficient (20 µM, +Fe) or Fe‐deficient (2 µM, −Fe) conditions for 7 days.
Data information: Values are the means ± SD, n = 4 (biological replicates), P < 0.05 (Tukey test).
Acting as a transcription factor, HY5 activates the expression of target genes by directly binding to the ACE motifs in the promoter regions (Shin et al, 2007; Stracke et al, 2010). Sequence analysis showed that the promoter of the FER gene contains ACE (ACGT‐containing element) motifs (Fig 5A and B). EMSA analysis showed that the HY5 protein binds to the ACE motifs of the FER promoter. When the motif was deleted, the HY5 protein lost the ability to bind to the mutated oligonucleotide (Fig 5C). To examine the ability of HY5 to bind to the promoter of FER gene in vivo, we subjected the transgenic OE‐HY5‐3HA plants and WT plants to Fe deficiency for one week. We then performed ChIP‐qPCR experiment using an anti‐HA antibody or an anti‐IgG antibody as a negative control. ChIP‐qPCR analysis of the immunoprecipitated HY5‐3HA products using the anti‐HA antibody shows an enrichment of the fragments containing the ACE motif in the FER promoter in the HY5 overexpressing lines of about 4.5‐fold compared to the WT plants. In contrast, the IgG control antibody failed to pull down the promoter DNA segments and anti‐HA antibody failed to pull down the exon fragment of FER (Fig 5D and E). These findings suggest that HY5 binds to the FER promoter at the site containing the ACE motifs.
Figure 5. HY5 acts as a transcriptional regulator of FER expression.
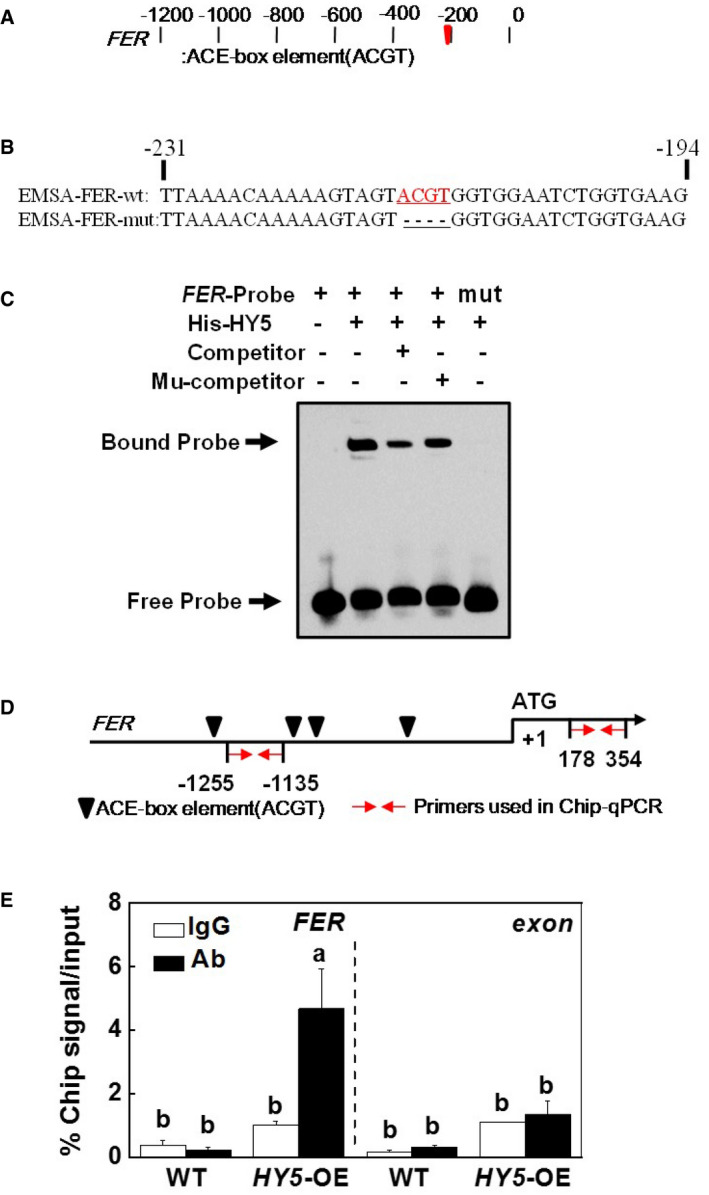
-
A, BThe ACE‐box elements in the promoter of tomato FER gene and oligonucleotides were used in electrophoretic mobility shift assays. Numbering is from predicted transcriptional start sites. The FER probe contained one ACE‐box (FER‐wt), whereas in the FER‐mut probe the ACE‐box core sequence was mutated. The wild‐type (WT) and mutated ACE‐box sequences are underlined. The mutated bases were indicated in red.
-
CHY5 directly binds to the ACE‐box of FER promoter in vitro. Recombinant HY5 was purified from E. coli cells and used for DNA binding assays with probes of FER‐wt, and FER‐mut. The protein purified from empty vector was used as the negative control. One thousand‐fold excess of unlabeled probe was used for competition. WT and HY5‐OE plants were exposed to white light (200 µmol m−2 s−1) grown under Fe‐deficient (2 µM, −Fe) conditions for 7 days.
-
DSchematic diagram of the promoters of the indicated genes. Black triangles indicate the ACE‐box. Red arrows indicate primers used for ChIP‐qPCR assays. The translational start site (ATG) is shown at position +1.
-
EDirect binding of HY5 to the FER promoter analyzed using ChIP‐qPCR in 35S‐HY5‐3HA‐overexpressing (HY5‐OE) tomato plants. WT and HY5‐OE plants were exposed to white light (200 µmol m−2 s−1) grown under Fe‐deficient (2 µM, −Fe) conditions for 7 days. Input chromatin was isolated from root samples at 7 days. The epitope‐tagged HY5‐chromatin complex was immunoprecipitated with an anti‐HA antibody. A control reaction was processed side‐by‐side using mouse IgG. Input and ChIP DNA samples were quantified by RT–qPCR using primers specific for the promoter and exon fragment of the FER gene as indicated in (D). The ChIP results are presented as percentage of the input DNA.
Data information: In (E), values are the means ± SD, n = 4 (biological replicates), P < 0.05 (Tukey's test).
Source data are available online for this figure.
FER mediates light regulation of iron utilization
To provide further proof of the role of FER in light quality‐regulated Fe uptake, we generated grafted plants incorporating fer mutants or the WT as the rootstocks, respectively. These lines were then grown under either H‐R/FR or L‐R/FR conditions. The WT/fer plants exhibited chlorosis especially under Fe‐deficient conditions (Appendix Fig S8A and B). The WT/WT plants had higher SPAD values, Fe contents, Y(I) and Y(II) values, together with higher levels of root FER, FRO1, and IRT1 transcripts and FCR activities than the WT/fer plants (Fig 6A–F and Appendix Fig S8A–C). Crucially, a decrease in the R/FR ratios of the growth environment only decreased these parameters in the WT/WT plants but not in the WT/fer plants (Fig 6A–F and Appendix Fig S8A–C). These observations suggest that FER is essential for light quality‐regulated Fe uptake and associated changes in photosynthetic electron transport capacities.
Figure 6. Mutations in FER abolish light quality‐regulated Fe deficiency‐induced responses.
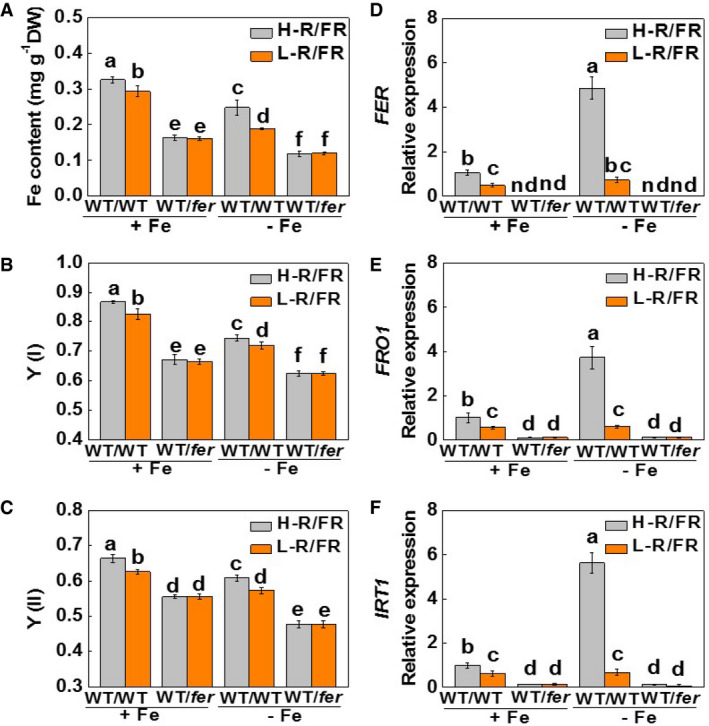
-
A–CFe content of whole plants (A) and the photochemical efficiencies of PSI and PSII [Y(I) and Y(II)] (B and C) in young leaves of grafted tomato plants with grafts between WT/WT and WT/fer grown under H‐R/FR (2.0) or L‐R/FR (0.5) conditions for 7 days.
-
D–FTranscript levels of FER, FRO1, and IRT1 in the roots of grafted tomato plants with grafts between WT/WT and WT/fer grown under H‐R/FR (2.0) or L‐R/FR (0.5) conditions for 7 days.
Data information: Values are the means ± SD, n = 4 (biological replicates), P < 0.05 (Tukey's test). +Fe: 20 µM Fe‐EDTA; −Fe: 2 µM Fe‐EDTA.
PhyB‐dependent activation of Fe uptake is linked to Fe accumulation in fruit
Many greenhouse crops are produced during the fall and winter months, which are characterized by short‐day conditions. To determine whether the length of exposure to red light regulates Fe uptake and its accumulation in tomato fruit, we exposed WT and phyB1B2 (phyB) plants (grown in either nutrient solution or in soil) to two light conditions: 8‐h white light/16‐h dark or 8‐h white light plus 6‐h red light/10‐h dark (Fig EV5A). Red light was supplied at an intensity of 20 μmol m−2 s−1. Exposure to red light during the night led to increased HY5 accumulation, together with significant increases in the accumulation of FER, IRT1, FRO1, and NRAMP1 transcripts and increased FCR activity in the roots of the WT plants. These effects were, however, attenuated in the phyB mutants (Figs 7A–C and EV5B). In agreement with these observations, the fruits from the phyB plants accumulated less Fe and the decrease in Fe content was about 40.4% under the 8‐h light regime (Fig 7D). Exposure to red light during the dark period increased fruit Fe accumulation by 67.9% in the WT fruits and 44.7% in the phyB fruits, respectively.
Figure EV5. Effect of supplementary red light on the transcript of FRO1, IRT1, and NRAMP1, and the activity of FCR in the roots of WT and phyB plants.
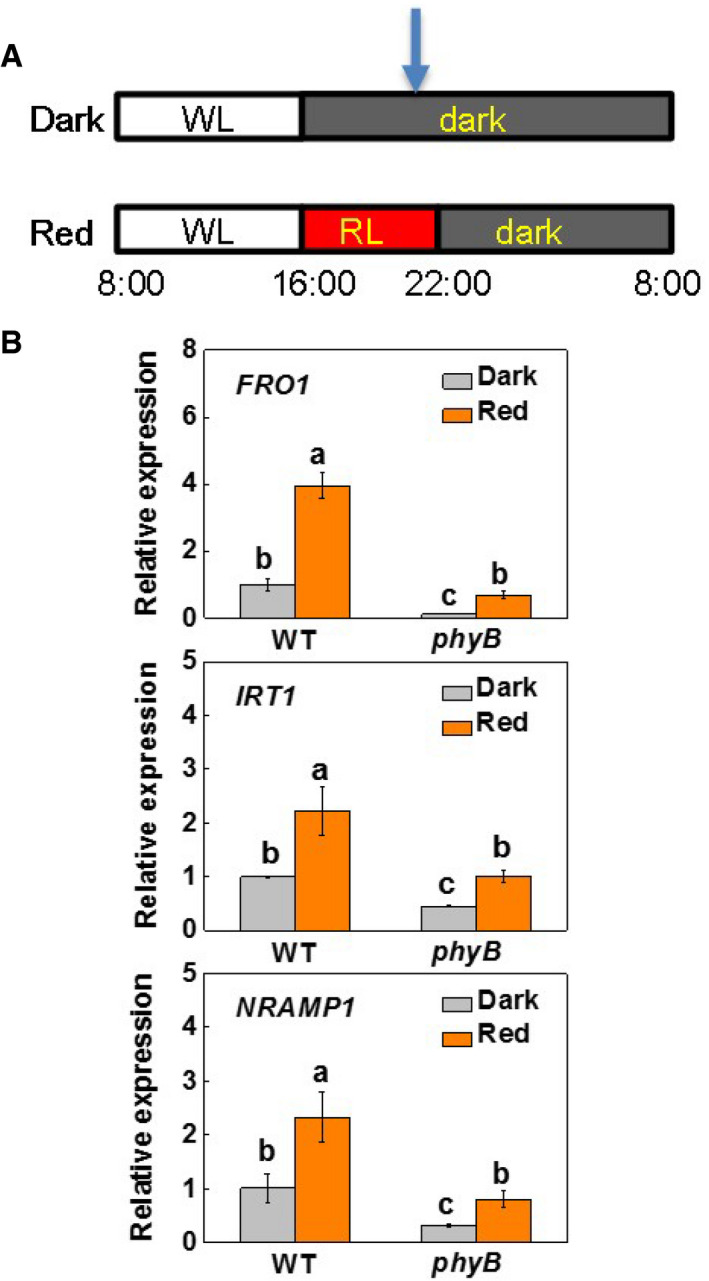
- A schematic for the experiment. WL, white light; RL, red light (660 nm at 20 μmol m−2 s−1). Arrow indicates the sampling time for biochemical analysis.
- Transcript of FRO1, IRT1, and NRAMP1 in roots WT and phyB1B2 (phyB) plants grown under 20 μM Fe‐EDTA in nutrient solution in a growth room. Dark: 8‐h white light (8 AM–4 PM); Red: 8‐h white light plus supplementary red light (660 nm at 20 μmol m−2 s−1) for 6 h at 4 PM–10 AM. Root samples were taken at 22:00 for the determination after 7 days of the onset of the experiment.
Data information: Values are the means ± SD, n = 4 (biological replicates), P < 0.05 (Tukey test).
Figure 7. Exposure to red light at night is linked to Fe accumulation in tomato fruits.
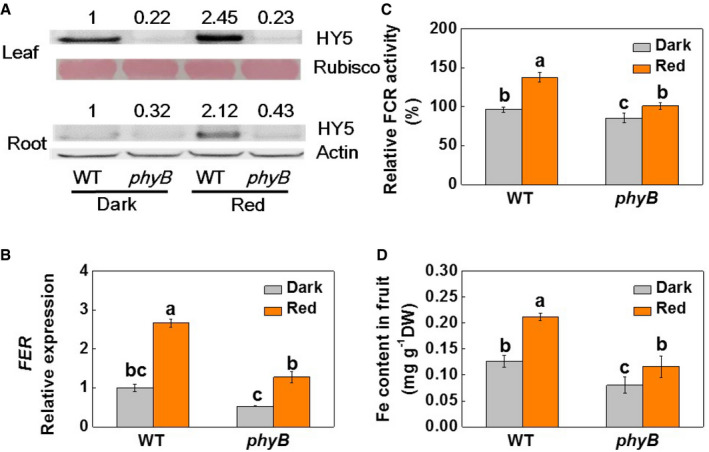
- Accumulation of the HY5 protein in WT and phyB1B2 (phyB) plants grown under 20 μM Fe‐EDTA in nutrient solution in a growth room. Rubisco and β‐Actin were used as loading controls for leaves and roots in the Western blot analysis, respectively. The values shown above each lane indicate the relative abundance of the HY5 protein.
- The abundance of FER transcripts in the roots of WT and phyB plants grown under 20 μM Fe‐EDTA in nutrient solution in a growth room.
- The relative FCR activities in the roots of WT and phyB plants grown under 20 μM Fe‐EDTA in nutrient solution in a growth room.
- Fe content in the fruits of WT and phyB plants. Plants were grown in soil in a greenhouse.
Data information: Dark: 8‐h white light (8 AM–4 PM); Red: 8‐h white light plus supplementary red light (660 nm at 20 μmol m−2s−1) from 6 h at 4 PM–10 AM. Values are the means ± SD, n = 4 (biological replicates), P < 0.05 (Tukey's test).
Source data are available online for this figure.
Discussion
Shoot and root communication is essential for plants to adapt to the changes in environment conditions. Both grafting experiments with brz or dgl mutant and split root experiments have supported putative role of shoot‐to‐root communication in Fe acquisition in addition to the local signal present at the roots (Welch & LaRue, 1990; Grusak & Pezeshgi, 1996; Schikora & Schmidt, 2001; Vert et al, 2003). However, the nature of the long‐distance signals generated in shoots has remained unclear. Here, we demonstrate that red light‐activated and phyB‐induced responses result in the accumulation of HY5. The movement of HY5 from the leaves to roots activates the expression of FER leading to the accumulation of downstream transcripts such as FRO1, IRT1, and NRAMP1. This process is pivotal for the orchestration of Fe uptake activities in tomato. In agreement with the proposed role of phyB, prolonged exposure to red light significantly increased HY5 accumulation in roots, together with increased Fe accumulation in the fruit. These findings provide novel insights into the critical role of light quality signaling in the regulation of Fe acquisition. Furthermore, these findings provide a step‐change in our current understanding that will drive future applications of light quality treatments designed to improve Fe utilization by crops and accumulation in edible organs, making a significant contribution to the improvement of human Fe nutrition.
We have provided evidence that light‐induced Fe uptake is phyB‐dependent. We have shown that Fe uptake is light responsive in tomato such that higher Fe uptake and accumulation, enhanced levels of FER, FRO1, IRT1, and NRAMP1 transcripts and higher FCR activities occur during the day than at night (Fig 1A and B, Appendix Fig S1). The expression of IRT1 is under the circadian control in Arabidopsis (Salome et al, 2013). However, this type of circadian regulation was not observed in tomato (Appendix Fig S2A and B). In contrast, we found that the levels of Fe‐responsive transcripts were regulated by light, suggesting that the long history of artificial selection/domestication of tomato has resulted in the loss of the circadian clock control. Likewise, during their domestication and spread from Equatorial South America, circadian rhythms of tomatoes have been modified, resulting in tomato plants that are adapted to growing under the long day conditions characteristic of summers at higher latitudes (Muller et al, 2016). Crucially, phyB1 mutants have lower Fe contents and FCR activities than the WT. In contrast, the phyA, phyB2, and cry1 mutants had similar or slightly lower Fe contents and FCR activities to the WT plants (Fig 1C and D). In agreement with a putative role of phyB in Fe uptake, the positive effects of H‐R/FR and long day on Fe accumulation, the levels of transcripts encoding several Fe uptake‐related proteins such as FER, FRO1, and IRT1, FCR activities and the electron transport rates through PSII and PSI were observed in WT but not in the phyB mutants (Figs 2D–F and 7B–D, and EV5B, and Appendix Fig S4). These datasets provide convincing evidence in support of the critical role of phyB in Fe uptake responses. Recently, phyB was shown to play a role in phosphorus acquisition in Arabidopsis (Sakuraba et al, 2018). It is worth noting that phyB is present in both shoots and roots (Sharrock & Clack, 2002). In addition to the activation of phyB‐associated pathways in the shoots, phyB in roots could be activated by light piped from the shoots through the stem (Lee et al, 2016). However, the data obtained from the grafting experiments reported here revealed that phyB in the shoots is more relevant to Fe uptake than the phyB in the roots (Figs 2A–C and EV2A–C). This finding suggests that the long and winding stems or roots of the tomato plants prevent the transmission of red light from the shoots to roots. The low levels of Fe uptake observed under low R/FR ratios also suggest that the upper canopy sun leaves, which receive higher R/FR ratios than lower leaves, play an important role in the regulation of Fe uptake in natural environments.
We have also presented data showing that phyB‐activated HY5 production functions as a systemic signal that activates Fe uptake in the roots. PhyB enhances HY5 activity at both the transcriptional and protein levels during photomorphogenesis (Lee et al, 2016). HY5 is a mobile plant protein and could move from shoot to root (Chen et al, 2016). Meanwhile, it is degraded by COP1 at night (Srivastava et al, 2015). Consistent with these concepts, we have shown that the accumulation of HY5 transcripts and protein was decreased in the leaves and roots of grafted plants, where phyB was used as either the scion or rootstock (Fig 3A–D). Our analysis of the transgenic plants constitutively expressing 3HA‐tagged HY5 confirms that the movement of the HY5 protein is basipetal in direction. Hence, HY5 moves from the leaves to the roots but not in the opposite direction (Fig 3E). Crucially, we have presented data demonstrating that HY5 plays a key role in the regulation of Fe uptake by participating in the transcriptional activation of FER expression. The data from the in vivo and in vitro assays presented here demonstrate that HY5 is the activator of FER expression by directly binding to the FER promoter (Fig 5). In addition, we have shown that FER transcripts, transcripts of downstream genes such as FRO1, IRT1, NRAMP1, and FCR activities were decreased in the hy5/hy5 plants compared to the WT/WT plants (Fig 4B and C, and EV4A–C). In agreement with these observations, we have shown that modulating the R/FR ratios in the growth environment altered Fe uptake in the WT/WT plants but had little effect in the hy5 mutants or the WT/fer plants. These findings suggest that HY5‐FER mediates light‐regulated Fe uptake in the roots (Fig 4D–F). Moreover, the Fe contents and the abundance of FER transcripts decreased in the descending order of the WT/WT, WT/hy5, hy5/WT, and hy5/hy5, respectively (Fig 4A and B). These findings demonstrate that HY5 expression in both shoots and roots participates in the regulation of Fe uptake, with the shoot‐dependent induction of HY5 expression being the most important factor. Similar to the WT/phyB plants, the WT/hy5 plants showed high levels of Fe uptake, a greater accumulation of FER transcripts, together with a greater abundance of downstream transcripts such as FRO1, IRT1, and NRAMP1 and higher FCR activities than those observed in the hy5/WT plants (Figs 4A–C, and EV4A–C). Therefore, the phyB‐dependent activation of HY5 accumulation in the shoots results in HY5 movement to the roots. This process plays a more important role in Fe uptake than changes in HY5 in the roots per se.
Recently, Grillet et al, (2018) demonstrated that IRON MAN, a ubiquitous family of peptides, plays a role in the Fe transport in plants. Meanwhile, Fe acquisition is controlled by a series of regulatory events representing a hierarchical cascade of mainly bHLH‐family transcription factors such as POPEYE (PYE), BRUTUS (BTS), iron‐related transcription factor (IRO), and IAA‐LEUCINE RESISTANT3 (ILR3) (Long et al, 2010; Yin et al, 2013; Selote et al, 2015; Gao et al, 2020). Interestingly, all most all these genes are rich in the ACE motifs in the promoter regions that allows HY5 biding. Therefore, it is of great interest to study the relation of HY5 and peptides or these transcription factors in the light‐regulated Fe acquisition. HY5 has been shown to play a key role in the uptake and/or assimilation of nitrogen (N), sulfur (S), phosphate (P) and copper (Cu) in Arabidopsis (Lee et al, 2011; Zhang et al, 2014; Chen et al, 2016; Sakuraba et al, 2018). A critical question concerns how plants sense nutrient homeostasis in order to regulate nutrient uptake. In agreement with earlier observations, the present study has shown that Fe deficiency results in an increase in the levels of HY5, FER, FRO1, IRT1, and NRAMP1 transcripts, together with increases in FCR activity. However, we found that these processes are, at least in part, phyB‐dependent (Figs 1, 2, 3, and EV2A–C). Notably, the accumulation of FER, FRO1, IRT1, and NRAMP1 transcripts as a result of HY5 overexpression was mainly observed under Fe‐deficient conditions (Figs 4B and EV4A–C). This finding is in agreement with earlier observations that overexpression of FER is not sufficient to induce downstream responses in tomato (Brumbarova & Bauer, 2005). The tomato FER protein and its Arabidopsis homologue FIT function as a regulatory hub for Fe deficiency signaling. Both proteins are subject to post‐transcriptional regulation (Brumbarova & Bauer, 2005; Meiser et al, 2011; Sivitz et al, 2011). Physiological studies have demonstrated that the overexpressed FIT or FER proteins are not active under conditions of high Fe supply (Brumbarova & Bauer, 2005; Lingam et al, 2011; Cui et al, 2018). Therefore, it will be interesting to study how light signaling regulates the post‐translational controls of FER or FIT activity.
Photosynthesis is highly sensitive to Fe limitations because many of the metalloproteins present in the thylakoid electron transport chain contain Fe. For example, there are two to three Fe atoms per PSII, five per Cyt b6f, 12 per PSI, and two per ferredoxin molecule (Raven et al, 1999; Varotto et al, 2002). Consistent with this requirement, a low Fe supply decreased electron transport activity as indicated by the low Y(II) and Y(I) values observed under these conditions (Appendix Table S1). Moreover, the lower Fe accumulation observed in the phyB and hy5 mutants was accompanied by lower Y(II) and Y(I) values, in agreement with the concept that light‐regulated Fe uptake is crucial for photosynthetic electron transport through both PSII and PSI (Figs EV1 and EV3). The observed decreases in photosynthetic electron transport observed in these mutants are likely to be linked to an overall decrease in the photosynthetic capacity. Therefore, the phyB‐HY5 cascade reported here plays an important role in photosynthesis, partially through the regulation of Fe uptake.
An appropriate level of Fe accumulation is not only essential for the efficient operation of many physiological processes in plants, but also for human health. This is especially true of vegetables because they provide a main source of dietary iron (DellaValle et al, 2015; He et al, 2016). The data presented here demonstrate the operation of a phyB‐HY5‐regulated systemic signaling cascade, which plays a crucial role in Fe uptake by activating the expression of iron‐uptake‐related genes in the roots and associated Fe accumulation in the fruit (Fig 7). This study also highlights the potential for increasing Fe utilization efficiency by targeting the components of this novel systemic signaling pathway, especially for improvement of crop productivity on soils with low iron availability. In addition, we have demonstrated how manipulation of the light environment can be used to improve the iron nutrition of greenhouse vegetable crops. In practical, extending the exposure to low red light intensity at night is more feasible than modifying R/FR ratio in the day. This provides a new strategy for the biofortification of tomato and other vegetables using artificial LED lighting, particularly with recent developments in the LED industry.
Materials and Methods
Plant materials and growth conditions
Wild‐type tomato (Solanum lycopersicum “Ailsa Craig” and “Moneymaker”), the phytochrome A (phyA), phytochrome B1 (phyB1), phytochrome B2 (phyB2), phytochrome B1B2 (phyB1B2), and cryptochrome 1 (cry1) mutants in the cv Moneymaker background were obtained from the Tomato Genetics Resource Center (http://tgrc.ucdavis.edu). The iron‐inefficient mutant T3238 fer (Ling et al, 2002) and its wild‐type (WT) T3238 are the gifts from H.Q. Ling at Institute of Genetics and Developmental Biology, Chinese Academy of Sciences. HY5‐RNAi (hy5) and HY5 overexpressing (HY5‐OE or HY5) transgenic plants tagged HA in the cv Ailsa Craig background were generated as described previously (Wang et al, 2018).
To determine the role of both shoots and roots phyB and HY5 in light‐induced Fe uptake, WT and phyB1B2 (phyB) plants at 2 leaf stage were reciprocally grafted, which resulted in 4 combinations (scion/rootstock): WT/WT, phyB/WT, WT/phyB, and phyB/phyB. In the same way, nine types of reciprocal grafts between WT, HY5, and hy5 were generated, resulting in grafting seedlings designated as WT/WT, hy5/hy5, WT/hy5, HY5/hy5, hy5/WT, HY5/WT, hy5/HY5, WT/HY5, and HY5/HY5. To determine the role of FER in light‐induced iron deficiency tolerance, we created hetero‐grafts by grafting the WT (T3238) shoots onto roots of fer mutants (WT/fer). Homo‐grafts of WT/WT were used as controls. The grafted plants were transferred to growth chambers with the following environmental conditions: 12‐h photoperiod, temperature of 25/20°C (day/night), and PPFD of 200 µmol m−2 s−1.
Experimental design and treatments
Tomato plants were grown on Hoagland’s nutrient solution at a temperature of 25/20°C (day/night), a light intensity of 200 μmol m−2 s−1, and a 12‐h/12‐h day/night rhythm. At 4‐leaf stage, plants were grown in 2‐l black plastic buckets (3 plants per bucket) filled with aerated Hoagland’s nutrient solution containing different Fe concentrations. The first set of experiments (Experiment 1) were carried out to determine the effects of Fe concentration on plant growth. WT plants were supplied with five levels of Fe (0, 0.2, 2, 20, and 200 μM Fe‐EDTA) in the nutrient solutions, respectively. The second set of experiments (Experiment 2) were carried out to characterize diurnal variations in Fe uptake. Nutrient solutions were renewed every 6 h. The Fe absorption rate is defined as the change of iron content before and after treatment in the nutrient solution divided by the fresh weight of the roots and time. In addition, plants were exposed to three different photoperiods (12/12, 24/0, and 0/24 h) to determine the time course of changes in IRT1 transcript levels. The third set of experiments (Experiment 3) were carried out to compare the Fe absorption efficiency of different photoreceptor mutants, phyA, phyB1, phyB2, phyB1B2, and cry1. Plants were exposed to 2 μM Fe‐EDTA or 20 μM Fe‐EDTA, respectively. In addition, WT plants and phyB1B2 plants were sprayed with FeSO4·7H2O at a concentration of 0.4 mM under Fe‐sufficient condition. The spraying was repeated 7 times in total at an interval of 1 day before material was harvested for the measurement of chlorophyll and photosynthetic electron transport. The fourth set of experiments (Experiment 4) were performed to determine the role of phyB in Fe absorption in the shoots and roots. Plants were grafted in the following combinations: WT/WT, phyB/WT, WT/phyB, and phyB/phyB. They were grown in nutrient solution containing either 2 μM Fe‐EDTA or 20 μM Fe‐EDTA, respectively. In addition, WT and phyB plants were grown under different light quality regimes, i.e., high (H, 2) or low (L, 0.5) red (R, 660 nm) /far‐red (FR, 720 nm) ratios with 12‐h photoperiod for 7 days. These experiments were performed to examine the role of phyB in light quality‐dependent regulation of Fe uptake. The fifth set of experiments (Experiment 5) were carried out with WT/WT, hy5/hy5, WT/hy5, HY5/hy5, hy5/WT, HY5/WT, hy5/HY5, WT/HY5, and HY5/HY5 grafted plants to determine the contribution of HY5 to Fe absorption in the shoots and in the roots. In addition, the movement of the HY5 protein was analyzed in 3HA‐tagged HY5 plants. Furthermore, to examine the role of HY5 in light quality‐dependent regulation of Fe uptake, WT and hy5 plants were grown under different light quality regimes, i.e., high (H, 2) or low (L, 0.5) red (R, 660 nm) /far‐red (FR, 720 nm) ratios with 12‐h photoperiod for 7 days. The sixth set of experiments (Experiment 6) were carried out to determine the role of FER in light quality‐regulated Fe uptake. In these experiments, WT/WT and WT/fer plants were transferred at the 2‐leaf stage to either high (2.0) or low (0.5) R/FR ratios with Fe supplied at either 2 μM Fe‐EDTA or 20 μM Fe‐EDTA. The seventh set of experiments (Experiment 7) were conducted to examine the effects of the presence of R light during the photoperiod on the Fe accumulation in the fruits of WT and phyB1B2 plants. Plants were grown under 20 μM Fe‐EDTA in nutrient solutions in a growth chamber or in soil a greenhouse with 8‐h photoperiod (8 AM–4 PM) and temperature of 25/20°C (day/night). Half of the plants were supplied with R light at 660 nm at an intensity of 20 μmol m−2 s−1 at the top of the canopy from the evening for 6 h at 4 PM–10 PM. All the experiments were performed over 7 days, except for experiment 7. In this case, the hydroponic studies were performed for 7 days while the greenhouse experiments were performed over 3 months. Chl content was determined, and Chl fluorescence quenching analyses were performed at the end of all treatments. Leaf and root samples were then taken for the analysis for the biochemical parameters, the levels of transcripts, and for the determination of Fe accumulation.
Measurement of Chl content and Chl fluorescence
Chl was extracted from newly formed leaves in acetone, and the pigment content was determined using standard spectrophotometer assays (Shimadzu UV‐2600, Shimadzu, Japan). In addition, a chlorophyll meter (SPAD‐502; Minolta, Japan) was used for the rapid assessment of Chl levels. The maximal photochemical efficiencies of PSII (Fv/Fm) and the photochemical efficiencies of the photosystems [Y(I),Y(II)] were measured together with the electron transport rate [ETR(I), ETR(II)] through PSI and PSII using a Dual PAM‐100 system (Heinz Walz, Effeltrich, Germany) (Yuan et al, 2013). Prior to measurements, plants were placed in the dark for a minimum of 20 min. The fluorescence induction curves (Slow Kinetics) were determined in “Fluo + P700 mode” for 5 min.
Fe content determination
Shoots, roots, and fruits were harvested separately, washed three times with ddH2O, and immediately dried at 105°C for 30 min. Then, plant samples were dried at 65°C for 3 days and weighed. Portions of approximately 100 mg were digested with HNO3:HClO4 (4:1, v/v). The total Fe concentrations were determined by inductively coupled plasma atomic emission spectrometry (ICP optical emission spectrometry, Thermo Scientific, USA).
Root FCR activity determination
Ferric chelate reductase activity was determined according to a method described previously (Lin et al, 2016). Briefly, 0.5 g roots were placed in 50 ml assay solution (pH 5.5) consisting of 0.5 mM CaSO4, 0.1 mM 4‐morpholineethanesulfonic acid, 0.1 mM ferrozine, and 0.1 mM Fe‐EDTA. Reduction activity was measured by following the changes in A562. Reduction rates were calculated using an extinction coefficient of 27.9 mM−1 cm−1. Data were expressed as the means of relative root FCR activity, which was calculated as the percentage of FCR activity of different lines with various treatments to that of the WT with sufficient Fe supply, unless otherwise indicated.
RNA extraction and RT–qPCR analysis
Total RNA was extracted from tomato leaves or roots using RNAprep Pure Plant Kit according to the manufacturer’s instruction (Tiangen Biotech Co., Ltd. Beijing, China). Residual DNA was removed with DNase I, and the extracted RNA was reverse transcribed using a ReverTra Ace qPCR RT Kit (Toyobo, Osaka, Japan), following the manufacturer’s recommendations. RT–qPCR experiments were performed using a Power SYBR Green PCR Master Mix kit (Takara, Chiga, Japan). RT–qPCR was performed with 3 min at 95°C, followed by 40 cycles of 30 s at 95°C, 30 s at 58°C, and 1 min at 72°C. Ct values in serially diluted samples were also determined, the yielding amplification efficiencies range from 93.2 to 108.5% for different genes. The tomato ACTIN2 gene was used as an internal control. The relative gene expression was calculated following previously described formulae (Livak & Schmittgen, 2001). Primer sequences used for RT–qPCR analysis were listed in Appendix Table S2.
Protein extraction and immunoblot analysis
Leaf and root samples were ground in liquid nitrogen and mixed with protein extraction buffer (100 mM Tris–HCl, pH 8.0, 10 mM NaCl, 1 mM EDTA, 1% Triton X‐100, 1 mM phenylmethylsulfonyl fluoride and 0.2% β‐mercaptoethanol). The mixtures were incubated at 90°C for 10 min and then centrifuged at 16,000 g for 10 min. The concentrations of proteins in the homogenates were determined using a Bio‐Rad protein assay kit (Bio‐Rad Laboratories, Hercules, CA, USA). For Western blotting, the denatured protein extracts were separated using 12% sodium dodecyl sulfate‐polyacrylamide gel electrophoresis (SDS–PAGE) and were then transferred to nitrocellulose membrane. The membrane was blocked for 1 h in TBS buffer (20 mM Tris, pH 7.5, 150 mM NaCl, and 0.1% Tween 20) with 5% skim milk powder at room temperature and then incubated overnight in TBS buffer with 1% BSA containing a dilution (×2,000) of mouse antibody against HY5 (Shanghai Jiayuan Bio Co., Shanghai, China) or anti‐HA monoclonal antibody (Pierce, 26183, USA) to detect the HY5 and HA‐tagged HY5 protein. After incubation with a goat anti‐mouse HRP‐linked antibody (Millipore, AP124P, USA), the complexes on the blot were visualized using SuperSignal™ West Pico Chemiluminescent Substrate (Thermo Fisher Scientific, 34080) following the manufacturer’s instructions. Accumulation of HY5 was quantified using Quantity One software (Bio‐Rad). Rubisco (RuBisCo Large SubUnit) and β‐Actin were used as loading control.
Recombinant protein and electrophoretic mobility shift assay
The tomato HY5 recombinant protein was prepared as previously described (Wang et al, 2018). The full‐length coding region of HY5 was first PCR amplified using the primers in Appendix Table S3; then, the product was digested with BamHI and SacI and ligated into the same sites of pET‐32a vector. The recombinant vector was transformed into E. coli strain BL21 (DE3). The recombinant histidine‐tagged His‐HY5 proteins were induced by isopropyl β‐D‐1‐thiogalactopyranoside and purified following the instructions of the Novagen pET purification system. For binding assay, probes were biotin end‐labeled following the instructions of the Biotin 3’ End DNA Labeling Kit (Pierce, 89818) and annealed to double‐stranded probe DNA by incubating sequentially at 95°C for 5 min; then, the temperature decreased from 95 to 55°C by 40 cycles (−1°C /cycle, 1 cycle/min), 55°C for 30 min, from 55 to 25°C by 30 cycles (−1°C /cycle, 1 cycle/min), finally, 4°C for 5 min. EMSA of the HY5‐DNA complexes was performed using biotin‐labeled probes according to the instructions of the Light Shift Chemiluminescent EMSA kit (Thermo Fisher Scientific, 20148, USA). Briefly, 0.5 μg of HY5 fusion proteins was incubated together with biotin‐labeled probes in 20 μl reaction mixtures containing 10 mM Tris–HCl, 1 mM DTT, 150 mM KCl, 100 mM ZnCl2, 50 ng μl−1 poly (dI‐dC), 2.5% glycerol, 0.05% Nonidet P‐40, and 0.5 μg ml−1 BSA for 20 min at room temperature and separated on 6% native polyacrylamide gels in Tris‐glycine buffer at 100 V. After electrophoresis, the gel was dried and autoradiographed as described previously (Xu et al, 2014).
Chromatin immunoprecipitation (ChIP) assay
ChIP assays were performed following the instructions of the EpiQuik™ Plant ChIP Kit (Epigentek, P‐2014, USA) as described previously (Li et al, 2011). About 1g of root tissue was harvested from wild‐type and 35S‐HY5‐HA plants after a week under Fe deficiency conditions. Chromatin was immunoprecipitated with an anti‐HA antibody (Pierce, 26183, USA) and the goat anti‐mouse IgG (Millipore, AP124P) was used as the negative control. Both immunoprecipitated DNA and input DNA were analyzed by RT–qPCR (Light Cycler; Roche, Germany). Primers for ChIP‐qPCR of the FER promoters and exon fragment were listed in Appendix Table S4. Each ChIP value was normalized to its respective input DNA value. All ChIP‐qPCR experiments were independently performed in triplicate.
Statistical analysis
Experiments were performed using a completely randomized block design with four replicates. Each replicate contained 10–15 plants. Analysis of variance (ANOVA) was used to assess significance. When interaction terms were significant (P < 0.05), differences between means were analyzed using Tukey comparisons. Significant differences between treatment means are indicated by different letters.
Author contributions
ZG, JX, YW, CH, KS, JZ, and XX performed the experiments; YZ, FC, and JY conceived the project, designed the experiments, analyzed the data, and wrote the manuscript with the help of all authors.
Conflict of interest
The authors declare that they have no conflict of interest.
Supporting information
Appendix
Expanded View Figures PDF
Review Process File
Source Data for Figure 3
Source Data for Figure 5
Source Data for Figure 7
Acknowledgments
We thank Tomato Genetics Resource Center at the California University and Prof. Hongqing Ling (Institute of Genetics and Developmental Biology, Chinese Academy of Sciences) for kindly providing photoreceptor and T3238fer mutant seeds, respectively. This work was supported by grants from the National Key Research and Development of China (2018YFD1000800) and National Natural Science Foundation of China (31825023) to Y.Z., the Modern Agro‐industry Technology Research System of China (CARS‐25‐02A) to J.Y., the Postdoctoral Science Foundation of China (2017M610371) to Z.G., and the Biotechnology and Biological Sciences Research Council (BBSRC) UK (BB/M009130/1) to C.H.F.
EMBO reports (2021) 22: e51944.
Contributor Information
Yanhong Zhou, Email: yanghongzhou@zju.edu.cn.
Christine H Foyer, Email: C.H.Foyer@bham.ac.uk.
Jingquan Yu, Email: jqyu@zju.edu.cn.
Data availability
This study includes no data deposited in external repositories.
References
- Briat JF, Dubos C, Gaymard F (2015) Iron nutrition, biomass production, and plant product quality. Trends Plant Sci 20: 33–40 [DOI] [PubMed] [Google Scholar]
- Brumbarova T, Bauer P (2005) Iron‐mediated control of the basic helix‐loop‐helix protein FER, a regulator of iron uptake in tomato. Plant Physiol 137: 1018–1026 [DOI] [PMC free article] [PubMed] [Google Scholar]
- Chen X, Yao Q, Gao X, Jiang C, Harberd NP, Fu X (2016) Shoot‐to‐root mobile transcription factor HY5 coordinates plant carbon and nitrogen acquisition. Curr Biol 26: 640–646 [DOI] [PubMed] [Google Scholar]
- Colangelo EP, Guerinot ML (2004) The essential basic helix‐loop‐helix protein FIT1 is required for the iron deficiency response. Plant Cell 16: 3400–3412 [DOI] [PMC free article] [PubMed] [Google Scholar]
- Cui Y, Chen CL, Cui M, Zhou WJ, Wu HL, Ling HQ (2018) Four IVa bHLH transcription factors are novel interactors of FIT and mediate JA inhibition of iron uptake in Arabidopsis. Mol Plant 11: 1166–1183 [DOI] [PubMed] [Google Scholar]
- Dahlerup J, Lindgren S, Moum B (2015) Iron deficiency and iron deficiency anemia are global health problems. Lakartidningen 112: DAAE [PubMed] [Google Scholar]
- DellaValle DM, Glahn RP, Shaff JE, O'Brien K (2015) Iron absorption from an intrinsically labeled lentil meal is low but upregulated in women with poor iron status. J Nutr 145: 2253–2257 [DOI] [PubMed] [Google Scholar]
- Gao F, Robe K, Bettembourg M, Navarro N, Rofidal V, Santoni V, Gaymard F, Vignols F, Roschzttardtz H, Izquierdo Eet al (2020) The transcription factor bHLH121 interacts with bHLH105 (ILR3) and its closest homologs to regulate iron homeostasis in Arabidopsis. Plant Cell 32: 508–524 [DOI] [PMC free article] [PubMed] [Google Scholar]
- Grillet L, Lan P, Li W, Mokkapati G, Schmidt W (2018) IRON MAN is a ubiquitous family of peptides that control iron transport in plants. Nat Plants 4: 953–963 [DOI] [PubMed] [Google Scholar]
- Grusak MA, Pezeshgi S (1996) Shoot‐to‐root signal transmission regulates root Fe(III) reductase activity in the dgl mutant of pea. Plant Physiol 110: 329–334 [DOI] [PMC free article] [PubMed] [Google Scholar]
- He J, Shen X, Fang A, Song J, Li H, Guo M, Li K (2016) Association between predominantly plant‐based diets and iron status in Chinese adults: a cross‐sectional analysis. Br J Nutr 116: 1621–1632 [DOI] [PubMed] [Google Scholar]
- Kobayashi T, Nishizawa NK (2012) Iron uptake, translocation, and regulation in higher plants. Annu Rev Plant Biol 63: 131–152 [DOI] [PubMed] [Google Scholar]
- Kumar RK, Chu H‐H, Abundis C, Vasques K, Rodriguez DC, Chia J‐C, Huang R, Vatamaniuk OK, Walker EL (2017) Iron‐nicotianamine transporters are required for proper long distance iron signaling. Plant Physiol 175: 1254–1268 [DOI] [PMC free article] [PubMed] [Google Scholar]
- Lee BR, Koprivova A, Kopriva S (2011) The key enzyme of sulfate assimilation, adenosine 5'‐phosphosulfate reductase, is regulated by HY5 in Arabidopsis. Plant J 67: 1042–1054 [DOI] [PubMed] [Google Scholar]
- Lee H‐j, Ha J‐h, Kim S‐g, Choi H‐k, Kim Zh, Han Y‐j, Kim J‐i, Oh Y, Fragoso V, Shin Ket al (2016) Stem‐piped light activates phytochrome B to trigger light responses in Arabidopsis thaliana roots. Sci Signal 9: ra106 [DOI] [PubMed] [Google Scholar]
- Lei R, Li Y, Cai Y, Li C, Pu M, Lu C, Yang Y, Liang G (2020) bHLH121 functions as a direct link that facilitates the activation of FIT by bHLH IVc transcription factors for maintaining Fe homeostasis in Arabidopsis . Mol Plant 13: 634–649 [DOI] [PubMed] [Google Scholar]
- Li Z, Zhang L, Yu Y, Quan R, Zhang Z, Zhang H, Huang R (2011) The ethylene response factor AtERF11 that is transcriptionally modulated by the bZIP transcription factor HY5 is a crucial repressor for ethylene biosynthesis in Arabidopsis. Plant J 68: 88–99 [DOI] [PubMed] [Google Scholar]
- Lin XY, Ye YQ, Fan SK, Jin CW, Zheng SJ (2016) Increased sucrose accumulation regulates iron‐deficiency responses by promoting auxin signaling in Arabidopsis plants. Plant Physiol 170: 907–920 [DOI] [PMC free article] [PubMed] [Google Scholar]
- Ling HQ, Bauer P, Bereczky Z, Keller B, Ganal M (2002) The tomato fer gene encoding a bHLH protein controls iron‐uptake responses in roots. Proc Natl Acad Sci USA 99: 13938–13943 [DOI] [PMC free article] [PubMed] [Google Scholar]
- Lingam S, Mohrbacher J, Brumbarova T, Potuschak T, Fink‐Straube C, Blondet E, Genschik P, Bauer P (2011) Interaction between the bHLH transcription factor FIT and ETHYLENE INSENSITIVE3/ETHYLENE INSENSITIVE3‐LIKE1 reveals molecular linkage between the regulation of iron acquisition and ethylene signaling in Arabidopsis . Plant Cell 23: 1815–1829 [DOI] [PMC free article] [PubMed] [Google Scholar]
- Livak KJ, Schmittgen TD (2001) Analysis of relative gene expression data using real‐time quantitative PCR and the 2−ΔΔCT method. Methods 25: 402–408 [DOI] [PubMed] [Google Scholar]
- Long TA, Tsukagoshi H, Busch W, Lahner B, Salt D, Benfey PN (2010) The bHLH transcription factor POPEYE regulates response to iron deficiency in Arabidopsis roots. Plant Cell 22: 2219–2236 [DOI] [PMC free article] [PubMed] [Google Scholar]
- Maas FM, Vandewetering DAM, Vanbeusichem ML, Bienfait HF (1988) Characterization of phloem iron and its possible role in the regulation of Fe‐efficiency reactions. Plant Physiol 87: 167–171 [DOI] [PMC free article] [PubMed] [Google Scholar]
- Meiser J, Lingam S, Bauer P (2011) Posttranslational regulation of the iron deficiency basic helix‐loop‐helix transcription factor FIT is affected by iron and nitric oxide. Plant Physiol 157: 2154–2166 [DOI] [PMC free article] [PubMed] [Google Scholar]
- Müller NA, Wijnen CL, Srinivasan A, Ryngajllo M, Ofner I, Lin T, Ranjan A, West D, Maloof JN, Sinha NRet al (2016) Domestication selected for deceleration of the circadian clock in cultivated tomato. Nat Genet 48: 89–93 [DOI] [PubMed] [Google Scholar]
- Nouet C, Motte P, Hanikenne M (2011) Chloroplastic and mitochondrial metal homeostasis. Trends Plant Sci 16: 395–404 [DOI] [PubMed] [Google Scholar]
- Osterlund MT, Hardtke CS, Wei N, Deng XW (2000) Targeted destabilization of HY5 during light‐regulated development of Arabidopsis . Nature 405: 462–466 [DOI] [PubMed] [Google Scholar]
- Raven JA, Evans MCW, Korb RE (1999) The role of trace metals in photosynthetic electron transport in O2‐evolving organisms. Photosynth Res 60: 111–149 [Google Scholar]
- Sakuraba Y, Kanno S, Mabuchi A, Monda K, Iba K, Yanagisawa S (2018) A phytochrome‐B‐mediated regulatory mechanism of phosphorus acquisition. Nat Plants 4: 1089–1101 [DOI] [PubMed] [Google Scholar]
- Salome PA, Oliva M, Weigel D, Kraemer U (2013) Circadian clock adjustment to plant iron status depends on chloroplast and phytochrome function. EMBO J 32: 511–523 [DOI] [PMC free article] [PubMed] [Google Scholar]
- Schikora A, Schmidt W (2001) Iron stress‐induced changes in root epidermal cell fate are regulated independently from physiological responses to low iron availability. Plant Physiol 125: 1679–1687 [DOI] [PMC free article] [PubMed] [Google Scholar]
- Schmidt W (2003) Iron solutions: acquisition strategies and signaling pathways in plants. Trends Plant Sci 8: 188–193 [DOI] [PubMed] [Google Scholar]
- Selote D, Samira R, Matthiadis A, Gillikin JW, Long TA (2015) Iron binding E3 ligase mediates iron response in plants by targeting basic helix‐loop‐helix transcription factors. Plant Physiol 167: 273–286 [DOI] [PMC free article] [PubMed] [Google Scholar]
- Sharrock RA, Clack T (2002) Patterns of expression and normalized levels of the five Arabidopsis phytochromes. Plant Physiol 130: 442–456 [DOI] [PMC free article] [PubMed] [Google Scholar]
- Shin J, Park E, Choi G (2007) PIF3 regulates anthocyanin biosynthesis in an HY5‐dependent manner with both factors directly binding anthocyanin biosynthetic gene promoters in Arabidopsis. Plant J 49: 981–994 [DOI] [PubMed] [Google Scholar]
- Sivitz A, Grinvalds C, Barberon M, Curie C, Vert G (2011) Proteasome‐mediated turnover of the transcriptional activator FIT is required for plant iron‐deficiency responses. Plant J 66: 1044–1052 [DOI] [PubMed] [Google Scholar]
- Srivastava AK, Senapati D, Srivastava A, Chakraborty M, Gangappa SN, Chattopadhyay S (2015) Short hypocotyl in White Light1 interacts with elongated hypocotyl5 (HY5) and constitutive photomorphogenic1 (COP1) and promotes COP1‐mediated degradation of HY5 during Arabidopsis seedling development. Plant Physiol 169: 2922–2934 [DOI] [PMC free article] [PubMed] [Google Scholar]
- Stracke R, Favory JJ, Gruber H, Bartelniewoehner L, Bartels S, Binkert M, Funk M, Weisshaar B, Ulm R (2010) The Arabidopsis bZIP transcription factor HY5 regulates expression of the PFG1/MYB12 gene in response to light and ultraviolet‐B radiation. Plant Cell Environ 33: 88–103 [DOI] [PubMed] [Google Scholar]
- Varotto C, Maiwald D, Pesaresi P, Jahns P, Salamini F, Leister D (2002) The metal ion transporter IRT1 is necessary for iron homeostasis and efficient photosynthesis in Arabidopsis thaliana . Plant J 31: 589–599 [DOI] [PubMed] [Google Scholar]
- Vert GA, Briat JF, Curie C (2003) Dual regulation of the Arabidopsis high‐affinity root iron uptake system by local and long‐distance signals. Plant Physiol 132: 796–804 [DOI] [PMC free article] [PubMed] [Google Scholar]
- Vigani G, Murgia I (2018) Iron‐requiring enzymes in the spotlight of oxygen. Trends Plant Sci 23: 874–882 [DOI] [PubMed] [Google Scholar]
- Wang F, Wu N, Zhang L, Ahammed GJ, Chen X, Xiang X, Zhou J, Xia X, Shi K, Yu Jet al (2018) Light signaling‐dependent regulation of photoinhibition and photoprotection in tomato. Plant Physiol 176: 1311–1326 [DOI] [PMC free article] [PubMed] [Google Scholar]
- Welch RM, LaRue TA (1990) Physiological characteristics of Fe accumulation in the “bronze” mutant of Pisum sativum L. cv Sparkle E107 (brz brz). Plant Physiol 93: 723–729 [DOI] [PMC free article] [PubMed] [Google Scholar]
- Wu T, Zhang HT, Wang Y, Jia WS, Xu X‐F, Zhang XZ, Han ZH (2012) Induction of root Fe(III) reductase activity and proton extrusion by iron deficiency is mediated by auxin‐based systemic signalling in Malus xiaojinensis . J Exp Bot 63: 859–870 [DOI] [PMC free article] [PubMed] [Google Scholar]
- Xu D, Li J, Gangappa SN, Hettiarachchi C, Lin F, Andersson MX, Jiang Y, Deng XW, Holm M (2014) Convergence of light and ABA signaling on the ABI5 promoter. PLOS Genet 10: e1004197 [DOI] [PMC free article] [PubMed] [Google Scholar]
- Yin L, Wang Y, Yan M, Zhang X, Pan H, Xu X, Han Z (2013) Molecular cloning, polyclonal antibody preparation, and characterization of a functional iron‐related transcription factor IRO2 from Malus xiaojinensis . Plant Physiol Biochem 67: 63–70 [DOI] [PubMed] [Google Scholar]
- Yuan X, Guo P, Qi X, Ning N, Wang H, Wang H, Wang X, Yang Y (2013) Safety of herbicide Sigma Broad on Radix Isatidis (Isatis indigotica Fort.) seedlings and their photosynthetic physiological responses. Pest Biochem Physiol 106: 45–50 [Google Scholar]
- Zhang H, Zhao X, Li J, Cai H, Deng XW, Li L (2014) MicroRNA408 is critical for the HY5‐SPL7 gene network that mediates the coordinated response to light and copper. Plant Cell 26: 4933–4953 [DOI] [PMC free article] [PubMed] [Google Scholar]
Associated Data
This section collects any data citations, data availability statements, or supplementary materials included in this article.
Supplementary Materials
Appendix
Expanded View Figures PDF
Review Process File
Source Data for Figure 3
Source Data for Figure 5
Source Data for Figure 7
Data Availability Statement
This study includes no data deposited in external repositories.