

Abstract
The national metrology institutes for the United Kingdom (UK) and the United States of America (USA) have compared activity standards for 224Ra, an α-particle emitter of interest as the basis for therapeutic radiopharmaceuticals. Solutions of 224RaCl2 were assayed by absolute methods, including digital coincidence counting and triple-to-double coincidence ratio liquid scintillation counting. Ionization chamber and high-purity germanium (HPGe) γ-ray spectrometry calibrations were compared; further, a solution was shipped between laboratories for a direct comparison by HPGe spectrometry. New determinations of the absolute emission intensity for the 241 keV γ ray (Iγ = 4.011(16) per 100 disintegrations of 224Ra) and of the 224Ra half-life (T1/2 = 3.6313(14) d) are presented and discussed in the context of previous measurements and evaluations.
Keywords: Decay constant, Emission probability, Coincidence counting, TDCR, Ionization chamber, Gamma-ray spectrometry, Activity standard, Comparison, Alpha therapy
1. Introduction
The National Physical Laboratory (NPL) and the National Institute of Standards and Technology (NIST) have recently reported on measurements of 224Ra and its progeny (Napoli et al., 2020a, 2020b; Collins et al., 2020). These reports have focused on absolute activity measurements and calibrations. Here, we demonstrate the equivalence of UK and USA National standards for 224Ra activity and focus attention on nuclear decay data, particularly the 224Ra half-life (T1/2) and the absolute emission intensity (Iγ) for the 241 keV γ ray following the decay of 224Ra (γ1,0(Rn) emission).
Interest in 224Ra comes from diverse fields and all are reliant on precise nuclear decay data. The 224Ra nucleus has been identified as potentially “pear-shaped”, with octupole deformation inducing a permanent atomic electric dipole that would be the hallmark of time-reversal or charge parity violation—i.e., beyond Standard Model physics (Gaffney et al., 2013). Precision experiments characterizing such nuclei rely on a detailed knowledge of the manifold of available nuclear states.
Relative amounts of radium isotopes, including 224Ra, provide a precision picture of ocean water mixing rates in coastal regions (e.g., Moore, 2000). The discharge of salty groundwater into salt marshes includes short-lived 223Ra and 224Ra that can be measured to quantitatively model transport and mixing phenomena as these tracers decay almost completely before reaching the open ocean, where long-lived Ra isotopes predominate. Precision half-lives are crucial inputs to the models that make such methods quantitative.
At present, the greatest commercial and technical impetus for precision measurement of 224Ra comes from applications in nuclear medicine. The bone-seeking chemistry of Ra has been leveraged for the treatment of ankylosing spondylitis (e.g., Schulte et al., 2009; Tiepolt et al., 2002) and, more recently, skeletal metastases (Parker et al., 2013; Juzeniene et al., 2018). As interest in targeted alpha therapy has grown (Parker et al., 2018), new approaches to tumor targeting, including association to nano- (Piatrowska et al., 2013; Reissig et al., 2019) and micro-particles (Westrøm et al., 2018a & b), have expanded potential therapeutic indications for 224Ra. As a consequence of the characteristics of the decay chain, clinical activity assays of 224Ra must account for the relatively slow (≈6 d) evolution of equilibrium between 224Ra and its progeny. Thus, activity measurements require precise nuclear decay data (half-lives, α/β branching ratio) for the entire decay chain.
As medical practitioners gain experience with 223RaCl2, the first-in-class α-therapeutic marketed as Xofigo (Bayer Healthcare Pharmaceuticals, Inc.),1 the value of activity calibrations that are traceable to National standards is widely recognized. In developing the UK National standard for 223Ra activity, the importance of comparisons between NMIs was highlighted to ensure the accuracy of our standards (Keightley et al., 2015; Zimmerman et al., 2015). Through communication between NIST and NPL, accord between National standards was established both by comparison of ionization chamber (IC) calibrations and measured absolute γ-ray emission intensities (Collins et al., 2015; Pibida et al., 2015). When the two laboratories undertook to develop activity standards for 224Ra, we resolved to establish early links. Herein, we discuss in detail three specific comparators used to establish equivalence of the UK and USA standards for 224Ra activity. We compare measurements on ICs with a well-known response relationship. We compare activity assays of a common solution, shipped from NPL to NIST. Finally, we compare absolute Iγ for the 241 keV γ ray from the decay of 224Ra determined with high-purity germanium (HPGe) detectors. Moreover, we present new T1/2 measurements from both laboratories, discussing the sensitivity of the comparison results to the adopted T1/2.
Beyond demonstrating accord between laboratories for activity measurements of an important radionuclide, we contribute to an Iγ dataset that has been heavily influenced by a single measurement (Gehrke et al., 1984) reported with high precision. We discuss our results in the context of the historical dataset and present an estimate of how the evaluated Iγ should be expected to change. Throughout this work, all corrections for radioactive decay have been performed using the DDEP recommended half-life for 224Ra of 3.631(2) d (Bé et al., 2004).2
2. Source preparation
The NPL sources were prepared from a generator consisting of 228Th (T1/2 = 1.9126(9) a (Bé et al., 2013)), provided by Oncoinvent AS, on an extraction chromatography resin with a high affinity for Th(IV) (Collins et al., 2020). The nominal activity of the generator was 3 MBq in April 2018. The 224Ra was eluted from the generator using nitric acid and its decay progeny were subsequently removed with a combination of Sr and DGA resins, which also served to remove additional 228Th. This resulted in a ‘clean’ solution of 224Ra in 3 mol L−1 HNO3. From the resulting solutions, samples for primary standardization by 4π(LS)-γ digital coincidence counting (DCC; See section 3.1) and HPGe γ-ray spectrometry were prepared. For the three primary standardization experiments (S1, S2 and S3) the massic activity (Am) at reference times (tref) are given in Table 1. In each case, the effective time of separation (tsep), i. e., the time at which the 224Ra constituted 100% of the total activity, and its standard uncertainty was determined from the activity ratio of the 224Ra and 212Pb measured by HPGe γ-ray spectrometry using the method described in Pommé et al. (2016). The measured effective tsep and estimated end point of the radiochemical separations agreed.
Table 1.
Massic activity (Am) of the 224Ra solutions standardized at NPL by 4π(LS)-γ digital coincidence counting. All times are UTC. Note that for S1 and S2 the reference time (tref) matches the effective separation time (tsep).
| Experiment | t sep | t ref | Am/kBq g−1 |
|---|---|---|---|
| S1 | 2018–09-04 07:48 ± 00:01 | 2018–09-04 07:48 | 242.9(15) |
| S2 | 2018–11-12 14:42 ± 00:01 | 2018–11-12 14:42 | 182.0(11) |
| S3 | 2019–12-04 10:56 ± 00:06 | 2019–12-13 12:00 | 29.921(81) |
The solution prepared for S3 was used for the bilateral comparison. From the solution, NPL prepared a series of 12 liquid scintillation vials containing aliquots of the 224Ra solution and 10 mL Goldstar Quanta (Triskem International, Bruz, France), two 1 g aliquots in 2 mL ISO ampoules for γ-ray spectrometry, and a 5 mL ampoule (of the type designated “NIST-1” in NISTIR 8254 (Collé, 2019)) containing 5 mL of solution. This gravimetrically linked ampoule was shipped to NIST.
At NIST, 224Ra sources were prepared in nominally 1 mol L−1 HCl as part of the primary activity standardization (Napoli et al., 2020a). The 224RaCl2 used in Experiment 2 (E2) was delivered from Oncoinvent, AS (Oslo, Norway); the material used in Experiments 3 and 4 (E3 and E4) was delivered from Oak Ridge National Laboratory (ORNL; Oak Ridge, TN, USA). In each experiment, 5 mL NIST-1 ampoules containing nominally 5 mL of solution were prepared for HPGe and/or IC measurement. Table 2 gives essential characteristics for the sources measured at NIST; additional details regarding the broader experimental schemes that spawned these sources can be found in Napoli et al. (2020a; 2020b). In each experiment, tref was chosen to fall within the measurement campaign, which started at least 6 d after tsep, as reported by Oncoinvent or ORNL.
Table 2.
Sources measured at NIST for this study. Activities (A) for the sources prepared at NIST were determined by triple-to-double coincidence ratio (TDCR) counting. All times are UTC.
| Source ID | t sep | t ref | A/Bq | Technique |
|---|---|---|---|---|
| E2-A1 | 2018–09-14 18:15 | 2018–09-27 17:00 | 1.3121(30) × 106 | TDCR |
| E2-A2 | 2018–09-14 18:15 | 2018–09-27 17:00 | 1.2773(29) × 106 | TDCR |
| E2-D1- A1 | 2018–09-14 18:15 | 2018–09-27 17:00 | 1.2465(28) × 106 | TDCR |
| E3-A2 | 2018–10-31 17:00a | 2018–11-06 17:00 | 1.603(7) × 106 | TDCR |
| E4-A2 | 2019–02-08 20:40 | 2019–02-15 17:00 | 6.073(15) × 106 | TDCR |
| S3-A | 2019–12-04 10:56 | 2019–12-13 12:00 | 1.503(8) × 105b | VIC |
The separation time for the E3 source was not communicated by ORNL, but was estimated based on the shipping schedule and observed equilibrium.
The comparison ampoule contained 5.01700 g of solution S3 (see Table 1). The activity given here was measured at NIST using the Vinten 671 ionization chamber (VIC).
At NIST, radionuclidic impurities were checked by liquid scintillation counting and HPGe spectrometry. No photon-emitting impurities were detected during the initial measurement period, but approximately ten 224Ra half-lives after tref, 228Th lines (132 keV, 166 keV, and 216 keV) could be discerned, allowing an assay by HPGe spectrometry. The impurity fractions, expressed as activity ratios (fTh-228 = ATh-228/ARa-224) at the separation time (tsep), are reported in Table 3. Samples were also checked for long-lived impurities by liquid scintillation counting; these checks exclude the possibility of radionuclidic impurities that do not emit photons detectable by HPGe (e.g., tritium). After approximately ten 224Ra half-lives, liquid scintillation count rates were indistinguishable from background.
Table 3.
Impurity fractions determined by HPGe spectrometry. The HPGe-determined 228Th activities were decay-corrected to the separation time, tsep, and expressed relative to the corresponding (decay-corrected) 224Ra activities. See text for assay details.
| Solution | f Th-228 |
|---|---|
| E2 | 3.3(4) × 10−6 |
| E3 | 5.0(16) × 10−6 |
| E4 | 4.2(6) × 10−6 |
| S3 | 1.11(11) × 10−5 |
At NPL, no photon-emitting impurities were detected via HPGe γ-ray spectrometry in the initial few days after tsep. Over a longer period (≈25 d), measurements revealed no characteristic 228Th peaks and no significant deviation from the expected decay-corrected count rates of selected γ rays from 224Ra, 212Pb and 208Tl, establishing that any 228Th was below levels that would significantly bias the S1 and S2 standardization results. From the estimate of the detection limit for the 84.4 keV γ ray of the 228Th it was established for S2 that fTh-228 < 1.15 × 10⁻⁴ at tsep. For S3, which was used in the bilateral comparison, the sample was measured for a longer period to determine the 224Ra half-life. These data showed clear contributions from the longer-lived 228Th after ≈ tsep + 30 d. To provide a more definitive and quantitative measure of 228Th breakthrough, a liquid scintillation vial from the primary standardization was measured using a 50% relative efficiency semi-planar HPGe γ-ray spectrometer. This measurement was made at tsep + 153 d (≈ 42 half-lives of 224Ra), by which time no significant unsupported 224Ra would be present. From this measurement, the continued presence of 224Ra and progeny was observed, confirming the presence of 228Th with an activity of 1.90(20) Bq g−1, or fTh-228 = 1.11(11) × 10−5 at tsep. While the estimated fTh-228 was similar in the NIST and NPL sources, the NPL sources had lower total initial activity and no characteristic 228Th peaks were observed in the HPGe spectra.
3. Activity measurements
3.1. Digital coincidence counting (DCC) activity assays at NPL
The absolute Am of the 224Ra solutions was determined by the NPL 4π (LS)-γ digital coincidence counting (DCC) system (Keightley and Park, 2007; Keightley et al., 2015). The standardization of the S3 solution used for this bilateral comparison was assayed in the same manner as for the S1 and S2 standardizations. Aliquots (15 mg to 125 mg) of the solution were added to fourteen 20 mL plastic PerkinElmer Liquid Scintillation (LS) vials containing 10 mL of Goldstar Quanta liquid scintillation cocktail. These vials were measured from seven days after tsep, when the 224Ra and decay progeny could be assumed to be in equilibrium. The range in mass dispensed to each vial was selected to maintain appropriate count rates during the radioactive decay process, therefore allowing counting to extend up to 28 d after tsep. A total of 38 measurements were made during the campaign.
Through the digitization of the pulse chain, it is possible to vary the dead time of the LS- and γ-channel, resolving times, and γ-gates used. Various γ-gates were applied (Table 4) and the LS-channel efficiency varied using the computer discrimination method (Smith, 1975, 1987; Smith and Stuart, 1975). The maximum LS channel efficiency (εLS) achieved for the different gates varied from (0.922 to 0.996) counts per decay of 224Ra and progeny (Table 4). The extrapolations were performed using:
| (1) |
where NLS and εLS are the counting rate and counting efficiency in the LS channel, N0 is related to the decay rate, and a1 and a2 are fitting parameters.
Table 4.
γ-gates investigated for absolute determination of activity, with the maximum efficiency (expressed in terms of total decays of all radionuclides; see text) achieved for each gate. Activity per unit mass are given at tref, with uncertainties expressed as the standard uncertainty of the weighted mean of the 38 measurements.
| γ-gate/keV | Maximum εLS | Am/kBq g−1 |
|---|---|---|
| 510.6 to 583.0 | 0.996 | 29.930(24) |
| 238.6 to 241.0 | 0.922 | 29.944(15) |
| Full spectrum | 0.964 | 29.9154(95) |
The resulting N0 represented the combined decay rate of the 224Ra and decay progeny. To achieve a decay rate for the 224Ra only, N0 was divided by the total relative activities of the decay series members, accounting for the effect of the 212Po and its half-life (T1/2 = 300(2) ns). As discussed in papers describing previous standardizations of 229Th, 227Th, 223Ra, and 224Ra, the presence of progeny in the decay series with half-lives that are short relative to the imposed dead time (tdead) can add complications to using the relative activity of the parent to determine its absolute activity (Fitzgerald et al., 2010; Keightley et al., 2015; Kossert and Nähle, 2019; Collins et al., 2019a; Napoli et al., 2020a). Applying Eq.[3] from Kossert and Nähle (2019)
| (2) |
the correction due to the half-life of 215Po (kPo-215) was insignificant, therefore it could be safely assumed that for any decay of 212Bi followed by a decay of 212Po only one of these events would be captured. Thus, while the total relative activity of 224Ra in equilibrium is 5.7066, the divisor to achieve the activity of 224Ra is 4.7066. Data collected with the different γ-gates gave massic activities at the reference time that were in agreement. Each measurement was corrected for the presence of 228Th, assuming a total activity of the contaminant as the activity of 228Th at the time of the measurement multiplied by 5.7066 to account for the presence of the 228Th-supported decay progeny. Corrections ranged from 0.99996 to 0.998 at 7.1 d and 27.1 d, respectively, from tsep.
The Am reported by NPL for the bilateral comparison was taken from the result using the full spectrum γ-gate. The massic activity at the reference time for each of the 38 measurements is shown in Fig. 1, there was no significant autocorrelation found between measurements (R = 0.30; Rcrit(0.05) = 0.325). The full uncertainty budget is provided in Table 5. The reported Am of 224Ra for the S3 solution was 29.921(81) kBq g−1 at the reference time of 2019–12-13 12:00 UTC.
Fig. 1.

Time series of the activity concentration determined for the individual measurements using the full spectrum γ-gate. The uncertainty bars represent the uncertainty from the extrapolation least-squares fit for the N0 parameter. The solid and dotted lines represent the weighted mean and combined standard uncertainty of the activity reported.
Table 5.
Uncertainty budget for the massic activity (Am) of the S3 224Ra solution determined at NPL by 4π(LS)-γ DCC.
| Component | ui/% |
|---|---|
| Standard uncertainty of the weighted mean | 0.032 |
| Gravimetric | 0.050 |
| Repeatability | 0.10 |
| γ-gate selection | 0.10 |
| Extrapolation | 0.20 |
| Decay correction | 0.072 |
| 228Th impurity | 0.010 |
| Background correction | 0.0030 |
| Predicted equilibrium ratio of decay progeny | 0.015 |
| Pulse pile-up (LS-channel) | 0.015 |
| Pulse pile-up (γ-channel) | 0.0050 |
| LS-channel dead time | 0.050 |
| γ-channel dead time | 0.050 |
| Accidental coincidence correction | 0.010 |
|
| |
| Combined standard uncertainty, uc | 0.27 |
3.2. Ionization chamber activity determinations at NIST
In E2 to E4, source activities were established via triple-to-double coincidence ratio counting (TDCR), as reported by Napoli et al. (2020a). For the bilateral comparison, the ampoule received from NPL was measured with a Vinten 671 ionization chamber (VIC; Woods et al., 1983) read by a Keithley 6517 electrometer that was calibrated for 224Ra at equilibrium with its progeny (Napoli et al., 2020a). Source activities are summarized in Table 2.
Because the VIC calibration was determined for an ampoule containing 224Ra in 1 mol L−1 HCl, we performed Monte Carlo simulations using an EGSnrc (Rogers et al., 2010) model that has been benchmarked against Townson et al. (2018) to estimate the change to the VIC response expected from measuring an ampoule containing 3 mol L−1 HNO3. The simulations showed a maximum 0.18% difference in response, which was comparable to the model uncertainties; no correction was made, but an uncertainty component was added (denoted “Solution composition” in Table 6).
Table 6.
Uncertainty budget for the activity of ampoule S3-A, determined with the Vinten 671 ionization chamber (VIC) at NIST during the bilateral comparison.
| Component | ui/% |
|---|---|
| Measurement uncertainty; estimated as the relative standard deviation of the mean of N = 500 current measurements | 0.36 |
| Standard uncertainty on KVIC | 0.32 |
| Background | 0.24 |
| 228Th impurity | 0.01 |
| Decay correction | 0.001 |
| Solution composition | 0.18 |
|
| |
| Combined standard uncertainty, uc | 0.57 |
4. Gamma-ray emission intensities
At both laboratories, HPGe γ-ray spectrometry measurements of the 241 keV peak from 224Ra decay (γ1,0(Rn) emission) were combined with primary activity measurements to calculate emission intensities (Iγ). These data indicate that the laboratories’ 224Ra activity standards are in accord and suggest that a new data evaluation is in order.
4.1. NPL measurements of Iγ
For the measurement of the absolute γ-ray emission intensity, the samples were measured on a 24% relative efficiency HPGe γ-ray spectrometer mounted in a graded lead shield. The samples were mounted perpendicular to the detector window along the horizontal axis with an approximate source-to-detector window distance of 295 mm to minimize coincidence summing. It should be noted that as a result of the 224Ra decay process there is little coincidence summing as the excited levels above the 241 keV excited level are weakly populated (99.98% of α decays go directly either to the 241 keV excited or ground state). The detector and full-energy peak detection efficiency for the matched geometry (1 mL of aqueous solution in a 2 mL ISO ampoule at 295 mm) have been described in detail by Collins et al. (2019b).
The live times for each measurement varied between 3600 s (for S1 and S2) and 14 400 s (for S3) and the period of measurements, stated in terms of days after tsep, extended from 0.03 d to 0.50 d (n = 11) for S1, 0.05 d to 6.14 d (n =141) for S2, and 0.25 d to 4.87 d (n =28) for S3. For S2 and S3, this provided ample time to observe the effects of the ingrowth of the decay progeny, specifically the 238 keV γ ray from the decay of 212Pb. For S2, additional longer measurements (66 000 s to 154 000 s) were made from 6.85 d to 21.9 d (n = 7).
The 241 keV peak from 224Ra could not be fully resolved from the 238 keV peak from 212Pb (i.e., the “238/241 keV doublet”) due to a detector resolution of approximately 0.9 keV at 241 keV. As the full-energy peaks (FEPs) are separated at the half-maximum of both FEPs, the fitting of a Gaussian function to each FEP is relatively simple. However, as shown in Collins et al. (2020), the ingrowth of the 212Pb and the development of its 238 keV peak throughout the course of the measurement campaign can cause complications due to the evolving nature of the low- and high-energy tails (LET and HET). This can result in unstable positive errors in the determined net peak area over time if neglected. NPL performed the peak fitting using in-house software implementing the functions described in Collins et al. (2020), referred to herein as “HET + LET”.
In a divergence from Collins et al. (2020), when fitting the HET of the 241 keV peak, the HET parameters were determined from an early measurement where the HET of the 238 keV peak was insignificant and the value of these parameters were maintained throughout for all fits. This method modification is based on further investigations carried out at NPL using two γ-ray emitting sources (57Co and 133Ba), one maintained in position to provide a reference peak shape (57Co - 122 keV) with the second source moved closer to the detector to provide the required increase in count rate. No significant change in the peak HET of the 122 keV peak was observed as the count rate increased, while the HET of the peaks from 133Ba increased as its count rate increased (i.e. as it got closer to the detector window). This change in the method appears to provide improved stability in the determination of the net area of the 241 keV peak. An example of the fitting of the 238/241 keV doublet for S3 1.6 d after tsep is shown in Fig. 2. For each measurement campaign, the decay-corrected count rate as a function of time for the 241 keV peak is shown in Fig. 3.
Fig. 2.

A fit of the 238/241 keV doublet collected 1.6 d after tsep using the LET + HET method.
Fig. 3.
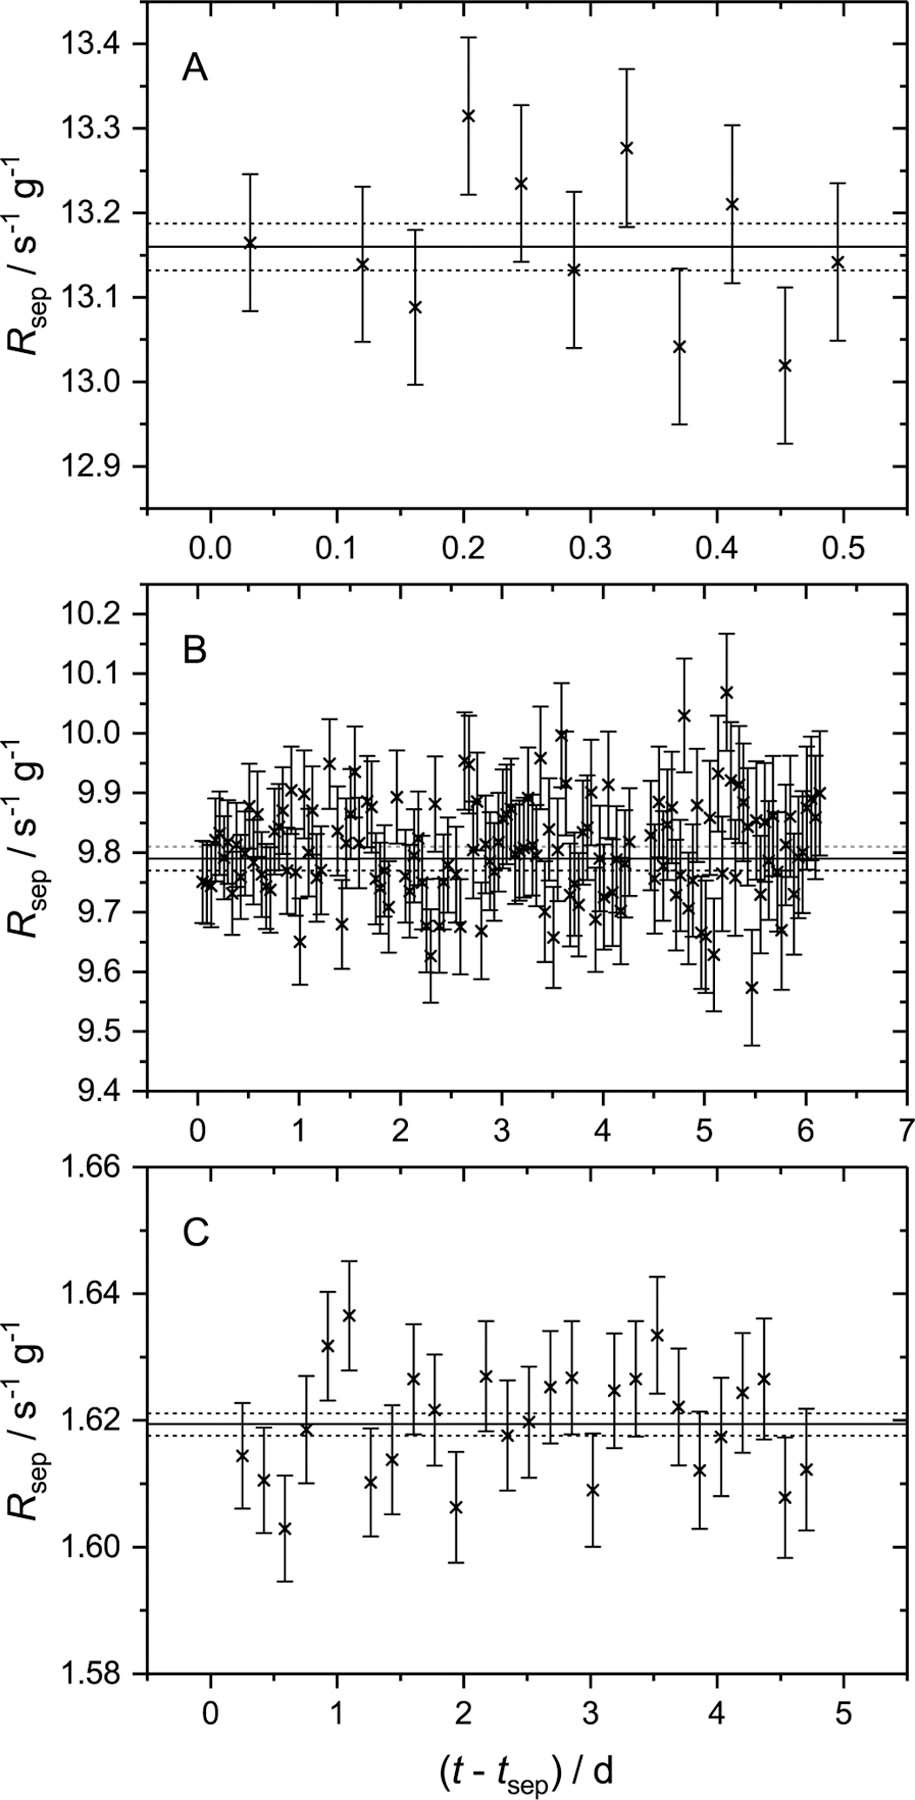
Decay-corrected count rates of the 241 keV full-energy peak for each time series of measurements for S1 (A), S2 (B), and S3 (C). The fitting of the full-energy peak for each measurement was performed with the LET and HET component. The results show a consistent result with time, indicating good performance of the peak fitting. The solid and dashed lines indicate the weighted mean and its standard uncertainty, respectively.
The absolute activity for each solution, determined by the 4π(LS)-γ DCC technique, was applied to the weighted mean of the corrected HPGe count rates for each solution (S1 to S3) to determine the absolute Iγ for the 241 keV γ-ray emission (Table 1). For the weighted mean of the count rates, the weight for each measurement was determined by combining the statistical, continuum, decay, and 228Th impurity correction uncertainty components in quadrature. The uncertainty budget for Iγ from S3 is given in Table 8.
Table 8.
Uncertainty budgets for the absolute emission intensity for the 241 keV γ-ray, Iγ, determined at NIST with the x-detector and at NPL using the S3 solution.
| NPL |
NIST |
||
|---|---|---|---|
| LET + HET | GENIE | LET + HET | |
|
|
|
|
|
| /% | /% | /% | |
| Standard uncertainty of weighted mean | 0.11 | ||
| Peak fitting and counting statistics | 0.41 | 0.22 | 0.21 |
| Source activity | 0.27 | 0.31 | 0.31 |
| Full-energy peak detection efficiency | 0.34 | 0.71 | 0.71 |
| Decay correction during measurement (NPL combined this component with “Decay factor to reference time” for a single component) | – | 0.037 | 0.037 |
| Decay factor to reference time | 0.069 | 0.066 | 0.066 |
| Dead time/Pile-up | 0.1 | 0.006 | 0.006 |
| Self-absorption (wholly embodied in NIST “Full-energy peak detection efficiency”) | 0.065 | – | – |
| Stability (wholly embodied in NIST “Full-energy peak detection efficiency”) | 0.1 | – | – |
| Gravimetric (wholly embodied in NIST “Source activity”) | 0.02 | – | – |
| 228Th impurity | <0.001 | 0.004 | 0.004 |
|
| |||
| Combined standard uncertainty, uc | 0.63 | 0.8 | 0.8 |
| uc using correlation calculation from the GUM | 0.59 | 0.59 | |
4.2. NIST measurements of Iγ
Sources were measured on four HPGe detectors. The T-detector, G-detector, B-detector, and X-detector have a FWHM for the 241 keV line of 1.22 keV, 1.32 keV, 1.17 keV and 0.69 keV, respectively.3 All four detectors were used with source-to-detector distances ranging from 20 cm to 1 m. Measurement times varied between 7 h and 16 h. For the E2-A2 source, Iγ was determined from a subset of measurements taken from 10 d to 17 d after tsep. Source E3-A2 was measured from 6 d to 30 d after tsep and the E4-A2 was measured from 7 d to 21 d after tsep. The efficiency curves for the NIST detectors have been established with a series of traceable sources that cover an energy range from 35 keV to 1.8 MeV (IEC 61452, 1995; Debertin and Helmer, 1988).
For the X-detector, there were a total of 25 measurements for the E2-A2, E3-A2, and E4-A2 sources at 25 cm and 40 cm source-to-detector distances. There were a total of 13 measurements performed in the T-detector, G-detector, and B-detector (for the E2-A2, E3-A2, and E4-A2 sources). These measurements were used to corroborate the values obtained using the X-detector. We report values for Iγ obtained using the measurements from all detectors and from the X-detector alone. Only the X-detector can resolve the 238/241 keV doublet (Fig. 4).
Fig. 4.

The X-detector (black) at NIST resolves the 238/241 keV doublet. The spectrum acquired with the T-Detector (red) is typical of the other detectors used at NIST and NPL, where the doublet is not completely resolved. (For interpretation of the references to color in this figure legend, the reader is referred to the Web version of this article.)
Two different fitting programs were used to determine the peak area of the 241 keV line; these were Genie 2000 (Genie 2000) and the LET + HET fitting method (Section 4.1 and Collins et al., 2020). Where the LET + HET fit uses a Gaussian with a low- and a high-energy tail, the Genie 2000 program uses a Gaussian peak with a fixed low-energy tail only. Fig. 5 shows the fit residuals for the 238/241 keV doublet.
Fig. 5.

Genie 2000 (red circles) and LET + HET (black crosses) fit of the 238/241 keV doublet for the X-detector spectrum, collected with source E2-A2. The residuals were extracted using a program provided by Mirion. (For interpretation of the references to color in this figure legend, the reader is referred to the Web version of this article.)
In E2, E3, and E4, Iγ was calculated from HPGe measurements and the TDCR-determined activity. The Iγ calculated from the peak areas determined with the Genie 2000 fit and the LET + HET fit were consistent (Table 8). Some systematic experiment-to-experiment variation was evident in the Iγ values obtained from all detectors (Fig. 6a), but the effect was more pronounced in the data from the X-detector (Fig. 6b), which fully resolves the 238/241 keV doublet. This is consistent with the trend in IC calibration factors determined during the primary standardization (Napoli et al., 2020a), which could be interpreted as indicative of a systematic bias in the TDCR-determined activity in E3; however, the magnitude of the Iγ variance is much larger than the IC variance. The data were checked for normality using the Shapiro–Wilk test with an alpha level of 0.05. For all the data sets except the Genie 2000 fit of E3-A2 (Fig. 6a), normality could not be rejected.
Fig. 6.

Emission intensities, Iγ (expressed per 100 disintegrations of 224Ra) determined with (top) all HPGe detectors and (bottom) only the X-detector. The top figure shows the X-detector as squares and all other detectors as triangle with the Genie 2000 fits shown as solid and LET + HET fits as open. The two fitting methods return nearly identical results in the majority of cases. The Iγ determined in E3 appeared lower than in E2 and E4.
Net peak areas were corrected for natural background (232Th decay chain). The uncertainty on each Iγ was obtained by estimating each uncertainty component (Table 8) and by calculating the correlation and covariance matrices as described in the GUM (JCGM, 2008). The weighted mean calculated over all experiments using the Genie 2000 fitting gave Iγ = 3.989(16); using the LET + HET fit, Iγ = 3.991(16) where the stated uncertainties are the standard deviation of the weighted mean. The LET + HET Iγ was ultimately adopted, with the uncertainty estimated as that of the most precise determination (see Section 6.1.3).
Small differences in the averaged values of Iγ were observed, depending on how data were combined. The Iγ was obtained using only the X-detector measurements, Iγ (x), using all the detectors except the X-detector measurements, Iγ (all but x), and using all the detectors including the X-detector measurements, Iγ (all). The average ratios obtained for these different data combinations were Iγ (x)/Iγ (all but x) = 1.004 and Iγ (all)/Iγ (all but x) = 1.001, when using Genie 2000 for fitting the γ-ray lines.
The value for Iγ determined for the bilateral comparison was 0.50% (E2) to 2.1% (E3) greater than in previous experiments, as shown in Fig. 7 and Table 9.
Fig. 7.

NIST-determined (using the X-detector) values for Iγ (expressed per 100 disintegrations of 224Ra) in E2, E3, E4, and the bilateral comparison (S3). Results using the LET + HET fits are shown.
Table 9.
Summary of Iγ values (expressed per 100 disintegrations of 224Ra) determined at NIST in different experiments with different fits. Stated uncertainties are the combined standard uncertainties estimated as shown in Table 8. The LET + HET fits were used for the reported Iγ.
| Source | Fit | I γ |
|---|---|---|
| E2-A2 | Genie (2000) | 4.007(23) |
| E2-A2 | LET + HET | 4.008(23) |
| E3-A2 | Genie (2000) | 3.946(30) |
| E3-A2 | LET + HET | 3.943(30) |
| E4-A2 | Genie (2000) | 3.979(26) |
| E4-A2 | LET + HET | 3.987(26) |
| S3-A | Genie (2000) | 4.027(36) |
| S3-A | LET + HET | 4.028(36) |
5. Half-life
At NPL, HPGe spectrometry data were analyzed to estimate the 224Ra half-life. NIST considered data acquired by ionization chamber (AutoIC and VIC) and HPGe spectrometry. Both laboratories performed numerous tests to assure that the half-lives were based on consistent data sets and that uncertainty evaluations were realistic.
5.1. NPL half-life determination
At NPL, the half-life was determined using the solution from S3 with the measurement campaign commencing 6.03 d after tsep and continuing for 26.2 d (≈7.6 half-lives), with a total of 226 spectra acquired. The time of acquisition increased over the initial 5.3 d from ≈2700 s to ≈7600 s to ensure a net peak area in the 238/241 keV doublet of 1 × 10⁶ counts. After this period, the acquisition time was incremented in fixed time periods of 7200 s (5.4 d to 7.8 d), 10 800 s (7.9 d to 10.8 d), 14 400 s (11.0 d to 13.3 d) and 20 000 s (13.5 d to 26.2 d). The acquisitions were performed using a HPGe γ-ray spectrometer connected to a LYNX DSA operating in loss-free counting mode. The correction by the LYNX DSA for dead time and pulse pile-up had previously been shown to be consistent over the count rates observed to within 0.10%.
The half-life was determined by following the change in count rate observed from the sum (Σ) of the net peak areas of the 238/241 keV doublet and the 583 keV (208Tl) FEP. The net peak areas for each measurement were corrected for background interferences and the presence of 228Th (fTh-228 = 3.6 × 10⁻⁵ at (tsep + 6.03 d)). A weighted non-linear least-squares fit to the corrected count rates was performed using the function:
| (3) |
where R(t) is the count rate at time t, R(0) is the count rate at t = 0 (= tsep + 6.03 d), λ is the decay constant of 224Ra and Δt is the time of acquisition. By the incremental variation of the R(0) and λ parameter the ‘best’ fit of the dataset was achieved to provide the half-life value for that dataset. The weight component for each datum was determined from the combination of the net peak area statistics, background and 228Th correction uncertainty components. The net peak area statistical component was dominant throughout. The z-score of the residuals for the fit to the summed net peak area is shown in Fig. 8. Data with z-score greater than three have been removed from the analysis as extreme outliers. The rejection of these outliers had no significant impact on the determined half-life value (<0.0001 d). For the purposes of the reported half-life, the dataset that represents the summed net peak areas of all three γ-ray emissions has been used.
Fig. 8.

Residuals (as z-score) of the weighted non-linear least-squares fit for the summed net peak areas of the 238 keV, 241 keV, and 583 keV full-energy peaks. The dashed lines represent a z-score of three; the red crosses indicate those data that have been removed as outliers. (For interpretation of the references to color in this figure legend, the reader is referred to the Web version of this article.)
The dataset was investigated for anomalies that may be hidden and result in an anomalous result. Residuals were scrutinized for trends and medium-term oscillations. There were no visible complications within the datasets. In another test, half-lives were determined by fitting growing subsets of the data, starting with the earliest time points (after equilibration) and extending forward in time and starting with the last points and extending backwards in time as suggested by Walz et al. (1983) and Pommé (2007; 2015). The evolutions of the ‘forward’ and ‘backward’ (not pictured) fits show large oscillations at the edges prior to convergence; in the forward fit, this occurs after approximately 6 d (Fig. 9).
Fig. 9.

Plots of the ‘forward’ fit (Left) and the statistical sampling (Right) for the summed dataset. The dashed and dotted red lines in the ‘forward’ fit represent the half-life determined and the evolution of the combined uncertainty of the half-life. Note here that t0 = tsep + 6.03 d. The half-life can be observed to stabilize after approximately 6 d and shows no significant oscillations. A Cauchy function fits (red line) the statistical sampling plot with no observable weighting in the tails to either side of the centroid. The half-life through the statistical sampling is consistent with that of the weighted least-squares fit of the exponential. (For interpretation of the references to color in this figure legend, the reader is referred to the Web version of this article.)
In another diagnostic, the data were analyzed in pairs of points; each measurement was compared to all preceding measurements to calculate half-life values according to
| (4) |
where t is the time between two measurements and R is their ratio. A histogram of the half-lives calculated from Equation (4) shows a superposition of Cauchy distributions centered on the most probable half-life value (Pommé, 2007; Lorusso et al., 2017), which is in agreement with the value from a least-squares fit of the data. The distributions were found to be free of asymmetric tailing (Fig. 9).
A further least-squares fit was performed with an additional function to represent the 228Th contribution. This was used to judge the capability of the least-squares fit method to identify the 228Th contribution and if the ‘best’ fit value was in accord with the measured value. The least-squares fit was performed with the R0(228Th) as a free parameter while the half-life was kept fixed. In the 238/241 keV doublet dataset, this led to a significantly higher value for the initial 228Th activity, with fTh-228 = 4.8 × 10⁻⁵ at (t0 = tsep + 6.03 d), while the 583 keV dataset provided fTh-228 = 0 at t0. This is an illustrative problem with adding a parameter to a least-squares fit model for an impurity (or other effect) that may not be present, especially in the case of low counting statistics where uncertainties on that parameter value will be large. In the present case, this change in the initial impurity fraction did not result in any significant change to the half-life determined with either dataset, with the greatest change being approximately 0.0010 d.
The standard uncertainty for the half-life was estimated using the methodology described by Pommé (2007; 2015). The high frequency components were defined as the statistical uncertainty, estimated from the standard deviation of the residuals. The sample was kept in position for the entirety of the campaign and no cyclical behavior in the residuals was observed, so no medium frequency component has been included in the uncertainty budget. The low-frequency components were identified as the fitting of the full-energy peak (including continuum), the detection efficiency stability, dead-time and pulse-pileup, and the background and 228Th correction. The stability uncertainty value has been estimated from systematic quality checks performed over the lifetime of the detector used. The dead-time and pile-up uncertainty has been estimated from validation measurements performed when the system was installed. The background and 228Th correction uncertainty have been derived from an average of the uncertainties attributed to these corrections on the first and last measurement used. The propagation of all the uncertainty components over the duration of the measurement campaign is shown in Fig. 10. The uncertainty budget is provided in Table 10. From Fig. 10, it is clear that the fitting component dominates the final uncertainty on the half-life. The 224Ra half-life and its standard uncertainty determined at NPL via HPGe γ-ray spectrometry was T1/2 = 3.6262 (48) d.
Fig. 10.

Evolution of the propagated uncertainty components with time. It can be observed that the combined uncertainty does not begin to increase and thus the dataset does not need to be cropped to optimize the standard uncertainty of the half-life. The stability and dead time propagation are the same, as indicated by the single line being labelled with both components.
Table 10.
Uncertainty budget for the half-life determined by HPGe at NPL using the summed net areas of the 238 keV, 241 keV, and 583 keV full-energy peaks.
| Component | uA/A/% | n | Propagation Factor | uT1/2/T1/2/% |
|---|---|---|---|---|
| Standard deviation of the residuals | 0.18 | 221 | 0.038 | 0.0066 |
| Fitting | 0.30 | 1 | 0.399 | 0.12 |
| Stability | 0.10 | 1 | 0.399 | 0.040 |
| Dead time/Pile-up | 0.10 | 1 | 0.399 | 0.040 |
| Background correction | 0.0050 | 1 | 0.399 | 0.0020 |
| 228Th correction | 0.013 | 1 | 0.399 | 0.0051 |
|
| ||||
| Combined standard uncertainty, uc | 0.13 | |||
5.2. NIST half-life determination
5.2.1. Ionization chamber
Half-life measurements were carried out in E2 and in a July 2019 experiment designated E7. The VIC data were collected without removing the ampoule from the chamber; regular periodic current measurements were taken via the LabVIEW interface to the electrometer. Data were also acquired with an automated ionization chamber (AutoIC; Fitzgerald, 2010) by alternating long measurement periods of a 224Ra source, a background, and 241Am and 226Ra reference sources. The currents measured for the reference sources were scrutinized to assure stable behavior of the IC. The half-life data were analyzed in two ways; fitting the background- and impurity-corrected currents from the 224Ra source directly and fitting the response ratios of 224Ra currents to bracketing 226Ra current measurements (a common practice; see, e.g., Schrader, 2004). The half-lives calculated from the absolute currents (T1/2(current)) and the ratios T1/2(ratios)) were consistent, with T1/2(current)/T1/2(ratios) = 0.99994(73) where the stated uncertainty is solely from T1/2(current).
In E2, IC measurements on the AutoIC and VIC began prior to the source reaching equilibrium. Using Monte Carlo predicted IC responses and solutions to the Bateman equation (Bateman, 1910), we reproduced the increasing response during the ingrowth of 224Ra progeny with relative fit residuals <0.1%. The simulation was also used to make the small corrections for 228Th breakthrough and to estimate the sensitivity of the half-life to the presence of 228Th. While consistency with expected decay has been cited in the literature as an indication of sample purity (Atcher et al., 1988; Westrøm et al., 2018a), we found that fTh-228 = 10−5 cannot be detected by half-life measurements with statistical significance (2σ) without > 50 d of measurement (Bergeron et al., 2020).
Because predicting IC response during the ingrowth period requires multiple model inputs (half-lives, branching ratios, γ-ray energies, instrument response curve, etc.), for the half-life determination, we consider only data collected after the source reached equilibrium. The equilibration period and potentially imperfect corrections for 228Th breakthrough mean that the apparent half-life will be sensitive to the time window from which data are sampled. We performed several tests (including those described in Section 5.1) in order to assure that our half-lives were based on consistent data sets and that uncertainty evaluations were realistic.
As with the NPL data, running “forward” and “reverse” fits show extreme oscillations at the edges (where the data subsets are small and adding individual points is impactful), but converge with some oscillation to consistent values. Half-lives from Cauchy distributions were in good agreement with values from least-squares fits of the data and were free of asymmetric tailing. We used the Cauchy distribution approach with several subsets of the data in order to further scrutinize the sensitivity of the half-life determination to the time window. It appeared that, even with rigorous corrections for 228Th, the time windows that included the latest points gave longer half-lives. Interestingly, in analyses of the same time windows using a typical weighted least-squares approach, this effect vanished. This can be understood because the latest time points, with lower weights due to poorer statistics, contribute less to a weighted least-squares fit; the distribution-based approach is unweighted. These diagnostics, along with lag analyses, indicated that medium term effects and time window-sensitivity should be included in the uncertainty evaluation.
The final half-lives (summarized in Table 12) were calculated from a weighted least-squares fit with weighting components for the measurement precision, background, and impurity (228Th breakthrough) uncertainty. In all cases, the measurement precision was the dominant contributor to the fit uncertainty. The relatively high fit uncertainty for the VIC measurement (Table 11) is due to relatively low initial activity of the source. Fit residuals for the IC determinations are shown in Fig. 11 and detailed uncertainty budgets are included in Table 11. The IC results were combined by instrument and then overall to properly account for within- and between-instrument components of uncertainty. The 224Ra half-life and its standard uncertainty determined at NIST by IC was T1/2 = 3.6321(28) d.
Table 12.
Summary of half-lives determined in this study. For the NIST HPGe half-lives, the fits performed using Genie, 2000 were used to calculate the half-lives for each gamma-ray emission and the summation of all three. For both NPL and NIST, the reported half-life of 224Ra by HPGe was taken from the summation of the net peak areas of the three gamma-ray emissions analyzed. The uncertainty on the final NPL and NIST HPGe half-life is the combined standard uncertainty of the components in Tables 10 and 13. The “final” half-lives are given in bold.
| Line/keV | Fit | T1/2/d | uc/d | |
|---|---|---|---|---|
| NIST - IC | 3.6321 | 0.0028 | ||
|
| ||||
| NIST - HPGe | 238 | Genie (2000) | 3.6327 | 0.0027 |
| 241 | 3.6317 | 0.0035 | ||
| 583 | 3.6307 | 0.0028 | ||
| Σ238,241,583 | 3.6323 | 0.0027 | ||
|
|
|
|||
| NPL - HPGe | Σ238,241 | LET + HET | 3.6269 | 0.0048 |
| 583 | 3.6235 | 0.0048 | ||
| Σ238,241,583 | 3.6262 | 0.0048 | ||
Table 11.
Uncertainty budget for IC-based half-life determinations at NIST. The results were combined by instrument and then overall to treat within- and between-instrument components of uncertainty (see text).
| Component |
ui/% |
||
|---|---|---|---|
| E2 VIC | E2 AutoIC | E7 AutoIC | |
| Fit uncertainty | 0.23 | 0.019 | 0.004 |
| Background (wholly embodied in the “Fit uncertainty”) | |||
| Th-228 impurity (0.002%–0.004% and wholly embodied in the “Fit uncertainty” in E2; considered separately in E7) | 0.024 | ||
| Selected time window | 0.10 | 0.025 | 0.001 |
| Medium-term oscillation | 0.012 | 0.060 | |
| Electrometer linearity (estimated from measurements over the same current range with a decaying 99mTc or 18F source) | 0.05 | 0.035 | |
|
| |||
| Combined standard uncertainty, uc | 0.25 | 0.049 | 0.073 |
Fig. 11.

Fit residuals for ionization chamber half-life determinations plotted as z-scores. The VIC data from E2 (panel A) show the points collected at 15 min intervals; the white line is a running 25-point average. For the AutoIC data, the averaging periods were 1 d for E2 (panel B) and 8.5 h for E7 (panel C).
5.2.2. HPGe spectrometry
Half-life data were acquired using the X-detector with source E2-A2 at a source-to-detector distance of 25 cm. The source was not moved throughout the duration of the measurement (from 13 d to 41 d after tsep) and the measurement live time was set at 12 h. The 238 keV (from 212Pb decay), 241 keV (from 224Ra decay), and 583 keV (from 208Tl decay) peaks were analyzed with corrections for background and 228Th impurity applied to each measurement. It was not necessary to apply a pile-up correction for the measured count rates, but an uncertainty was estimated (for the lack of such correction) and added to the uncertainty budget. The net peak areas were determined using the GENIE 2000 software. The weighted least-square fitting of the individual gamma-ray emission datasets was performed using the same procedure as in section 5.1. Data were fit to Eq.[3], with weighting components for the counting precision, background correction, and impurity correction uncertainty for each data point. The analysis of these datasets showed some significant outliers in three of the initial four data points (these can be observed in the residuals of the summation of the three γ-ray emission dataset, discussed later, in Fig. 12), which, due to their weight in the least-squares fitting, created a trend in the residuals. The reason for these outlier events could not be identified. Since there was no significant change in the net peak areas between GENIE 2000 and LET + HET fitting and the outliers were present in the 583 keV dataset, it was decided that those specific measurements, rather than the peak fitting, were problematic. A decision was taken to cut the first four data from each of the datasets, thus reducing the duration of the campaign by ≈ 2 d. The resulting residuals of the fits were significantly improved. The half-lives determined for each γ-ray emission dataset using this manipulated data also showed improved consistency; these are provided in Table 12. The final procedure to determine the half-life was to combine the corrected net peak areas of each gamma-ray emission into one dataset as was done in section 5.1, with weighting components formed from the statistical uncertainties of each net peak area combined in quadrature along with the background correction and impurity correction uncertainties. The initial four data points were again rejected prior to the least-squares fit. Further outliers were rejected (where z-score > 3) before re-fitting. The residuals of the fit and outlier rejection are presented in Fig. 12. The half-life and its standard uncertainty determined from this combined dataset was T1/2(224Ra) = 3.6323(27) d. The uncertainty budget is provided in Table 13 and was assessed in the same manner as performed at NPL in section 5.1. For comparison, the half-life determined with the whole dataset, and only considering the standard deviation of the residuals component of uncertainty, was 3.63445(94) d. As would be expected, the value of this uncertainty component is inferior to that observed for the manipulated dataset (3.63231(58) d). It cannot be argued statistically that these half-life values are definitively different (z-score = 1.9) when compared using only the standard deviation of the residuals. However, analysis of the residuals strongly suggests the ‘correctness’ of using the manipulated dataset for the final determination. No additional uncertainty has been introduced to cover the difference between the two values as 1) the manipulation of the complete dataset corrects an error in the dataset and 2) the difference is covered by the reported combined standard uncertainty.
Fig. 12.

The residuals for the weighted non-linear least-squares fit of the NIST HPGe half-life plotted as z-scores. The residuals are shown for the summed 238 keV, 241 keV and 583 keV net peak areas calculated with Genie 2000. The rejected data points, considered as outliers, are shown as red crosses. An estimated uncertainty for the medium-term (≈6 d) oscillation was included in the combined standard uncertainty on the half-life. The dashed lines show where the z-score equals three. (For interpretation of the references to colour in this figure legend, the reader is referred to the Web version of this article.)
Table 13.
Uncertainty budget for the half-life determined by HPGe spectrometry at NIST using the Genie 2000 fit of the net peak area summation of the 238 keV, 241 keV and 583 keV peaks.
| Component | uA/A/% | n | Propagation Factor | uT1/2/T1/2/% |
|---|---|---|---|---|
| Standard deviation of the residuals | 0.19 | 47 | 0.083 | 0.0066 |
| Trends in residuals | – | – | – | 0.018 |
| Fitting | 0.10 | 1 | 0.405 | 0.040 |
| Stability | 0.10 | 1 | 0.405 | 0.040 |
| Linearity (Dead time/Pile-up) | 0.081 | 1 | 0.405 | 0.033 |
| Background correction | 0.034 | 1 | 0.405 | 0.014 |
| 228Th correction | 0.048 | 1 | 0.405 | 0.020 |
|
| ||||
| Combined standard uncertainty, uc | 0.074 | |||
The diagnostic tests applied to the IC data (Section 5.2.1) were applied to the HPGe data (after outlier rejection) as well. Running “forward” and “reverse” fits showed the expected extreme oscillations at the edges with oscillations prior to convergence. Compiling the Cauchy distribution from pairs of data points showed no asymmetric tailing; histograms built with subsets of the data showed some dependence on the time window sampled but converged when the latest time points were included. Lag analyses showed a medium-term periodicity that was included in the uncertainty evaluation.
6. Discussion
6.1. Activity & Iγ comparison and historical context
6.1.1. Comparison of activity standards via ionization chamber calibrations
The NIST and NPL primary activity standards for 224Ra were indirectly compared via VIC calibrations. The relationship between the chambers was established when they were commissioned (NPL, 1984). For a 5 mL ampoule containing 5 mL of 224RaCl2 in 1 mol L−1 HCl, NIST found KVIC = 13.97(5) pA MBq−1 (Napoli et al., 2020a). NPL found KVIC = 14.09(9) pA MBq−1 for a 5 mL ISO ampoule containing 3.6 mL of 224RaCl2 in 3 mol L−1 HNO3. With an estimated correction for volume (solution height), we calculate the ratio KVIC, NIST/KVIC,NPL = 0.9968(33) (where the stated uncertainty is solely from the NIST KVIC), indicating accord at k = 1.
6.1.2. Direct bilateral comparison
The laboratories arrived at independent results for the massic activity of solution S3 and the unblinding process assured that values were ‘locked-in’ before sharing. NPL communicated a massic activity to NIST, but did not immediately share the source mass. NIST then communicated a value for the total source activity to NPL. Only then did NPL share the source mass so that the results were fully unblinded. The activities determined with the NPL primary standardization (DCC) and the NIST calibration coefficient (KVIC) derived from primary standards were in accord, with a ratio between the activities of ANIST/ANPL =1.0012(57) where the stated uncertainty is solely the uncertainty on the NIST-determined (VIC) activity.
The massic activity of the S3 solution was also determined by each NMI using HPGe γ-ray spectrometry to give an indication of the difference between the detectors used by the respective laboratories. Using the value Iγ = 4.12(4) recommended by Bé et al. (2004), the activities were determined from the integrated FEP count rate (R0) for the 241 keV γ-ray according to A(224Ra) = R0/(ε Iγ). For the comparison, the NMIs considered only uncertainty components specific to their systems; the DDEP-recommended Iγ was used by both laboratories, so its uncertainty does not matter to the comparison and was not included. The ratio of activities determined by HPGe γ-ray spectrometry was ANIST/ANPL = 1.000(9) where the stated uncertainty is solely the uncertainty on the NIST-determined (HPGe) activity. This gives us confidence that our respective HPGe γ-ray spectrometer FEP detection efficiency calibrations are comparable at 241 keV.
The activities reported for all four systems are shown in Fig. 13. While we find that there is agreement between the primary standardization techniques and separately between the two γ-ray spectrometer systems, we observe that there is a clear positive bias of the activities reported by the primary standardizations to those determined by γ-ray spectrometers using the evaluated absolute intensity. This indicates that the evaluated absolute γ-ray emission intensity is currently over-estimated, and new precision determinations were required based on the new primary standardizations presented herein.
Fig. 13.

Reported activities per unit mass reported by NPL and NIST for the primary standardization, ionization chamber, and HPGe γ-ray spectrometers. The activities reported by the primary standardization and NIST ionization chamber are ≈2.2% higher than those determined by the HPGe γ-ray spectrometers using the DDEP recommended absolute emission intensity of the 241 keV γ ray (Bé et al., 2004).
6.1.3. Absolute intensity of the 241 keV γ ray
The Iγ values determined at NIST (Iγ = 4.028(36)) and at NPL (Iγ = 4.037(25)) during the bilateral comparison, based on local activity standards, are consistent within their standard uncertainties (relative difference of 0.2%). The values determined at NIST in earlier experiments (using the activities in Table 2) were lower within a range of ≈ 0.5% to ≈ 2% relative difference, though still consistent with the historical dataset (Fig. 14). NPL and NIST report final absolute emission intensities of Iγ = 4.032(25) and Iγ = 3.991(23) respectively, based on the weighted mean of all determinations made at each NMI (see Tables 7 and 9). As there are multiple significantly correlated uncertainties between each determination, the most precise standard uncertainty quoted from each NMI’s set of determinations was adopted as the estimated uncertainty for the weighted mean.
Fig. 14.

Values for Iγ (expressed per 100 disintegrations of 224Ra) included in the DDEP evaluation (Bé et al., 2004) and determined in this study. Note that the both values reported in Gehrke et al. (1984) are shown here; the DDEP evaluation used a weighted mean of these values (4.17(4)). The DDEP-recommended value is shown as a solid black line, with its standard uncertainty represented as dashed black lines. See text for references.
Table 7.
Details of the massic activity, Am, weighted mean count rate, R0, and absolute emission intensity for the 241 keV γ-ray, Iγ (expressed per 100 disintegrations of 224Ra), for each of the solutions measured at NPL. For R0, the uncertainty is the standard uncertainty of the weighted mean only. For Am and Iγ, the stated uncertainty is the combined standard uncertainty.
| Solution | Am/kBq g−1 | R0/s−1 g−1 | I γ |
|---|---|---|---|
| S1 | 242.9(15) | 13.160(28) | 4.042(37) |
| S2 | 182.0(11) | 9.790(20) | 4.013(35) |
| S3 | 29.921(81) | 1.6194(17) | 4.037(25) |
As Fig. 14 shows, the historical dataset (Peghaire, 1969; Dalmasso et al., 1971; Kurcewicz et al., 1977; Sadasivan and Raghunath, 1982; Schötzig and Debertin, 1983; Vaninbroukx and Hansen, 1983; Bortels et al., 1984; Gehrke et al., 1984; Lin and Harbottle, 1992) is consistent with a lower value than the DDEP-recommended Iγ = 4.12(4), which is heavily influenced by the determination described in (Gehrke et al., 1984). The NNDC recommendation (Browne and Tuli, 2011) is Iγ = 4.10 (5), taken from Bambynek et al. (1991) and again heavily influenced by the Gehrke et al. value.
Gehrke et al. (1984) determined the absolute emission intensity by two methods. Initially, a sample of 232U that was in equilibrium (assumed) with its decay progeny was investigated using an 8% semi-planar Ge detector. This detector was unable to resolve the 238 keV and 241 keV doublet adequately; therefore a 5% planar detector was used. Gehrke et al. (1984) fortunately present the spectra collected from both detectors. From Figs. 3 and 4 in that work, some additional ‘structure’ to the right side of the doublet from the 5% planar detector can be observed. It is not clear if this is caused by high-energy tailing from the 238 keV peak, but this could explain the high result determined by Gehrke for this experiment. An additional measurement was performed following the ingrowth of the decay progeny of the 232U; this resulted in a lower value of 3.99 (14). Both Gehrke values are shown in Fig. 14. Gehrke et al. (1984) specifically state that no corrections were made for random summing, which may indicate that any high-energy tailing would be of reduced influence. The authors comment that there was a bias between the two methods ranging from 1.2% to 4.8% lower, with an average of 2.6%. While the values agreed, probably due to the excessive uncertainty on the value determined from the ingrowth, this might be indicative of some unaccounted for ‘instability’. The value determined from the ingrowth measurements is typical of the values determined in this work and the other literature values.
Using the Lweight4 program, used by DDEP in their nuclear decay data evaluations (Bé et al., 2002) and that implements the Limitation of Relative Statistical Weights Method (Browne, 1988), the absolute intensity for the 241 keV γ ray was estimated. Both values reported by Gehrke et al. (1984) were initially included in the evaluation, the software proceeded to reject the precise value (Iγ = 4.19(4)) due to the Chauvenet criterion (Chauvenet, 1891). The remaining values formed a consistent dataset ((χ2 = 0.33; χcrit = 2.32), with the NPL and NIST absolute intensity values sharing approximately 0.87 of the weight in the weighted mean. A new estimate of the absolute emission intensity for the 241 keV γ ray from decay of 224Ra (γ1,0(Rn) emission) of Iγ = 4.011(16) was determined from the weighted mean and the internal standard uncertainty.
6.2. Half-life comparison and impact
The DDEP evaluated half-life for 224Ra, 3.631(2) d (Bé et al., 2004), was calculated as the least-squares weighted mean of measurements from Lloyd et al. (1962), Jordan et al. (1971), and Schrader (2004). With its orders-of-magnitude smaller reported uncertainty, the half-life value (3.6319(23) d) reported by Schrader (2004) is the most precise measurement contributing to the evaluated half-life and the evaluator noted that “further measurements are required to determine this half-life with greater confidence.” (Nichols, 2011).
The evaluated half-life for 224Ra given by the National Nuclear Data Center (NNDC, 2019) is 3.66(4) d, taken from (Browne and Tuli, 2011); it seems to be based solely on the Jordan et al. (1971) value. A more recent evaluation reported in Nuclear Data Sheets (Singh and Singh, 2015) gives the Schrader (2004) value, 3.6319(23) d as the evaluated half-life.
The half-life reported by Schrader (2004) was measured by ionization chamber and 224Ra was presented as an example of a radionuclide with a complex decay chain where the half-life must be determined either for a sample in perfect equilibrium or using an analytical function to account for the ingrowth of progeny. Schrader indicates that ≤184 measurements were acquired over 4.0 half-lives. Based on the presented residuals, the bulk of the data were acquired over a period spanning ≈5 d, with approximately 25 points per day.
The half-lives used in the evaluations and determined in this work are summarized in Fig. 15. An estimate for the half-life was determined using the LWeight4 program. The LWeight4 program rejected the value reported by Jordan et al. (1971) due to the Chauvenet criterion; the remaining values reported in the literature and the values determined in this work formed a consistent dataset (χ2 = 0.67; χcrit = 3.32). A new estimate of T1/2(224Ra) = 3.6313(14) d was determined from the weighted mean and the internal standard uncertainty.
Fig. 15.

Compiled half-lives from Lloyd et al. (1962), Jordan et al. (1971), Schrader (2004), and this work (see Table 12 for explanation of weighted means and uncertainties). The DDEP evaluated half-life (Bé et al., 2004) is indicated as a solid black line, with its standard uncertainty shown as dotted lines.
This new estimate is not significantly different from the recommended half-life used throughout this work and does not impact the activity results of the primary activity standardizations performed by NPL and NIST.
7. Summary and conclusions
The NPL and NIST have established primary activity standards for 224Ra based on 4π(LS)-γ digital coincidence counting (DCC) and triple-to-double coincidence ratio (TDCR) liquid scintillation counting, respectively. The laboratories compared ionization chamber (IC) calibrations as an indirect comparison of the activity standards and established accord. A direct comparison based on HPGe spectrometry showed the standards to agree with a ratio ANIST/ANPL = 1.000(9).
The activity standards were used with HPGe spectrometry to measure new precise values for the absolute γ-ray emission intensity (Iγ) for the 241 keV γ ray following the decay of 224Ra (γ1,0(Rn) emission). The new measurements indicate that the Iγ recommended by the decay data evaluation project (DDEP; Bé et al., 2004) should be revised (Table 14).
Table 14.
Summary of nuclear data reported in this work and the recommended value from the decay data evaluation project (DDEP; Bé et al., 2004). Values for Iγ are expressed per 100 disintegrations of 224Ra and were determined from the weighted mean of all the respective results of each laboratory and the standard uncertainty estimated as that of the most precise individual determination.
| NPL-HPGe | NIST-HPGe | NIST-IC | DDEP | Re-evaluation (this work) | |
|---|---|---|---|---|---|
| T1/2/ d | 3.6262 (48) | 3.6323 (27) | 3.6321 (28) | 3.631 (2) | 3.6313(14) |
| Iγ | 4.032(25) | 3.991(23) | – | 4.12(4) | 4.011(16) |
The 224Ra half-life was also measured at both laboratories by IC and HPGe spectrometry. The new measurements were consistent with the DDEP-recommended value and including them in a new evaluation would reduce the uncertainty (Table 14).
The National standards for 224Ra activity allow precision calibrations and establish the potential for traceability chains which will be increasingly important as interest in alpha therapy grows. A revision to Iγ will impact spectrometry-based calibrations for medical and non-medical applications alike, and may be of interest in nuclear physics-based tests of the Standard Model of physics. Finally, while the improved uncertainty on the 224Ra half-life will have minimal impact on decay corrections for less than a few half-lives, environmental techniques that use 224Ra as a tracer will be made more precise.
Acknowledgements
This work was supported in part by Oncoinvent AS (Oslo, Norway). EN was supported by the Industrial PhD project n.259820/030 of the Norwegian National Research Council. The work performed at NPL was supported in full by the National Measurements System Programmes Unit of the UK’s Department for Business, Energy and Industrial Strategy. The final synthesis of this collaborative work owes much to Ambler Thompson and Barry N. Taylor (NIST). We are grateful to Ron Collé (NIST) for critical input on the manuscript.
Footnotes
Declaration of competing interest
The authors declare the following financial interests/personal relationships which may be considered as potential competing interests: This work was funded in part by Oncoinvent AS, Norway. EN was employed by and owns stock in Oncoinvent AS, Norway. EN was supported by the Industrial PhD project n.259820/030 of the Norwegian National Research Council. No other potential conflicts of interest relevant to this article exist.
Certain commercial equipment, instruments, or materials are identified in this paper to foster understanding. Such identification does not imply recommendation by the National Institute of Standards and Technology, nor does it imply that the materials or equipment identified are necessarily the best available for the purpose.
Note that the 224Ra nuclear data are from the decay data evaluation project (DDEP), cited as “Bé et al., 2004”. In practice, the data were taken from the 2011 update accessed online (http://www.lnhb.fr/nuclear-data/nuclear-data-table/).
The HPGe detectors have the following dimensions: T-detector – diameter (ø) = 55 mm, length (ℓ) = 49 mm, 1.5 mm thick Al window; G-detector – ø = 58.0 mm, ℓ = 57.6 mm, 0.3 μm thick Be window; B-detector – ø = 54.9 mm, ℓ = 54.2 mm, 0.3 μm thick Be window; X-detector – ø = 43.6 mm, ℓ = 36.2 mm, 0.5 μm thick Be window.
References
- Atcher RW, Friedman AM, Hines JJ, 1988. An improved generator for the production of 212Pb and 212Bi from 224Ra. Appl. Radiat. Isot 39, 283–286. [DOI] [PubMed] [Google Scholar]
- Bambynek W, Barta T, Jedlovszky R, Christmas P, Coursol N, Debertin K, Helmer RG, Nichols AL, Schima FJ, Yoshizawa Y., 1991. IAEA-TECDOC-619: X-Ray and Gamma-Ray Standards for Detector Calibration. IAEA. [Google Scholar]
- Bateman H., 1910. The solution of a system of differential equations occurring in the theory of radioactive transformations. Proc. Camb. Phil. Soc 15, 423–427. [Google Scholar]
- Bé M-M, Helmer R, Chisté V., 2002. The “Nucléide” database for decay data and the “International decay data evaluation project”. J. Nucl. Sci. Technol 39 (Suppl. 2), 481–484. [Google Scholar]
- Bé M-M, Chisté V, Dulieu C, Browne E, Chechev V, Kuzmenko N, Helmer R, Nichols A, Schonfeld E, Dersch R., 2004. Monographie BIPM-5: Table of Radionuclides (Vol. 2 – A = 151 to 242). Pavillon de Breteuil, F-92310 Severs. Bureau International des Poids et Mesures.
- Bé M-M, Chisté V, Dulieu C, Mougeot X, Chechev VP, Kondev FG, Nichols AL, Huang X, Wang B., 2013. Monographie BIPM-5: Table of Radionuclides (Vol. 7 – A = 14 to 245). Pavillon de Breteuil, F-92310 Severs. Bureau International des Poids et Mesures.
- Bergeron DE, Pibida L, Fitzgerald R., 2020. 228Th Breakthrough in 224Ra Samples: what Can We Know and when can we Know it? 10.1021/scimeetings.0c01048. [DOI]
- Bortels G, Reher D, Vaninbroukx R., 1984. Emission probabilities for the 5.449-MeV alpha particles and 241 keV gamma rays in the 224Ra-220Rn decay. Int. J. Appl. Radiat. Isot 35, 305–310. [Google Scholar]
- Browne E., 1988. Limitation of Relative Statistical Weights, A Method for Evaluating Discrepant Data. INDC(NDS)-363, Appendix 1. International Atomic Energy Agency, Vienna. [Google Scholar]
- Browne E, Tuli J., 2011. Nuclear data Sheets for A = 220*. Nucl. Data Sheets 112, 1115–1161. [Google Scholar]
- Chauvenet W., 1891. A Manual of Spherical and Practical Astronomy, fifth ed. Lippincott Company, Philadelphia. [Google Scholar]
- Collé R., 2019. NISTIR 8254: Ampoules for Radioactivity Standard Reference Materials™. National Institute of Standards and Technology, Washington, D.C. 10.6028/NIST.IR.8254. Retrieved from. [DOI] [Google Scholar]
- Collins SM, Pearce AK, Regan PH, Keightley JD, 2015. Precise measurements of the absolute γ-ray emission probabilities of 223Ra and decay progeny in equilibrium. Appl. Radiat. Isot 102, 15–28. [DOI] [PubMed] [Google Scholar]
- Collins SM, Keightley JD, Ivanov PI, Arinc A, Fenwick AJ, Pearce AK, 2019a. The potential radio-immunotherapeutic α-emitter 227Th - part I: standardisation via primary liquid scintillation techniques and decay progeny ingrowth measurements. Appl. Radiat. Isot 145, 240–250. [DOI] [PubMed] [Google Scholar]
- Collins SM, Keightley JD, Ivanov PI, Arinc A, Fenwick AJ, Pearce AK, 2019b. The potential radio-immunotherapeutic α-emitter 227Th - part II: absolute gamma-ray emission intensities from the excited level of 223Ra. Appl. Radiat. Isot 145, 251–257. [DOI] [PubMed] [Google Scholar]
- Collins SM, Shearman R, Ivanov P, Regan PH, 2020. The impact of high-energy tailing in high-purity germanium gamma-ray spectrometry on the activity determination of 224Ra using the 241.0 keV emission. Appl. Radiat. Isot 157, 109021. [DOI] [PubMed] [Google Scholar]
- Dalmasso J, Ribeiro JP, Gonçalves A, Gil FB, Ferreira JG, 1971. Sur les Intensités Relatives et Quelques Énergies des Spectres α de 238Pu, 232U et 224Ra. C. R. Acad. Sci. Paris 273B, 985–988. [Google Scholar]
- Debertin K, Helmer RG, 1988. Gamma- and X-ray Spectrometry with Semiconductor Detector. Elsevier Science, North-Holland. [Google Scholar]
- Fitzgerald R., 2010. An automated ionization chamber for secondary radioactivity standards. Appl. Radiat. Isot 68, 1507–1509. [DOI] [PubMed] [Google Scholar]
- Fitzgerald R, Collé R, Laureano-Pérez L, Pibida L, Hammond MM, Nour S, Zimmerman BE, 2010. A new primary standardization of 229Th. Appl. Radiat. Isot 68, 1303–1308. [DOI] [PubMed] [Google Scholar]
- Gaffney LP, Butler PA, Scheck M, Hayes AB, Wenander F, Albers M, Bastin B, Bauer C, Blazhev A, Bönig S, Bree N, Cederkäll J, Chupp T, Cline D, Cocolios TE, Davinson T, De Witte H, Diriken J, Grahn T, Herzan A, Huyse M, Jenkins DG, Joss DT, Kesteloot N, Konki J, Kowalczyk M, Kröll Th, Kwan E, Lutter R, Moschner K, Napiorkowski P, Pakarinen J, Pfeiffer M, Radeck D, Reiter P, Reynders K, Rigby SV, Robledo LM, Rudigier M, Sambi S, Seidlitz M, Siebeck B, Stora T, Thoele P, Van Duppen P, Vermeulen MJ, von Schmid M, Voulot D, Warr N, Wimmer K, Wrzosek-Lipska K, Wu CY, Zielinska M., 2013. Studies of pear-shaped nuclei using accelerated radioactive beams. Nature 497, 199–204. [DOI] [PubMed] [Google Scholar]
- Gehrke R, Novick V, Baker J., 1984. γ-ray emission probabilities for the 232U decay chain. Appl. Radiat. Isot 35, 581–589. [Google Scholar]
- Genie, 2000. Spectroscopy Software Customization Tools. Accessed at. http://depni.sinp.msu.ru/~hatta/canberra/Genie%202000%20Customization%20Tools%20Manual.pdf.
- IEC 61452, Nuclear Instrumentation - Measurement of Gamma-Ray Emission Rates of Radionuclides - Calibration and Use of Germanium Spectrometers.
- JCGM, 2008. GUM 1995 with Minor Corrections. JCGM 100:2008. BIPM. Evaluation of Measurement Data — Guide to the Expression of Uncertainty in Measurement.
- Jordan K, Otto G, Ratay R., 1971. Calorimetric determination of the half-lives of 228Th and 224Ra. J. Inorg. Nucl. Chem 33, 1215–1219. [Google Scholar]
- Juzeniene A, Bernoulli J, Suominen M, Halleen J, Larsen RH, 2018. Antitumor activity of novel bone-seeking, α-emitting 224Ra-solution in a breast cancer skeletal metastases model. Anticancer Res. 38, 1947–1955. [DOI] [PubMed] [Google Scholar]
- Keightley J, Park T., 2007. Digital coincidence counting for radionuclide standardization. Metrologia 44, S32–S35. [Google Scholar]
- Keightley JD, Pearce AK, Fenwick AF, Collins SM, Ferreira KM, Johansson L., 2015. Standardisation of 223Ra by liquid scintillation counting techniques and comparison with secondary measurements. Appl. Radiat. Isot 95, 114–121. [DOI] [PubMed] [Google Scholar]
- Kossert K, Nähle O., 2019. Determination of the activity and half-life of 227Th. Appl. Radiat. Isot 145, 12–18. [DOI] [PubMed] [Google Scholar]
- Kurcewicz W, Kaffrell N, Trautmann N, Plochocki A, Zylicz J, Matul M, Stryczniewicz K., 1977. Collective states fed by weak α-transitions in the 232U chain. Nucl. Phys A289, 1–14. [Google Scholar]
- Lin W-J, Harbottle G., 1992. Gamma-ray emission intensities of the 232Th chain in secular equilibrium of 235U and the progeny of 238U. J. Radianal. Nucl. Chem 157, 367–372. [Google Scholar]
- Lloyd R, Mays C, Atherton D, Clark D., 1962. The half-period of Ra224 (Thorium X). COO- 225, 88–89. [Google Scholar]
- Lorusso G, Collins SM, Jagan K, Hitt GW, Sadek AM, Aitken-Smith PM, Bridi D, Keightley JD, 2017. Measuring radioactive half-lives via statistical sampling in practice. Europhys. Lett 120, 22001. [Google Scholar]
- Moore WS, 2000. Determining coastal mixing rates using radium isotopes. Continent. Shelf Res 20, 1993–2007. [Google Scholar]
- Napoli E, Cessna JT, Fitzgerald R, Pibida L, Collé R, Laureano-Pérez L, Zimmerman BE, Bergeron DE, 2020a. Primary standardization of 224Ra activity by liquid scintillation counting. Appl. Radiat. Isot 155, 108933. [DOI] [PMC free article] [PubMed] [Google Scholar]
- Napoli E, Cessna JT, Pibida L, Fitzgerald R, Hjellum G, Bergeron DE, 2020b. Radionuclide calibrator responses for 224Ra in solution and adsorbed on calcium carbonate microparticles. Appl. Radiat. Isot 164, 109265. [DOI] [PMC free article] [PubMed] [Google Scholar]
- Nichols A., 2011. 224Ra - Comments on Evaluation of Decay Data. Retrieved from. http://www.lnhb.fr/nuclides/Ra-224_com.pdf.
- NNDC database, 2019. Retrieved from. https://www.nndc.bnl.gov/ensdf/.
- NPL, 1984. Certificate of Measurement of Model 671 Ionization Chambers. Reference R509.
- Parker C, Nilsson S, Heinrich D, Helle SI, O’Sullivan JM, Fossa SD, Chodacki A, Wichno P, Logue J, Seke M, Widmark A, Johannessen DC, Hoskin P, Bottomley D, James ND, Solberg A, Syndikus I, Kliment J, Wedel S, Boehmer S, Dall’Oglio M, Franzen L, Coleman R, Vogelzang JJ, O’Bryan-Tear CG, Staudacher K, Garcia-Vargas J, Shan M, Bruland OS, Sartor O., 2013. Alpha emitter radium-223 and survival in metastatic prostate cancer. N. Engl. J. Med 369, 213–223. [DOI] [PubMed] [Google Scholar]
- Parker C, Lewington V, Shore N, Kratochwil C, Levy M, Lindén O, Noordzij W, Park J, Saad F., 2018. Targeted alpha therapy, an emerging class of cancer agents: a review. JAMA Oncol 4, 1765–1772. [DOI] [PubMed] [Google Scholar]
- Peghaire A., 1969. Mesures Précises d’Intensités Absolues de Rayonnements γ pour des Émetteurs α. Nucl. Instrum. Methods 75, 66–70. [Google Scholar]
- Piatrowska A, Leszczuk E, Bruchertseifer F, Morgenstern A, Bilewicz A., 2013. Functionalized NaA nanozeolites labeled with Ra-224, Ra-225 for targeted alpha therapy. J. Nanoparticle Res 15, 2082. [DOI] [PMC free article] [PubMed] [Google Scholar]
- Pibida L, Zimmerman B, Fitzgerald R, King L, Cessna JT, Bergeron DE, 2015. Determination of photon emission probabilities for the main gamma-rays of 223Ra in equilibrium with its progeny. Appl. Radiat. Isot 101, 15–19. [DOI] [PubMed] [Google Scholar]
- Pommé S., 2007. Problems with the uncertainty budget of half-life measurements. In: ACS Symposium Series, Vol. 945: Applied Modeling and Computations in Nuclear Science. American Chemical Society, pp. 282–292. [Google Scholar]
- Pommé S., 2015. The uncertainty of the half-life. Metrologia 52, S51–S65. [Google Scholar]
- Pommé S, Collins SM, Harms A, Jerome SM, 2016. Fundamental uncertainty equations for nuclear dating applied to the 140Ba-140La and 227Th-223Ra chromometers. Appl. Radiat. Isot 162–163, 358–370. [DOI] [PubMed] [Google Scholar]
- Reissig F, Hubner R, Steinbach J, Pietzsch HJ, Mamat C., 2019. Facile preparation of radium-doped, functionalized nanoparticles as carriers for targeted alpha therapy. Inorg. Chem. Front 6, 1341–1349. [Google Scholar]
- Rogers DWO, Kawrakow I, Seuntjensv JP, Walters BRB, Mainegra-Hing E., 2010. NRC User Codes for EGSnrc, NRC Report PIRS-702(RevB).
- Sadasivan S, Raghunath VM, 1982. Intensities of gamma rays in the 232Th decay chain. Nucl. Instrum. Methods 196, 561–563. [Google Scholar]
- Schötzig U, Debertin K., 1983. Photon emission probabilities per decay of 226Ra and 232Th in equilibrium with their daughter products. Int. J. Appl. Radiat. Isot 34, 533–538. [Google Scholar]
- Schrader H., 2004. Half-life measurements with ionization chambers: a study of systematic effects and results. Appl. Radiat. Isot 60, 317–323. [DOI] [PubMed] [Google Scholar]
- Schulte TL, Nekolla EA, Wick RR, 2009. Long-term investigation of the risk of malignant diseases following intravenous radium-224 treatment for ankylosing spondylitis. Strahlenther. Onkol 185, 549–556. [DOI] [PubMed] [Google Scholar]
- Singh S, Singh B., 2015. Nuclear data Sheets for A = 224*. Nucl. Data Sheets 130, 127–182. [Google Scholar]
- Smith D., 1975. An improved method of data collection for 4πβ-γ coincidence measurements. Metrologia 11, 73–77. [Google Scholar]
- Smith D., 1987. Some developments in the Cox-Isham theory of coincidence corrections, including the extension to the computer discrimination method. Appl. Radiat. Isot 38, 813–821. [Google Scholar]
- Smith D, Stuart LEH, 1975. An extension of the 4πβ-γ coincidence technique: two dimensional extrapolation. Metrologia 11, 67–72. [Google Scholar]
- Tiepolt C, Gruning T, Franke WG, 2002. Rennaissance of Ra-224 for the treatment of ankylosing spondylitis: clinical experiences. Nucl. Med. Commun 23, 61–66. [DOI] [PubMed] [Google Scholar]
- Townson R, Tessier F, Galea R., 2018. EGSnrc calculation of activity calibration factors for the Vinten Ionization Chamber. Appl. Radiat. Isot 134, 100–104. [DOI] [PubMed] [Google Scholar]
- Vaninbroukx R, Hansen HH, 1983. Determination of γ-ray emission probabilities in the decay of 228Th and its daughters. Int. J. Appl. Radiat. Isot 34, 1395–1397. [Google Scholar]
- Walz KF, Debertin K, Schrader H., 1983. Half-life measurements at the PTB. Int. J. Appl. Radiat. Isot 34, 1191–1199. [Google Scholar]
- Westrøm S, Malenge M, Jorstad IS, Napoli E, Bruland ØS, Bønsdorff TB, Larsen RH, 2018a. Ra-224 labeling of calcium carbonate microparticles for internal α-therapy: preparation, stability, and biodistribution in mice. J. Label. Compd. Radiopharm 61, 472–486. [DOI] [PMC free article] [PubMed] [Google Scholar]
- Westrøm S, Bønsdorff TB, Bruland ØS, Larsen RH, 2018b. Therapeutic effect of α-emitting 224Ra-labeled calcium carbonate microparticles in mice with intraperitoneal ovarian cancer. Trans. Oncol 11, 259–267. [DOI] [PMC free article] [PubMed] [Google Scholar]
- Woods M, Callow W, Christmas P., 1983. The NPL radionuclide calibrator–type 271. Int. J. Nucl. Med. Biol 10, 127–132. [DOI] [PubMed] [Google Scholar]
- Zimmerman BE, Bergeron DE, Cessna JT, Fitzgerald R, Pibida L., 2015. Revision of the NIST standard for 223Ra: new measurements and review of 2008 data. J. Res. Natl. Inst. Stand. Technol 120, 37–57. [DOI] [PMC free article] [PubMed] [Google Scholar]