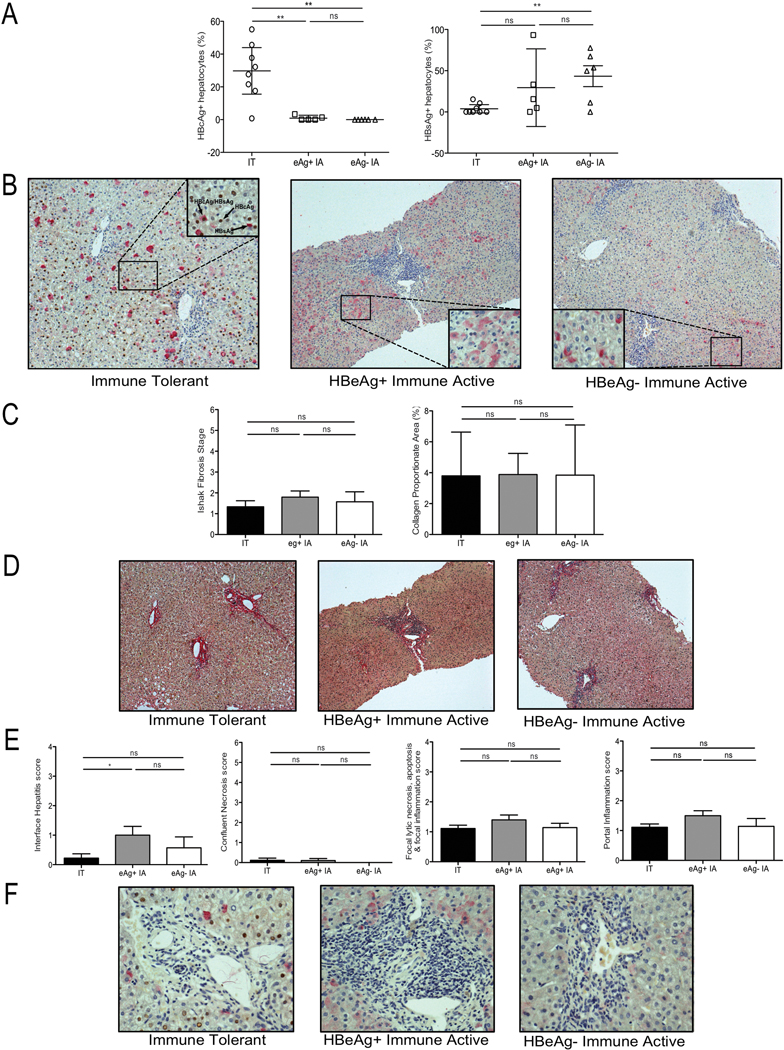
Figure 3: Differential nuclear core antigen staining but similar fibrosis and inflammatory indices between CHB phases.
Formalin-fixed and paraffin-embedded tissue was analyzed with immunohistochemistry for HBcAg and HBsAg positive hepatocytes, along with quantification of fibrosis and histological activity indices for each patient. (A) Percentage of HBcAg positive hepatocytes (left panel) and HBsAg positive hepatocytes (right panel) in each group; IT (open circles), HBeAg(+) IA (open squares) and HBeAg(−) IA (open triangles). Each point represents 1 patient, data shown as mean with SEM, as error bars. (B) Immunostaining identifying HBcAg positive hepatocytes (brown) and HBsAg positive hepatocytes (pink) from representative patients from each patient group (Table 1) (100x); IT (left panel), HBeAg(+) IA (middle panel) and HBeAg(−) IA (right panel). Inset shows magnified image (400x). (C) Ishak Fibrosis stage (left panel) and collagen proportionate area (right panel) of patients studied in each phase of CHB, data shown as mean with SEM, as error bars. (D) Sirius red staining of liver tissue from representative patients in each phase; IT (left panel), HBeAg(+) IA (middle panel) and HBeAg(−) IA (right panel). (E) Histological activity index scores; (from left to right – Interface hepatitis, Confluent necrosis score, Focal lytic necrosis, apoptosis & focal inflammation score and Portal inflammation score) of patients studied in each phase of CHB, data shown as mean with SEM, as error bars, (F) Identification of the inflammatory infiltrate as shown in (E) from representative patients in each phase of CHB; IT (left panel), HBeAg(+) IA (middle panel) and HBeAg(−) IA (right panel). Significant changes marked with asterisks, *P<.05; **P<.01; ***P<.001; ns=not significant

