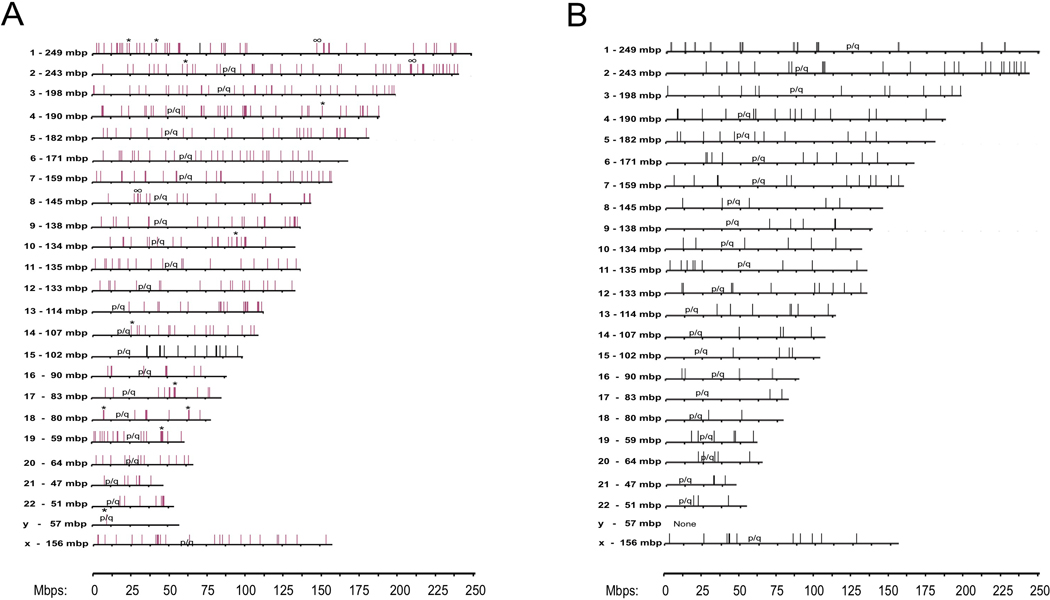
Figure 4: Sites of HBV DNA integration on human chromosomes.
A) Integration sites are summarized from all three patient groups (Table 1) by vertical lines. Results include the 208 from IT disease patients (Group 1), 195 from HBeAg(+) IA disease (Group 2), and 97 from HBeAg(−) IA disease (Group 3). Groups 1 (IT) and 2 [HBeAg(+)]; integrations were found on all chromosomes except Y. The single Y chromosome integration was from a patient from group 3. No group 3 patient integration sites were mapped to chromosomes 15 and 16. B) Integration sites in Group 1 patients - IT phase. Integration site details are shown in Supplementary Table 3. Clone sizes: *>5,000 and #>20,000.

