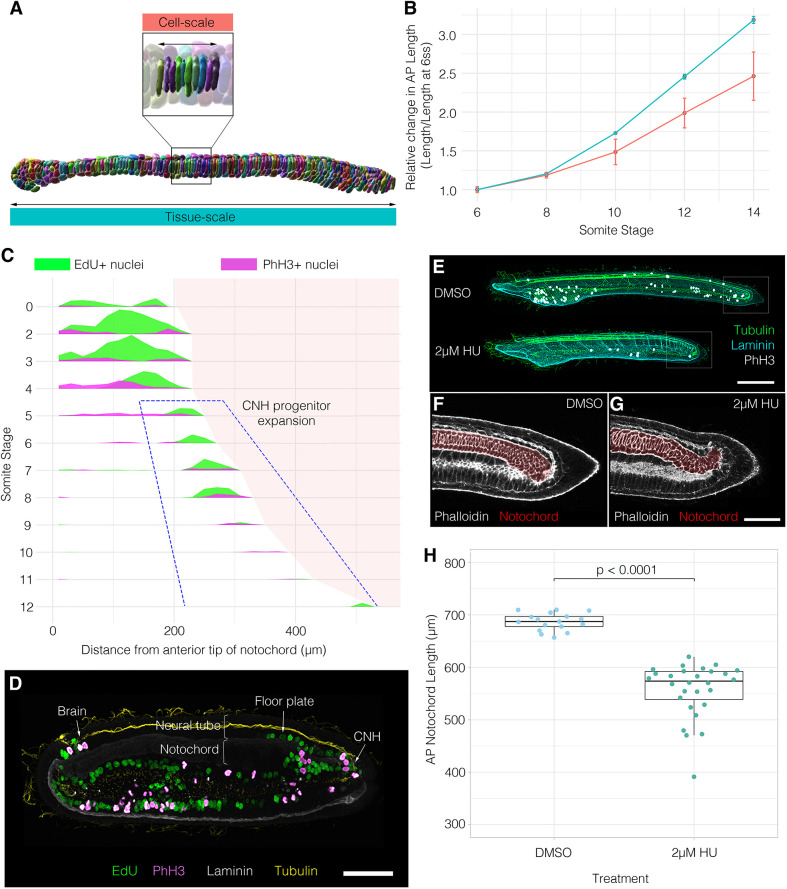
Fig. 6.
Posterior addition is required for full extension of the notochord. (A) 10 ss segmented notochord illustrating cell-scale (top) and tissue-scale (bottom) measurements of AP length. (B) Graph showing relative change in AP length at the cell scale (neighbourhoods of 10 adjacent cells, n=15 measurements/stage) and the tissue-scale (whole notochords, n=5 per stage) ±1 s.e.m. (C) Proliferation landscape for the notochord, showing mean frequency of EdU and PhH3 staining in embryos at successive somite stages, with length scaled to mean per stage (n=102 embryos). (D) Raw staining for EdU and PhH3 at 8 ss in a sagittal section, with tissue landmarks annotated. Anterior is leftwards; posterior is rightwards. (E) Effect of 2 µM HU between 6 ss and 14 ss on axial length. (F,G) Phalloidin staining in a sagittal section through tails of DMSO and HU-treated specimens. Notochord false-coloured in red. (H) Quantification of notochord length in DMSO and HU-treated specimens (n=17 DMSO, 27 HU). P value is result of unpaired two-tailed Student's t-test. Boxes show the median, 25th and 75th percentiles. Whiskers show maximum and minimum values within 1.5 times the interquartile range.

