

Abstract
The binding of Phosphatidylinositol 4,5-Bisphosphate (PIP2) to the ion channel Transient Receptor Potential Vanilloid (TRPV5) is critical for its function. We use atomically detailed simulations and the Milestoning theory to compute the free energy profile and the kinetics of PIP2 binding to TRPV5. We estimate the rate of binding and the impact of the protonation state on the process. Several channel residues are identified as influential in the association event and will be interesting targets for mutation analysis. Our simulations reveal that PIP2 binds to TRPV5 in an unprotonated state and is protonated in the membrane. The switch between the protonation state of PIP2 is modeled as a diabatic transition and occurs about half way through the reaction.
Graphical Abstract

I. Introduction
Biological membranes (BM) form the barriers that separate the interior and the exterior of cells as well as the boundaries of intracellular compartments. If the role of BMs was limited to acting as a barrier, then the membranes could have been simple, and consist (for example) of only one or a few types of components. This is, however, not the case. BM are highly complex and are comprised of diverse phospholipids, sterols and proteins. In regards to phospholipids alone, at least one hundred different types of phospholipids can be found in a single biological membrane.1 Moreover, the composition of the inner and outer layers of the BM surrounding cells are not symmetrical.
It is therefore no surprise that BM have multiple functions. They dynamically maintain and help form the shape of cells.2–7 They are fluid and respond to external stimuli by adjusting local material composition. They also host a variety of signaling and transport machinery that are essential for cellular function. Among these machines are the ion channel proteins, which are responsible for transmitting messages across the cell boundaries by gating the passage of specific ions.8, 9 An intriguing question is to ask, “what is the mechanism that allows the ion channel to change conformation in response to a stimulus?” It is reasonable to assume that concentration gradients of material or gradient of electric potential generate a driving force for the ionic current. However, how is the initial signal propagated into molecular level activation (and deactivation) of a channel is still under intense investigations. In the present manuscript we interrogate the initial stages of ion channel activation by simulating the association of the membrane signaling molecule phosphatidylinositol 4,5-bisphosphate (PIP2) to the Transient Receptor Potential Vanilloid 5 (TRPV5).
Transient Receptor Potential Vanilloid (TRPV) channels represent a class of pore-forming membrane proteins that regulate the conductance of cations across the plasma membrane10. There are 6 recognized sub-types in the mammalian TRPV class that range in selectivity for divalent over monovalent cations (eg. TRPV1, PCa/PNa ~ 10; TRPV5 PCa/PNa ~ 100) and which are regulated by a variety of stimuli, ranging from temperature and protons to specific agonists.11, 12 The range in selectivities for calcium over sodium is, in part, reflective of the different roles TRPV channels have in physiology. Although TRPV1, TRPV2 and, possibly, TRPV3 share common roles as nociceptive receptors in the peripheral nervous system, TRPV4 is critical to bone development and TRPV5 and TRPV6 play an important role in calcium reabsorption within epithelial tissues such as the kidney.13
Members of the TRPV family have been implicated as important components in pathological states, and extensive efforts to characterize their physiological roles have spanned two decades. Structural studies have played an important role in these efforts, and the success of Cryo-EM methods in obtaining high-resolution structures of TRPV channels in the past decade has been remarkable.14–16 The four-fold symmetric pore domains (PDs) and voltage sensor like domains (VSLDs) along with the flower petal arrangement of N-terminal ankyrin repeat domains (ARDs) have become a structural hallmark of TRPV channels, and higher resolution studies have also provided detailed positions of lipids and agonists17. Definitive locations of agonist and lipid binding sites are a crucial element in understanding the energetics of TRPV channel gating and have the potential to resolve long-standing controversies over lipid regulation in these channels.
The role of phosphoinositides in regulating TRPV channels is arguably the most disputed area in TRPV channel regulation. Although there is a consensus that PIP2 plays an important role in regulating the activities of numerous TRPV channels, its role as a positive or negative effector differs from channel to channel. Most notably in TRPV1, activity of the channel was originally thought to be inhibited by PIP2 and disinhibition followed from degradation of PIP2 through PLC dependent signaling pathways.18 Direct application of PIP2 onto excised membrane patches allowed researchers to isolate the interactions that concern TRPV1 activation, and it was observed that PIP2 increased the open probability of TRPV1.19 Direct application measurements in excised patch electrophysiology experiments followed for the remaining TRPV members. Both TRPV5 and TRPV6 channels are constitutively open under physiological conditions, and functional experiments have shown that PIP2 in the plasma membrane is essential for their activity.15 Since these functional studies were done, more recent structural studies of TRPV5 in lipid nanodiscs have confirmed the association between PIP2 and channel by capturing their physical interaction16.
In the present manuscript we compute the kinetics and the free energy profile for the association of PIP2 to TRPV5 using an atomically detailed description and the method of Milestoning.20 We establish the time scale for the process, which is a useful parameter for further investigations, and illustrate the impact of the protonation state of PIP2 on its association constant and rate. We suggest a proton switching mechanism as PIP2 is translocated from the membrane solution in a protonated state into the bound form unprotonated state.
II. Methods
II.1. System preparation
The initial structure for the computational study was 6DMU of the protein data bank.16 The structure includes the complex of the TRPV5 and dic8-PIP2 lipids. This complex, with the four PIP2 molecules, was embedded in a box of solvated pure POPC membrane. The dimension of the box is approximately 140×140×150 A. To avoid steric clashes the POPC molecules within 1.5 A from the channel are removed. The vertical position of the complex is determined such that the transmembrane helices (TM) have their hydrophobic residues inside the membrane. All the simulations were conducted using the package NAMD21 and CHARMM3622 force field. The water molecules were kept rigid using the SETTLE algorithm23 and all other bonds with hydrogens were kept fixed with the SHAKE algorithm.24 The time step is one femtosecond in all the simulations. Long range electrostatic was computed with the Ewald sum25 using grid spacing of 1A. The cutoff distance for Lennard Jones calculations was 12. The system is solvated with TIP3P water molecules26 and 150mM KCl. The total number of atoms is 262K atoms and an image of the system (with the water and ions removed for clarity) is shown in Fig. 1.
Fig 1.

A schematic representation of the simulation box. The inset shows a PIP2 molecule in the binding pocket with the phosphates of the head group labeled P4 and P5. The tail is colored green.
We equilibrated the system as follows. First, the system was minimized for 10,000 steps using a conjugate gradient algorithm. Second, the atoms were restrained to their initial positions, using a force constant of 1 kcal/mol.A2, except the POPC lipid tails that were allowed to relax after the insertion of the protein for 100 picoseconds (ps). Third, the channel and the PIP2 molecules were restrained while the rest of the atoms (membrane and aqueous solution) could move freely. The system was equilibrated for 10ns in the NPT ensemble at temperature of 298K and pressure of 1atm using Nose-Hoover Langevin piston pressure control.27, 28 The average surface area per lipid that we obtain was 68.6A2. Fourth, we released the restraints from the sidechains of the protein and continued the simulation for 10ns. In the fifth step, we released the PIP2 tails and run 10ns equilibration trajectory at 298K and the NVT ensemble using a Langevin thermostat. Finally, we removed all the constraints and equilibrated the system for 20ns using the previous ensemble. We note that the Milestoning trajectories are conducted in the NVE ensemble to obtain microscopic times derived from the Hamilton’s equations of motion.
II.2. Milestoning
Milestoning is a theory and an algorithm to simulate the kinetics of molecular systems using trajectories. Review articles are available.20, 29 Therefore, we provide below only a brief summary. In Milestoning we divide the phase space into cells and conduct short trajectories between the boundaries of the cells. The statistics of transition events between the cell boundaries are combined using the Milestoning theory to obtain the overall rate and thermodynamics of the system.
Computationally, Milestoning consists of four steps. In the first step we provide anchors. Anchors are configurations sampled in coarse space that chart the transition between the reactant and product. Each of the configurations is a center of a Voronoi cell. The coarse space can be a single reaction coordinate, as in the present case. Here, we are interested in the kinetics of PIP2 binding and unbinding to TRPV5. The distance between the center of mass of the carbon ring located at the head group of PIP2 and its original position in the pocket is the single coarse variable, or the reaction coordinate (RC). To generate anchors and initial atomically detailed structures at the milestones, we use Steered Molecular Dynamics (SMD) and pull one of the PIP2 molecules from the pocket. The other three PIP2 molecules remain bound through the entire process. The center of mass of the carbon ring at the PIP2 head was pulled at a constant speed of 2.5 × 10⁻⁶ Angstroms per step. During the pulling the backbone of the residues 330 to 340 from TM1 were restrained by a force constant of 1 kcal/mol.A to the last equilibrated structure to minimize channel distortion and to provide a fixed reference state. The RMSD between the initial and final channel configurations of the SMD was 2.5A for all heavy atoms in the channel. Of the configurations generated during the SMD trajectory, we selected atomically detailed structures separated sequentially by RMSD of 0.5 A to serve as anchors and centers of Voronoi cells.
The boundaries between two Voronoi cells are called milestones. Let a position along the reaction coordinate in coarse space be Qi. A distance in the coarse space is dij = |Qi − Qj|. A configuration, Q, is in Voronoi cell i if the distance di = |Q − Qi| is smaller than all distances dj to the other centers of j Voronoi cells. A configuration, Q, is at a milestone ij if di = dj and di > dk for all other k anchors. For simplicity, we denote milestone ij by a single Greek letter (say α).
In the second step we sample configurations in the milestones. The calculations are conducted in the NVT ensemble using MD simulations. The trajectories are restrained to the milestones using the COLVAR30 program that imposes harmonic potential to keep the sampling trajectories at each milestone with a force constant of 500 kcal/mol.A. The equilibration at the milestones is conducted for 3 ns. Two hundred uniform samples are taken from the final 1ns at each milestone for the third step.
In the third step of Milestoning we run unbiased trajectories in the NVE ensemble, initiated from the configurations sampled in the second step (Fig. 2). The trajectories continue until they cross for the first time a milestone different from the initiating milestone. Since the milestones are close to each other (0.5 A distance), the trajectories are short and are of order of a few picoseconds. The time length of the trajectory and the identity of the milestone that was crossed are recorded for further analysis.
Fig 2.

A schematic representation of a Milestoning calculation o PIP2 migration to the bind site. The perpendicular direction represents other degrees of freedom orthonormal to the reaction coordinate. The reaction coordinate is the distance from the head group of PIP2 (red circles and two blue tails) to its bound position in the pocket. On top we show a sketch of the entire reaction coordinate and in the lower panel we illustrate only three milestones. In the magnified picture of three milestones, two trajectories are initiated from milestone i. The blue trajectory hits milestone i+1 and the green trajectory hits milestone i-1 for the first time before any other milestone. We also show the images of PIP2 as it migrates from milestone i to milestone i+/−1. Milestones are boundaries that are used to partition the entire phase space into cells. The sizes of the cells are not necessarily small. In the present simulation the bound and unbound cells are large compared to other cells.
In the fourth and the final step we use the information gathered in the previous steps to compute the transition matrix Kαβ. It is the probability that a trajectory initiated in milestone α will cross for the first time milestone β. We also compute, tα, the lifetime of milestone α:
| (1) |
and
| (2) |
where nα is the number of trajectories initiated at milestone α (200 in the current study), nαβ is the number of trajectories that were initiated at milestone α and were terminated at milestone β, l is the index of the trajectory, and the time length of trajectory l is tl.
Using the Milestoning theory31 we can compute thermodynamic and kinetic observables. The stationary fluxes of trajectories through a milestone is the eigenvector, q, of the matrix K with an eigenvalue of one: qtK = qt where we used bold face for vectors and matrices. The free energy of a milestone α is given by Fα = −kBTlog[qαtα] and the mean first passage time (MFPT, 〈τ〉) is given by 〈τ〉 = p0(I − K)−1t, p0 is the vector of the initial distribution and I is the identity matrix.
II.3. Protonation States
In physiological conditions PIP2 exists in multiple protonation states.32 We consider three states: (i) PIP2 is unprotonated, (ii) PIP2 is protonated at position P4, and (iii) PIP2 is protonated at position P5 (Fig. 3). To understand the effect of protonation on the binding kinetics of PIP2 to TRPV5 we use Milestoning to compute the binding kinetics at fixed protonation states of PIP2. The free energy profiles and the MFPT for fixed protonation states are, however, only parts of the story. The time scale for proton addition and subtraction may compete with the time scale of the PIP2 dissociation process, and make them coupled. One approach to model proton exchange is the constant pH simulations.33–36 However, while the correct equilibrium is obtained in constant pH simulations, the time scale is not necessarily physical since the equation of motions are not derived from a Hamiltonian. The present study focuses on kinetics and we therefore prefer to use the Hamilton equations of motion.
Fig 3.

A schematic representation of the two possible protonation states of dic8-PIP2, P4 and P5, on the PIP2 headgroup.
To allow the exchange of protons we use a diabatic approximation. For each protonation state we obtain the entire free energy profile for PIP2 association or dissociation as discussed in section II.1. Then we analyze the possibility of exchanges between the curves. If two dissociation curves cross, proton exchange is allowed and the system remains at the lowest of the two crossing free energy curves. This approximation is similar to the Born Oppenheimer approach when computing nuclear energy landscapes for fixed electronic states.37 We allow crossing between the curves at nuclear positions in which the energies of the electronic states are the same. From a kinetic perspective the models assume that proton exchanges and equilibration are much faster than PIP2 motions. For each displacement of the PIP2 molecule the rapid protons are at minimum free energy configuration.
II.4. Relative energy positioning of reaction pathways with fixed protonation states
The free energy along the reaction coordinate, which are generated by Milestoning, are not absolute. They are computed with respect to a reference. This is similar to methods like umbrella sampling38 or the free energy perturbation method.39 To obtain free energy differences between pathways of alternate protonation states we use the free energy perturbation (FEP). We consider the following thermodynamic cycle (Fig. 4) that includes a TRPV5 and two PIP2 molecules, one in protonated and the second in a deprotonated state. The ensemble is constructed such the total number of particles (including the protons) is fixed which allows the use of the canonical ensemble.
Fig 4.
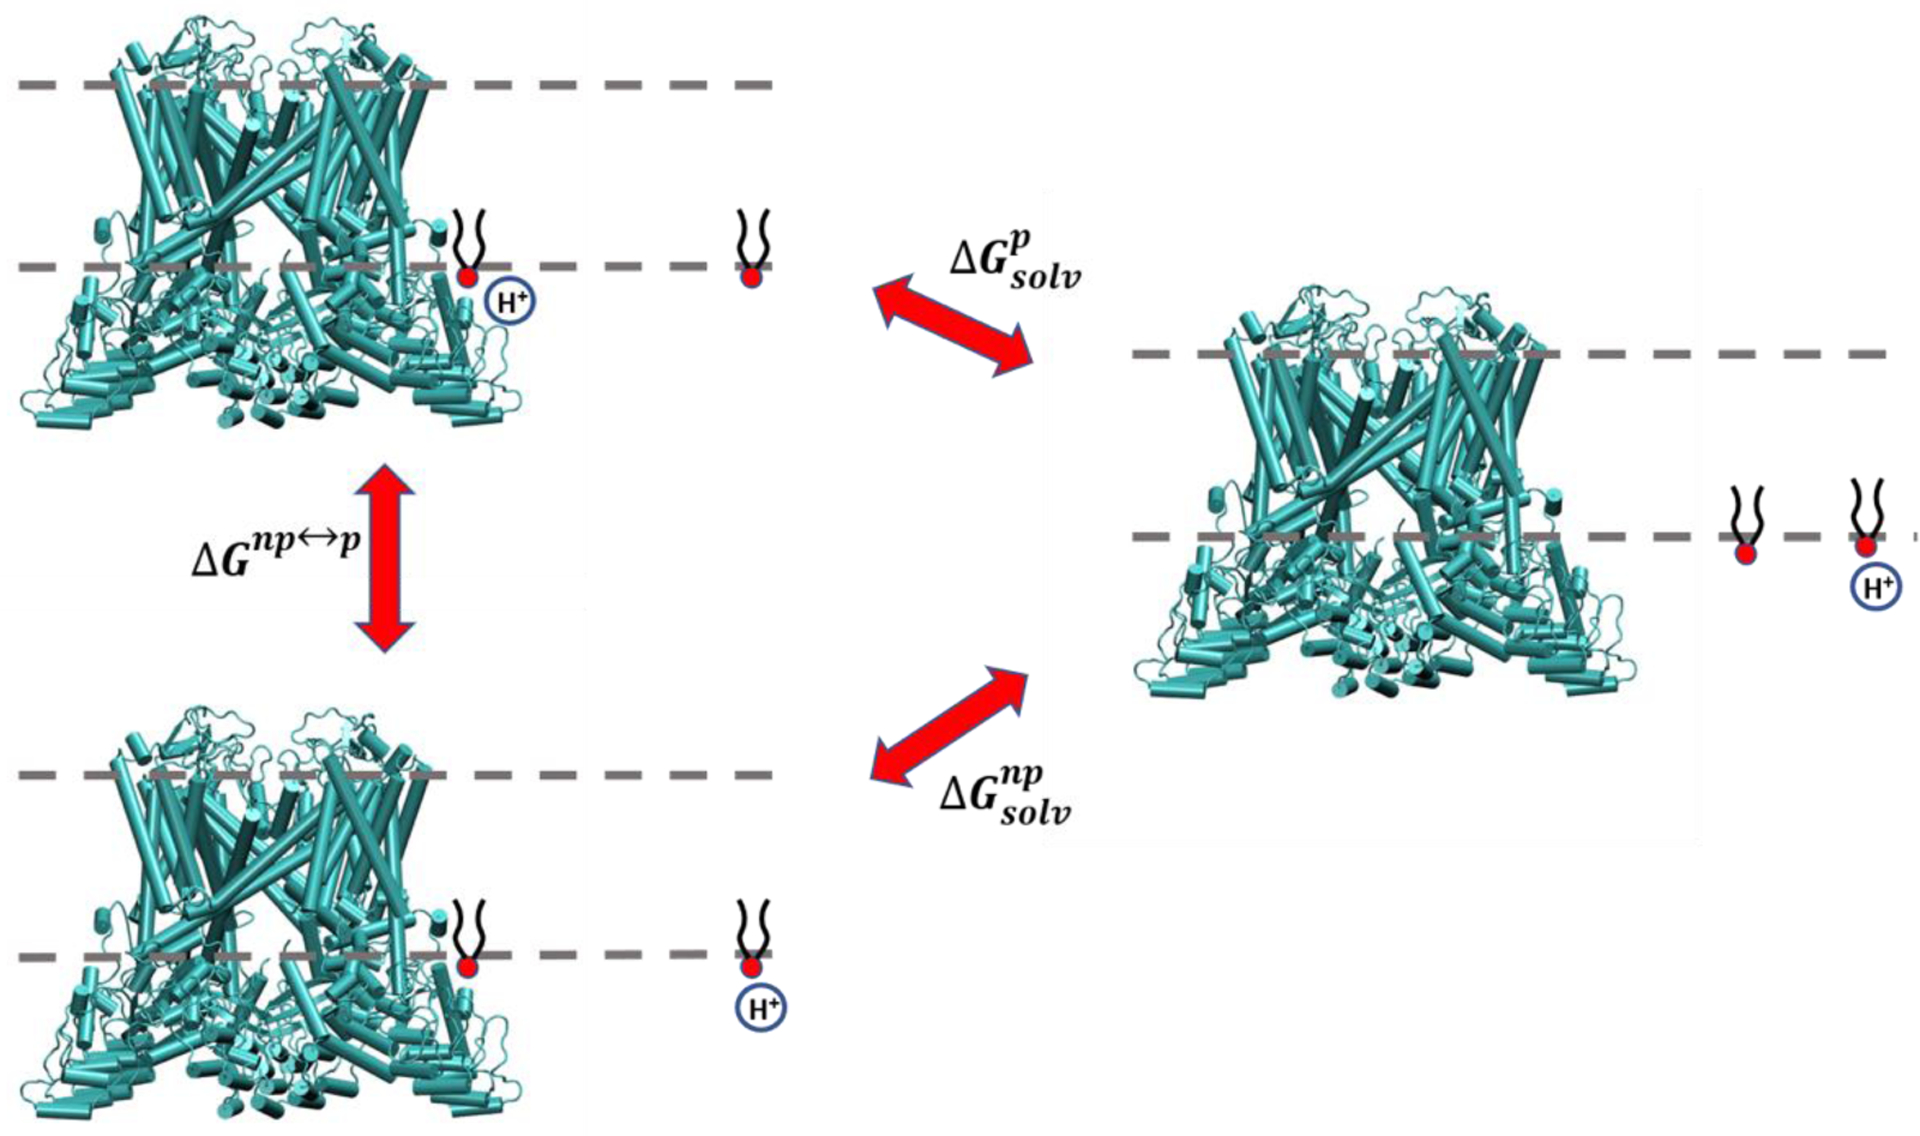
A thermodynamic cycle to study the free energy profiles of binding PIP2 to TRPV5 and the impact of protonation on the binding. The channel is shown in green, the POPC membrane is represented by black dashed lines and the PIP2 molecule is in black and red. See main text for more information.
In Figure 4, is the free energy difference between TRPV5-bound and membrane-solvated states of protonated PIP2. is the free energy difference between TRPV5-bound and membrane solvated states of unprotonated PIP2. Finally, ΔGnp↔p, is the free energy difference between protonated and unprotonated PIP2 bound to TRPV5.
The third term can be computed by free energy perturbation (FEP) by modifying the charges of the PIP2 molecule inside the binding pocket and the other PIP2 in the bulk membrane simultaneously. According to the above cycle one can write:
| (3) |
As discussed in section II.3 the PIP2 molecule has 2 possible protonation states at the phosphate groups located on P4 and P5 positions (Fig. 4). We considered both possibilities and performed two FEP simulations for each of the protonation states.
To conduct the FEP simulations, we add an additional PIP2 molecule to the bulk membrane (Fig. 4) and equilibrate the system in NPT ensemble for 10ns followed by a 10ns of NVT simulation. The FEP calculations were divided into two steps. In the first phase, a neutral hydrogen atom was created using a thermodynamic step dλ = 0.1 and sampling for 100ps at each λ value. In the second step, the charges of the atoms were redistributed to make them identical to their corresponding values at a protonated state. In the second phase, a thermodynamic step of dλ = 0.05 was used. The sampling was for 500ps at each λ.
III. Results and Discussion
III.1. PIP2 Equilibrated Configurations
Three separate simulations have been performed. One for each of the protonation states of PIP2 and one for the unprotonated state. Comparing an equilibrated conformation of PIP2 in the pocket to the TRPV5/diC8-PIP2 structure is a qualitative measure of correctness. We expect that the equilibrated PIP2 structure with the preferred protonation state will resemble the Cryo-EM structure. Fig. 5 shows snapshots from the three simulations of equilibrated PIP2. Also shown in Fig. 5 is the PIP2 conformation from the Cryo-EM structure16 in which P4 or P5 positions are coordinated to the positively charged sidechains of the Arg584 and Arg305. In our simulations this coordination was only found for the deprotonated state. This observation suggests that the deprotonated state is more similar to the Cryo-EM structure and is the preferred configuration of PIP2 inside the binding pocket. Further confirmation of this qualitative suggestion is provided by the free energy calculations discussed below.
Fig. 5:

A schematic representation of the PIP2 molecule in the binding pocket. Panels A-D correspond to the PDB structure, the deprotonated state, P5 protonated state, and P4 protonated state, respectively. The tail of the PIP2 is shown in green. The approximate distances to the positively charged sidechains of a few coordinating residues are shown in red. P4 and P5 (blue), indicate the index of the phosphates in the head group of PIP2. In panel B, the PIP2 phosphate groups are closely interacting with the Arg584 and Arg305. However, in panel C, the protonation of the P5 increases the distance between this phosphate group and Arg305. In panel D on the other hand, the protonation at P4 resulted in a rotation at the head of PIP2 and the P5 phosphate interacts with Arg584 and P4 is far from Arg305. Panels A and B re most similar which support having a deprotonated PIP2 molecule inside the binding pocket. Further support to this conjecture is provided by the free energy calculations (Fig. 6)
III.2. Thermodynamics and Kinetics of PIP2 Binding
Fig. 6 shows the potential of mean force (PMF) for the translocation of a PIP2 molecule from its binding site at TRPV5 to the bulk of the membrane. The calculation starts at the pocket and continues to milestone 28 where it is separated by 14A from the pocket and is immersed in the membrane solution.
Fig 6.

The potential of mean force (PMF) for the unbinding of a PIP2 molecule at different protonation states. The x-axis is the distance of the center of mass of the carbon ring at the headgroup of PIP2 from its original position in the pocket. The left panel shows the PMF for PIP2 in the deprotonated state (blue) compared with the PMF of PIP2 with a proton on the P5 phosphate (red). The arrows show the overall pathway from bound to unbound state. The green arrow is the switch position. The right panel shows the comparison of the free energy profiles for the deprotonated state and the profile with the extra proton on the P4 phosphate (yellow). The errors are shown as bars on the different curves. The calculations of error bars in Milestoning are explained in the Supplementary Information.
Experiments suggest that in the bulk membrane PIP2 is protonated at physiological conditions.32 However, the different electrostatic environment at the binding site impacts the tendency of PIP2 to capture a proton in the binding site. In particular, the positively charged groups at the binding site (Fig. 4) will make it less likely for PIP2 to acquire a proton while bound. Fig. 6 demonstrates that the preferred initial state of PIP2 while bound to TRPV5 is unprotonated. The free energy differences, ΔGnp↔p, computed by FEP for P5 and P4 phosphates are 9.9±0.4 kcal/mol and 6.5±0.3 kcal/mol, respectively. Following the lowest diabatic curve, the unbinding process starts from the deprotonated state (blue curve in each panel). As we continue the unbinding process, the curves for P5-protonated and the deprotonated states intersect near milestone 10 or 5A from the pocket. The P5-protonated curve has a local minimum at around 5A. Onward, the lowest free energy curve is of the P5 protonation state until PIP2 reaches the bulk membrane. The free energy of the P4 protonated state as a function of the distance from the binding site is always higher than at least one of the alternative free energies: (i) the deprotonated or (ii) the P5 protonated state (Fig. 6, lower panel). Fig. 7 shows the P5-protonated PIP2 at three different milestones illustrating switching interactions between different positively charged groups. Initially, the P4 phosphate group (which carries a full negative charge) is interacting with Arg584. The P5 phosphate is bonded to two positive amino acids, Arg302 and Arg305. Moving toward milestone 10, the headgroup makes a rotation. The P4 phosphate moves toward Arg302 to better coordinate with Arg584 and Arg302 while P5 phosphate interacts with Lys300. Eventually, the P5 phosphate makes another rotation toward Arg492 to facilitate the unbinding process, while P4 keeps its interaction with Arg584 and Arg302.
Fig 7.

A schematic representation of PIP2 at two different distances. In Panel A, at milestone 11, the PIP2 head group is interacting with multiple positively charged residues including Arg589 from the neighboring chain. In panel B, at milestone 14, just 1.5 angstroms away from configuration shown in panel A and after the switching point between the two free energy curves, most of the positively charged residues no longer contribute to significant electrostatic interactions with PIP2 (except for Lys300 which maintains its interaction for a longer period) and accordingly a protonated PIP2 becomes more stable.
According to the left panel of Fig. 6, the kinetics is a three-step process. First, the deprotonated PIP2 moves from the binding pocket up to milestone 10 (5A from the pocket). The Milestoning MFPT for this segment is ~29 microseconds. Second, PIP2 is likely to receive a proton since curves of the fixed protonation states cross (P5 protonated and unprotonated PIP2). The degeneracy of the free energy at milestone 10 suggests that crossing is possible and that it occurs without an energy barrier. Third, the PIP2 in the P5 protonated state continues from milestone 10 to the bulk membrane. The Milestoning MFPT of the third step is ~80 milliseconds. It is far slower than the other two events and therefore the overall timescale of the process is ~80 milliseconds.
In Table 1 the numbers of water molecules within 6 angstroms of P4 and P5 phosphates are listed for each of the simulations at the reactant, product and the crossing point. Even inside the binding pocket one finds about 30 water molecules surrounding the PIP2 headgroups for each of the protonation states. These water molecules may provide a source of protons for the exchanges that we consider.
Table 1.
The number of water molecules surrounding the PIP2 head group within 6 Angstroms from the phosphates for bound and unbound states as well as the crossing point and three different protonation states. Note that the P4 protonation state is not playing a role at crossing point. Therefore, the number of water molecules is not shown for this state.
| Not protonated | P4 protonated | P5 protonated | |
|---|---|---|---|
| Bound | 36.0±1.8 | 32.2±0.9 | 33.8±1.1 |
| unbound | 37.1±2.8 | 31.1±1.3 | 35.7±1.6 |
| Crossing point | 37.3±0.7 | - | 31.9±2.0 |
Figure 7 illustrates a significant number of charged residues in the neighborhood of PIP2. We checked if the usual protonation states of these residues are likely to change. We compute the pKa values for selected conformations along the reaction pathway using the software PROPKA.40 Most of the predictions have pKa above 10. The lowest pKA is of Lys 484 (8.7). Therefore, our use of fixed protonation states for these residues is sound.
Another view of the reaction pathway is shown in Fig. 8 that monitor the protein residues that interact with PIP2 along the minimum free energy pathway (including the switch in the protonation state at milestone 10). Two of the residues, Lys300 and Arg 302, interact with and follow PIP2 a significant fraction of the reaction coordinate. Their interactions persist beyond the switching point of the protonation state near 5 A. In contrast, the interactions with Arg 305 terminate quickly once PIP2 is moving out from the binding site. Four other residues, Lys 484, Arg 492, Arg 584, and Arg 589 lose their interactions with the PIP2 molecule at 5–6 angstroms from the binding; it is the same distance in which the protonation state is likely to change. Interestingly, Arg 589 has significant interactions with PIP2 only late along the reaction coordinate and for a short distance, just before the flip of the protonation states.
Figure 8.

The probability of interactions of PIP2 with selected residues of the TRPV5 channel along the reaction coordinate. An interaction is considered when any atoms of the residue side chain are within 6 A from any of the phosphate groups of PIP2. The probability is estimated from the entire ensemble of Milestoning trajectories.
IV. Conclusions
A critical step in activation of ion channels is their binding to signal molecules. Lipid interactions with membrane proteins was recently reviewed.41 The interactions of PIP2 with another channel were also investigated computationally.42 Here we study the binding of a rare phospholipid molecule (PIP2) to the TRPV5 channel using the atomically detailed simulation method of Milestoning. The binding impacts the channel activity which motivates the current research. We construct the free energy profile for PIP2 dissociation from TRPV5 to the membrane solution, along a simple one-dimensional reaction coordinate, which we define as the distance of the headgroup of PIP2 from its original bound position at the equilibrated structure. In addition to free energy, Milestoning also makes it possible to estimate the overall rate or the Mean First Passage time (MFPT). The barrier of about 20 Kcal/mole is substantial and the corresponding MFPT is of milliseconds.
We explore the impact of PIP2 protonation on the binding kinetics and thermodynamics of the dissociation process by calculating dissociation curves with fixed protonation states. The most likely path is the lowest diabatic free energy curve. A change in protonation of PIP2 occurs when the fixed protonation curves cross and PIP2 remains along the most-likely lowest free energy path (Fig. 6). The curve-crossing model predicts that at the binding site the PIP2 molecule is in the deprotonated state and that it switches to the P5 protonated state ~5A away from the binding site. As a function of the reaction coordinate the state in which P4 is protonated is always the highest free energy configuration. Hence, this state is unlikely to play a significant role in the binding and unbinding of PIP2 to TRPV5. In the membrane solution the P5 protonation state is more stable than the deprotonated state. Therefore, during the binding of PIP2 to TRPV5 a proton removal is expected.
Following our study of the impact of protonation on the binding, new questions emerge. Of interest is the effect of the pH of the aqueous solution and the membrane on the stability and kinetics of PIP2 binding. We speculate that manipulating pH at one side of the membrane can be a factor in channel activation and gating following alternate proton switching pathways. Functional studies of the TRP channels TRPV5, TRPV1 and TRPA1 have shown a sensitivity to proton concentrations on the inner membrane. In all cases channel activity is increased by raising the pH, which would be consistent with our findings and an opening mechanism that is dependent on bound PIP2.43,44,45
Another subject of future research are several critical residues along the dissociation pathway that we identify as interesting candidates for mutagenesis experiments. These residues alter the electric field near PIP2 (they are invariably positively charged) and hence influence its protonation capacity.
Supplementary Material
Table 2-.
Estimated pKa values for charged residues along the binding pathway using the PROPKA software
| Residue | pKa (with PIP2) | pKa (PIP2 removed) |
|---|---|---|
| Lys300 | 10.1 | 10.2 |
| Arg302 | 11.7 | 12.1 |
| Arg305 | 12.5 | 12.7 |
| Lys484 | 8.7 | 9.6 |
| Arg492 | 11.7 | 12.1 |
| Arg584 | 11.9 | 12.3 |
| Arg589 | 12.1 | 12.2 |
6. Acknowledgements
This research was supported by an NIH grant GM 59796, and Welch grant F-1896 to RE. We thank Alfredo Cardenas for his help in the analysis.
Footnotes
Supplementary information includes a root mean square distance plot of the equilibrium simulation and an explanation of the statistical errors in Milestoning.
References
- 1.Harayama T; Riezman H, Understanding the Diversity of Membrane Lipid Composition. Nat Rev Mol Cell Biol 2018, 19, 281–296. [DOI] [PubMed] [Google Scholar]
- 2.Ackerman DG; Feigenson GW, Multiscale Modeling of Four-Component Lipid Mixtures: Domain Composition, Size, Alignment, and Properties of the Phase Interface. J. Phys. Chem. B 2015, 119, 4240–4250. [DOI] [PMC free article] [PubMed] [Google Scholar]
- 3.Kusumi A; Koyama-Honda I; Suzuki K, Molecular Dynamics and Interactions for Creation of Stimulation-Induced Stabilized Rafts From Small Unstable Steady-State Rafts. Traffic 2004, 5, 213–230. [DOI] [PubMed] [Google Scholar]
- 4.Edidin M, Lipid microdomains in cell surface membranes. Curr Opin Struct Biol 1997, 7, 528–532. [DOI] [PubMed] [Google Scholar]
- 5.Jacobson K; Sheets ED; Simson R, Revisiting the Fluid Mosaic Model of Membranes. Science 1995, 268, 1441–1442. [DOI] [PubMed] [Google Scholar]
- 6.Tocanne JF; Dupoucezanne L; Lopez A, Lateral Diffusion of Lipids in Model and Natural Membranes. Prog Lipid Res 1994, 33 , 203–237. [DOI] [PubMed] [Google Scholar]
- 7.Gennis RB, Biomembranes: Molecular Structure and Function. Springer-Verlag: New York, 1989. [Google Scholar]
- 8.Roux B; Schulten K, Computational Studies of Membrane Channels. Structure 2004, 12, 1343–1351. [DOI] [PubMed] [Google Scholar]
- 9.Hille B, Ion channels of excitable membranes. Sinauer Associates: Sunderland, 2001. [Google Scholar]
- 10.Samanta A; Hughes TET; Moiseenkova-Bell VY, Transient Receptor Potential (TRP) Channels. Subcell Biochem 2018, 87, 141–165. [DOI] [PMC free article] [PubMed] [Google Scholar]
- 11.Owsianik G; Talavera K; Voets T; Nilius B, Permeation and Selectivity of TRP Channels. Ann Rev Physiol 2006, 68,685–717. [DOI] [PubMed] [Google Scholar]
- 12.Ramsey IS; Delling M; Clapham DE, An Introduction to TRP Channels. Annu Rev Physiol 2006, 68, 619–47. [DOI] [PubMed] [Google Scholar]
- 13.Suh BC; Hille B, PIP2 is a Necessary Cofactor for Ion Channel Function: How and Why? Ann Rev of Biophys 2008, 37, 175–195. [DOI] [PMC free article] [PubMed] [Google Scholar]
- 14.Liao MF; Cao EH; Julius D; Cheng YF, Single Particle Electron Cryo-Microcopy of a Mammalian Ion Channel. Curr Opin Struct Biol 2014, 27, 1–7. [DOI] [PMC free article] [PubMed] [Google Scholar]
- 15.Pumroy RA; Fluck EC; Ahmed T; Moiseenkova-Bell VY, Structural Insights Into the Gating Mechanisms of TRPV Channels. Cell Calcium 2020, 87, 12. [DOI] [PMC free article] [PubMed] [Google Scholar]
- 16.Hughes TET; Pumroy RA; Yazick AT; Kasimova MA; Fluck EC; Huynh KW; Samanta A; Molugu SK; Zhou H; Carnevale V; et al. ; Structural Insights on TRPV5 Gating by Endogenous Modulators. Nat Comm 2018, 9,1–11. [DOI] [PMC free article] [PubMed] [Google Scholar]
- 17.Zubcevic L, Temperature-sensitive transient receptor potential vanilloid channels: structural insights into ligand-dependent activation. Br. J. Pharmacol 2020,1–18. [DOI] [PubMed] [Google Scholar]
- 18.Chuang HH; Prescott ED; Kong H; Shields S; Jordt SE; Basbaum AI; Chao MV; Julius D, Bradykinin And Nerve Growth Factor Release the Capsaicin Receptor From Ptdins(4,5)P2-Mediated Inhibition. Nature 2001, 411, 957–962. [DOI] [PubMed] [Google Scholar]
- 19.Klein RM; Ufret-Vincenty C. a; Hua L; Gordon SE, Determinants Of Molecular Specificity in Phosphoinositide Regulation. Phosphatidylinositol (4,5)-Bisphosphate (PI(4,5)P2) is the Endogenous Lipid Regulating TRPV1. J Biol Chem 2008, 283, 26208–26216. [DOI] [PMC free article] [PubMed] [Google Scholar]
- 20.Elber R; Fathizadeh A; Ma P; Wang H, Modeling molecular kinetics with Milestoning. WIREs Computational Molecular Science 2020, 11, e1512 [Google Scholar]
- 21.Phillips JC; Braun R; Wang W; Gumbart J; Tajkhorshid E; Villa E; Chipot C; Skeel RD; Kale L; Schulten K, Scalable Molecular Dynamics with NAMD. J. Comput. Chem 2005, 26, 1781–1802. [DOI] [PMC free article] [PubMed] [Google Scholar]
- 22.Pastor RW; MacKerell AD, Development of the CHARMM Force Field for Lipids. J. Phys. Chem. Lett, 2011, 2, 1526–1532. [DOI] [PMC free article] [PubMed] [Google Scholar]
- 23.Miyamoto S; Kollman PA, SETTLE - An Analytical Version of The Shake And Rattle Algorithm for Rigid Water Models. J. Comput. Chem 1992, 13, 952–962. [Google Scholar]
- 24.Ryckaert JP; Ciccotti G; Berendsen HJC, Numerical integration of cartesian equations of m otion of a system with constraints - molecular dynamics of N-alkanes. J. Comput. Phys 1977, 23, 327–341. [Google Scholar]
- 25.Essmann U; Perera L; Berkowitz ML; Darden T; Lee H; Pedersen LG, A Smooth Particle Mesh Ewald Method. J. Chem. Phys 1995, 103, 8577–8593. [Google Scholar]
- 26.Jorgensen WL; Chandrasekhar J; Madura JD; Impey RW; Klein ML, Comparison Of Simple Potential Functions For Simulating Liquid Water. J. Chem. Phys 1983, 79, 926–935. [Google Scholar]
- 27.Martyna GJ; Tobias DJ; Klein ML, Constant-Pressure Molecular-Dynamics Algorithms. J. Chem. Phys 1994, 101, 4177–4189. [Google Scholar]
- 28.Feller SE; Zhang YH; Pastor RW; Brooks BR, Constant-Pressure Molecular-Dynamics Simulation - The Langevin Piston Method. J. Chem. Phys 1995, 103, 4613–4621. [Google Scholar]
- 29.Elber R, Milestoning: An Efficient Approach for Atomically Detailed Simulations of Kinetics in Biophysics. Annu Rev of Biophys, Dill KA, Ed. 2020, 49, 69–85. [DOI] [PubMed] [Google Scholar]
- 30.Fiorin G; Klein ML; Hénin J, Using collective variables to drive molecular dynamics simulations. Mol. Phys 2013, 111, 3345–3362. [Google Scholar]
- 31.Bello-Rivas JM; Elber R, Exact Milestoning. J. Chem. Phys 2015, 142, 094102. [DOI] [PMC free article] [PubMed] [Google Scholar]
- 32.Kooijman EE; King KE; Gangoda M; Gericke A, Ionization Properties of Phosphatidylinositol Polyphosphates in Mixed Model Membranes. Biochemistry 2009, 48, 9360–9371. [DOI] [PubMed] [Google Scholar]
- 33.Khandogin J; Brooks CL, Constant pH Molecular Dynamics With Proton Tautomerism. Biophys. J 2005, 89, 141–157. [DOI] [PMC free article] [PubMed] [Google Scholar]
- 34.Chen YJ; Roux B, Constant-pH Hybrid Nonequilibrium Molecular Dynamics Monte Carlo Simulation Method. J. Chem. Theory Comput 2015, 11, 3919–3931. [DOI] [PMC free article] [PubMed] [Google Scholar]
- 35.Stern HA, Molecular Simulation With Variable Protonation States At Constant pH J. Chem. Phys 2007, 127, 164112. [DOI] [PubMed] [Google Scholar]
- 36.Radak BK; Chipot C; Suh D; Jo S; Jiang W; Phillips JC; Schulten K; Roux B, Constant-pH Molecular Dynamics Simulations for Large Biomolecular Systems. J. Chem. Theory Comput 2017, 13, 5933–5944. [DOI] [PMC free article] [PubMed] [Google Scholar]
- 37.Cohen-Tannoudju C; Diu B; Laloe F, Quantum Mechanics. John-Wiley &Sons: New York, 1977. [Google Scholar]
- 38.Torrie GM; Valleau JP, Non-Physical Sampling Distributions In Monte-Carlo Free-Energy Estimation - Umbrella Sampling. J. Comput. Phys 1977, 23, 187–199. [Google Scholar]
- 39.Zwanzig RW, High-Temperature Equation Of State By A Perturbation Method .1. Nonpolar Gases. J. Chem. Phys 1954, 22, 1420–1426. [Google Scholar]
- 40.Bas D; Rogers D; Jensen JH, Very fast prediction and rationalization of pK(a) values for protein-ligand complexes. Proteins: Struct., Funct., Bioinf 2008, 73, 765–783. [DOI] [PubMed] [Google Scholar]
- 41.Muller MP; Jiang T; Sun C; Lihan MY; Pant S; Mahinthichaichan P; Trifan A; Tajkhorshid E, Characterization of Lipid-Protein Interactions and Lipid-Mediated Modulation of Membrane Protein Function through Molecular Simulation. Chemical Reviews 2019, 119, 6086–6161. [DOI] [PMC free article] [PubMed] [Google Scholar]
- 42.Meng XY; Zhang HX; Logothetis DE; Cui M, The Molecular Mechanism by which PIP2 Opens the Intracellular G-Loop Gate of a Kir3.1 Channel. Biophys. J 2012, 102, 2049–2059. [DOI] [PMC free article] [PubMed] [Google Scholar]
- 43.Yeh BI; Kim YK; Jabbar W; Huang CL, Conformational Changes of Pore Helix Coupled to Gating of TRPV5 by Protons. Embo J 2005, 24, 3224–3234 [DOI] [PMC free article] [PubMed] [Google Scholar]
- 44.Dhaka A, Uzzell V, Dubin AE; Mathur J; Petrus M; Bandell M; Patapoutian A, TRPV1 Is Activated by Both Acidic and Basic pH. J. Neurosci 2009, 29, 153–158 [DOI] [PMC free article] [PubMed] [Google Scholar]
- 45.Fujita F, Uchida K, Moriyama T, Shima A, Shibasaki K, Inada H, Sokabe T, Tominaga M. Intracellular Alkalization Causes Pain Sensation Through Activation of TRPA1 in Mice. J Clin Invest. 2008, 118 4049–57. [DOI] [PMC free article] [PubMed] [Google Scholar]
Associated Data
This section collects any data citations, data availability statements, or supplementary materials included in this article.