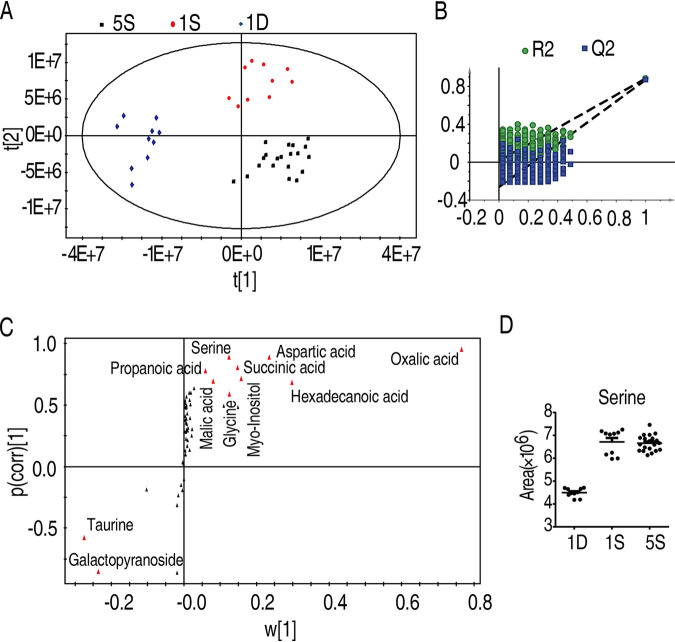
FIG 4.
Serine was a crucial biomarker. (A) Principal-component analysis of 1D, 1S, and 5S groups. Each dot represented one technical replicate. (B) The model was monitored using permutation tests. (C) The distribution of differential abundance of metabolites’ weight from PLS-DA to samples. Triangles represent metabolites. Potential biomarkers are highlighted in red. (D) Abundance of serine in 1D, 1S, and 5S. Statistical analysis was performed with Mann-Whitney U test. *, P < 0.05; **, P < 0.01. Error bars represented means ± SEM from at least three biological replicates.

