

Abstract
Objective
To compare clinical and imaging features of multiple sclerosis (MS) severity between Black Americans (BAs) and White Americans (WAs) and to evaluate the role of socioeconomic status.
Methods
We compared BA and WA participants in the Multiple Sclerosis Partners Advancing Technology Health Solutions (MS PATHS) cohort with respect to MS characteristics, including self-reported disability, objective neurologic function assessments, and quantitative brain MRI measurements, after covariate adjustment (including education level, employment, or insurance as socioeconomic indicators). In a subgroup, we evaluated within-race, neighborhood-level indicators of socioeconomic status (SES) using 9-digit zip codes.
Results
Of 1,214 BAs and 7,530 WAs with MS, BAs were younger, had lower education level, and were more likely to have Medicaid insurance or to be disabled or unemployed than WAs. BAs had worse self-reported disability (1.47-fold greater odds of severe vs mild disability, 95% confidence interval [CI] 1.18, 1.86) and worse performances on tests of cognitive processing speed (−5.06 fewer correct, 95% CI −5.72, −4.41), walking (0.66 seconds slower, 95% CI 0.36, 0.96), and manual dexterity (2.11 seconds slower, 95% CI 1.69, 2.54). BAs had more brain MRI lesions and lower overall and gray matter brain volumes, including reduced thalamic (−0.77 mL, 95% CI −0.91, −0.64), cortical (−30.63 mL, 95% CI −35.93, −25.33), and deep (−1.58 mL, 95% CI −1.92, −1.23) gray matter volumes. While lower SES correlated with worse neuroperformance scores in WAs, this association was less clear in BAs.
Conclusion
We observed a greater burden of disease in BAs with MS relative to WAs with MS, despite adjustment for SES indicators. Beyond SES, future longitudinal studies should also consider roles of other societal constructs (e.g., systemic racism). Such studies will be important for identifying prognostic factors; developing optimal treatment strategies among BAs with MS is warranted.
Clinical observations and emerging studies suggest that Black Americans (BAs) with multiple sclerosis (MS) tend to fare worse than their White American (WA) counterparts. Previous studies have suggested that BAs with MS have a greater burden of disease relative to WAs.1,2 Studies have reported BAs to have greater disability accumulation,3 earlier progression to requiring ambulatory assistance,4 faster lesion accumulation on brain MRI,5,6 faster brain and retinal tissue loss,7 and increased loss of high-contrast visual acuity after optic neuritis compared to WAs.8
Despite these reports, the published studies have created some gaps in knowledge, partially due to limitations in study design and methods. The larger studies were primarily retrospective and focused on global measures of disability (i.e., Expanded Disability Status Scale, Multiple Sclerosis Severity Score), semiquantitative scales that predominantly assess ambulatory function.1,9 Many of the studies evaluating other outcomes, particularly brain or retinal atrophy, had a small sample of BAs or were single-center studies,6-8,10,11 such that the precision of the estimates and the representativeness of the patients studied were concerns. Furthermore, the intersection of race with socioeconomic status, a known strong determinant of health12 as it relates to MS outcomes, has not been well described in US-based populations. Here, to address these gaps in the rigor of prior research, we sought to compare a comprehensive set of neuroperformance and imaging measures of disease severity in a large, multicenter cohort of BA and WA people with MS in the United States and to evaluate interactions between race and socioeconomic status with respect to these measures.
Methods
Data Collection
This cross-sectional study used data from US sites in the Multiple Sclerosis Partners Advancing Technology Health Solutions (MS PATHS) network, which is sponsored by Biogen, Inc (Cambridge, MA). MS PATHS is a collaboration among 10 MS centers; 7 are located in the United States. During routine clinic visits, standardized patient data are collected from patients with MS and clinically isolated syndrome, including the MS Performance Test, an iPad-based application requiring minimal assistance from staff.13 The MS Performance Test collects sociodemographic characteristics, including self-reported race, as well as clinical and disease information (including the Patient Determined Disease Steps [PDDS], which correlates well with the neurologic examination–based Expanded Disability Status Scale14), and objective assessments of walking speed, manual dexterity, and cognitive processing speed. These neuroperformance measures were designed to capture components similar to those of the MS Functional Composite (Timed 25-Foot Walk, 9-Hole Peg Test) and the validated Symbol Digit Modalities Test, commonly used outcome measures in MS clinical trials.15 MS PATHS participants who undergo clinical brain MRIs at the participating institutions agree to share their images with the network. At all sites, 2 standardized MRI acquisition sequences (3-dimensional T1 magnetization prepared rapid acquisition with gradient echo and 3-dimensional fluid-attenuated inversion recovery) on Siemens 3T scanners (Malvern, PA) were incorporated into routine MS brain MRI protocols.13 A software prototype (MS PATHS Image Evaluation) developed within the network is used for automated calculation of brain volumes, total T2 lesion volume, and new T2 lesion counts.16
Standard Protocol Approvals, Registrations, and Patient Consents
This study was reviewed and approved by the Johns Hopkins Medicine Institutional Review Board, an ethics standards committee on human experimentation for any experiment using human participants. As detailed comprehensively in a prior publication, patients provide informed consent for the sharing and use of their data, and MS PATHS has an established governance structure such that academic sites oversee their own scientific work using the data.13
Data Analysis
For the current analysis, we included first visit data from US MS PATHS participants with self-reported BA or WA race who were enrolled between September 2016 and September 2019. European participants were excluded due to differences in social and economic factors that might introduce heterogeneity in analyses that would be hard to interpret, as well as differences in privacy laws among countries that prevent the collection of race and ethnicity data.
We computed basic descriptive statistics on each of the groups and performed univariate tests for differences between the 2 groups using generalized linear models. Variables serving as proxies for socioeconomic status included education level, employment status, and insurance status. We classified participants self-reported disability as follows: mild (PDDS score <2), moderate (PDDS score 2–4), and severe (PDDS score >4). We then computed multivariate-adjusted odds ratios of moderate vs mild and severe vs mild disease in BAs relative to WAs. We also compared the multivariate-adjusted mean differences in neurologic performance outcomes, including the Walking Speed Test, Manual Dexterity Test, and Processing Speed Test (cognitive performance), as well as in quantitative brain MRI measurements (T2-weighted lesion volumes; periventricular, juxtacortical, and infratentorial lesions; and volumes of thalamic, cortical gray matter, deep gray matter, and brain compartments). Generalized linear models were used throughout. Models for PDDS, neuroperformance outcomes, and quantitative MRI data were adjusted for age, sex, disease subtype and duration, current disease-modifying therapy administration route, body mass index, smoking status, employment, education, and insurance status (Medicaid vs other).
Because education level is only 1 indicator of socioeconomic status in people with MS17 and cross-sectional measures of insurance type or employment status might reflect outcomes of MS-related disability,18 for MS PATHS participants who are followed up locally at Johns Hopkins, we used available 9-digit zip codes associated with participant addresses to incorporate additional measures of socioeconomic status that are derived from Census block-level data; zip codes are not available as part of the MS PATHS dataset. For these analyses, we restricted to patients who are geographically close to the center (e.g., residing in Maryland, Delaware, Pennsylvania, Virginia, and the District of Columbia) to minimize potential referral bias. Additional indicators of socioeconomic status include the median household income by 9-digit zip code and the area deprivation index (ADI). The ADI is an established composite index incorporating 17 different measures of socioeconomic status that is derived from the 9-digit zip code, and nationwide indices range from 0 (least disadvantaged) to 100 (most disadvantaged).19,20 We then assessed whether the association between race and MS outcomes was modified by these more detailed measures of socioeconomic status in this subset of participants using similarly adjusted generalized linear models.
Data Availability
MS PATHS data are currently available only to qualified investigators and collaborators of participating institutions.
Results
Demographic Characteristics
Among the participants in MS PATHS who were included in the analysis, 1,214 (14%) self-identified as BAs and 7,530 (86%) self-identified as WAs. Several demographic differences between the groups were notable (table 1). Relative to WAs, BAs at the time of the analysis were younger, had lower education level, and were less likely to be employed. BAs were also more likely to have Medicaid or Medicare insurance, to self-report progressive MS, and to be currently treated with higher-efficacy (infusion) medications (table 1). MS PATHS participants followed up locally at Johns Hopkins did not differ from the larger MS PATHS cohort with respect to demographic and clinical characteristics.
Table 1.
Demographics and Disease Characteristics Between BA and WA Patients With MS

Clinical Outcomes
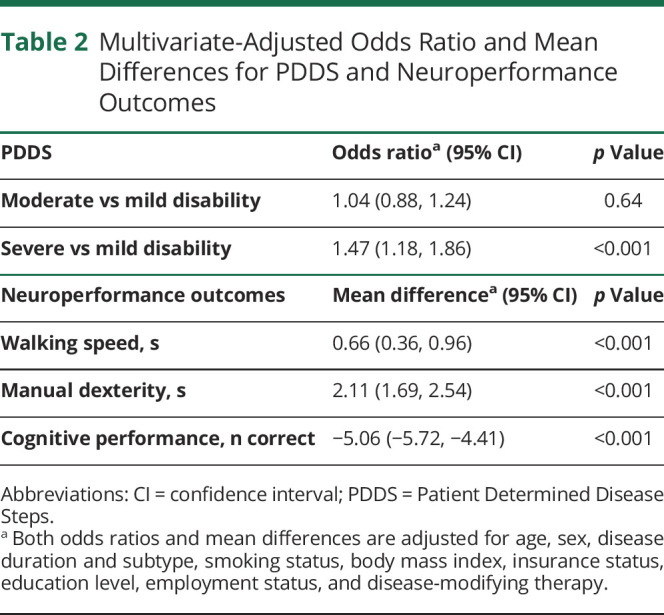
Adjusted for covariates as detailed above, BAs with MS performed more poorly on the self-administered neuroperformance scales with greater global disability scores (table 2). Furthermore, patient performance with respect to walking speed (mean 0.66 seconds slower in BAs [95% confidence interval 0.36, 0.96]), manual dexterity (mean 2.11 seconds slower in BAs [95% confidence interval 1.69, 2.54]), and cognitive processing speed (mean 5.06 fewer correct responses in BAs [95% confidence interval −5.72, −4.41]).
Table 2.
Multivariate-Adjusted Odds Ratio and Mean Differences for PDDS and Neuroperformance Outcomes
In multivariate analyses of brain MRI measures, BAs had 0.31 mL (95% confidence interval 0.25, 0.38) greater T2 lesion volume than WAs. In the evaluation of the location of lesions between races, this finding appears to be driven largely by greater volumes of periventricular and infratentorial lesions in BAs (table 3 and figure). Overall, brain volumes were also lower in BA patients. Furthermore, BAs had markedly lower gray matter volumes, including lower overall (gray matter fraction) and gray matter subcompartment volumes. BAs averaged lower volumes of cortical gray (−30.63 mL [95% confidence interval −35.93, −25.33]), deep gray (−1.58 mL [95% confidence interval −1.92, −1.23]), and thalamic (−0.77 mL [95% confidence interval −0.91, −0.64]) volumes (table 3 and figure).
Table 3.
Multivariate-Adjusted Mean Differences for Quantitative MRI Outcomes (n = 4,017)

Figure. Difference in Key MRI Outcomes Between Black American and White American MS PATHS Participants.
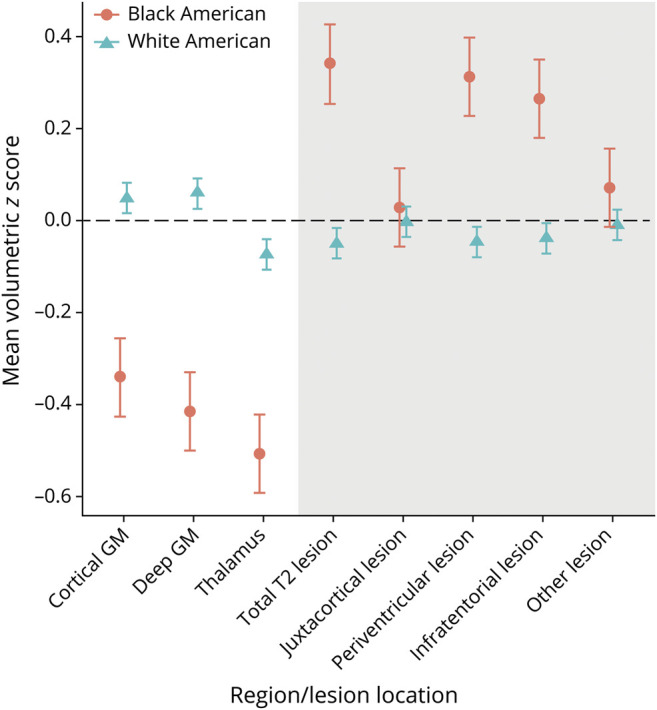
We transformed all brain regions or lesion volumes to have a mean equal to 0 and SD equal to 1 to allow all regions to be plotted on the same scale. Values plotted denote the unadjusted means for each racial group. GM = gray matter; MS PATHS = Multiple Sclerosis Partners Advancing Technology Health Solutions.
Effect Modification by Socioeconomic Status in the Johns Hopkins Cohort
In the Hopkins-only multivariate analysis, we explored more thoroughly the intersection between race and socioeconomic status in relation to the MS-related clinical and MRI measures herein. Among WA individuals, lower median household income was associated with slower cognitive processing and walking speeds, while a worse score on the ADI was associated with slower cognitive processing and manual dexterity speeds. On the other hand, among BA patients, lower median income was associated only with slower manual dexterity performance, and worse ADI scores were not meaningfully associated with differences in cognitive processing or walking or manual dexterity speeds (table 4). Relatively consistent findings were observed in the overall MS PATHS cohort when we used less-detailed general indicators of socioeconomic status (e.g., education status).
Table 4.
Mean Difference in Neuroperformance Outcomes for the Johns Hopkins Cohort

Discussion
In this large cross-sectional cohort, our results indicate that BAs with MS have consistently greater disease burden as measured in the domains of cognitive processing, walking, and manual dexterity than WAs, even after adjustment for relevant covariates. We also affirm findings from prior studies that MS in BAs is associated with greater overall disability (PDDS score) and greater burden of disease as measured by MRI (lesion volumes, gray matter volumes). These results provide confirmatory evidence that at the group level, BAs with MS fare worse than their WA counterparts across multiple clinical and imaging domains. The brain and gray matter volume findings in particular are noteworthy because in healthy cohorts BAs have greater brain volumes than WAs21; furthermore, reductions in gray matter volume have been strongly predictive of longer-term clinical disability in people with MS,22-28 suggesting that the results herein are likely to persist in longitudinal studies. This consistency of results, particularly after adjustment for confounders, improves confidence in the findings and demonstrates that BAs face MS-related disability that extends beyond reduced ambulation. The likelihood of selection bias may be reduced by the use of a multicenter cohort and large sample size; the patients studied are more likely to be representative of the broader population of people with MS in the United States than in smaller, single-center studies.
Our analysis of how socioeconomic status relates to outcomes between and within racial groups is crucial considering that socioeconomic status is associated with poor health outcomes in a variety of disease states. For example, in another common autoimmune disorder, systemic lupus erythematosus, multivariate models demonstrate that BA race, socioeconomic status, and a specific HLA haplotype are all independently associated with worse outcomes.29 Here, not only do we find that adjusting for socioeconomic status in multivariate models does not attenuate the relation of BA race to worse outcomes but also, similar to what we have reported with respect to the relation of race and socioeconomic status to health-related quality of life in MS PATHS participants,30 we observe that lower socioeconomic status correlates with worse outcome among WAs, but intriguingly, these associations do not appear to be present among BAs. This pattern of findings is also evident in the MRI analysis that we performed, which is removed from subjective rater or self-reporting bias associated with clinical measures and assesses objective biological differences in the diseases process between BAs and WAs.
There are many potential interpretations of the results. It is likely that there may still be unmeasured confounders related to systematic racism and health outcomes that explain the findings herein. For example, while in the MS PATHS cohort BAs were actually more likely to be treated with higher-efficacy MS medications than WAs, we cannot exclude that differential or biased previous treatment strategies or adherence by race, leading to undertreatment early in the disease course and thus worsened longer-term outcomes in BAs,31,32 contributed to the findings herein. Systematic differences in treatment for BAs have been demonstrated for many health conditions, including neurologic conditions.33 Furthermore, perhaps medical comorbid conditions (vascular comorbid conditions such as hypertension34) or other aspects related to the burden of the cumulative experience of discrimination and racism,35 inside and outside of the health care experience and for which we were not able to adjust, are operative in these populations. Genetic differences could contribute as well. For example, in patients with lupus, a greater load of susceptibility risk alleles was associated with increased risk of childhood-onset lupus, which has a more severe phenotype, among BAs but not WAs.36
Our study has several limitations. This is a cross-sectional study, and as for all cross-sectional studies, one must carefully consider the directionality of the results and in particular whether reverse causality might account for the findings. This is certainly possible here, and longitudinal studies should be performed. That being said, it seems less likely that race and the myriad health and social conditions that differ by race in the United States, which begin early in life and may extend generationally (before MS onset for a given individual), are a consequence of MS or MS-related disability. Assumptions that employment or insurance type are indicators of socioeconomic status may be too simple; people with MS who are more disabled may be less likely to be employed or to have access to private insurance due to their disability rather than due to socioeconomic status. We also explored education level as a measure of socioeconomic status, but even this may be problematic because the study measured only quantity, not quality, of education, which also does not likely capture racism-based differences between the experiences of BAs and WAs. On the other hand, in our more detailed Hopkins-only analysis, we were able to apply neighborhood-level indicators, including median household income and ADI, as more comprehensive measures of socioeconomic status rather than solely the metrics above. These results should be considered exploratory due to the single-center nature of the study and because the confidence intervals (particularly in the BA subgroup) were wide for some of the estimates. Finally, although some of our results could be affected by type 1 error, we intentionally selected a limited number of hypothesis-driven outcomes to study herein, many of which may be highly related, and thus, findings consistent across models are less likely due to error.
Across the board, BA patients with MS appear to have greater burden of inflammatory and neurodegenerative measures of MS, along with worse neurologic performance. While lower socioeconomic status appears to be correlated with worse neuroperformance measures in WAs, in this cross-sectional study, this association is less clear in BAs with MS, at least at a single time point. While this may inspire more robust studies of genetic prognostic factors within BAs with MS,37 it seems more likely that unmeasured confounding (e.g., differences in quality despite apparent similarities in length of education, as discussed above), the relatively smaller size of the BA cohort, cross-sectional design, or all issues contribute to the lack of an association of socioeconomic status within the BA group. Representative cohort studies that longitudinally assess comorbidity or comorbidity management, MS disease activity, and MS therapy use, along with indications for that use of therapy to account for confounding by indication, are needed, and the MS PATHS cohort is expanding its collection to include more robust assessments of many previously unmeasured covariates. The results also reinforce the need for more racially representative phase 3 clinical trials38 and comparative-effectiveness research focusing on treatment strategies specifically in the BA population to identify whether, for example, certain therapies or more aggressive early treatment will better mitigate long-term disability accrual. Finally, identifying other modifiable prognostic factors within the BA MS population may allow focused efforts on their mitigation that, in turn, will improve outcomes.
Glossary
- ADI
area deprivation index
- BA
Black American
- MS
multiple sclerosis
- MS PATHS
Multiple Sclerosis Partners Advancing Technology Health Solutions
- PDDS
Patient Determined Disease Steps
- WA
White American
Appendix. Authors

Footnotes
CME Course: NPub.org/cmelist
Study Funding
The authors report no targeted funding.
Disclosure
K. Gray-Roncal and K.C. Fitzgerald report no disclosures; L.Z. Ryerson received personal compensation for advisory board participation for Biogen and received research support from Biogen. L. Charvet and S.D. Cassard report no disclosures. R. Naismith has consulted for Alexion, Alkermes, Bayer, Biogen, Celgene, EMD Serono, Genentech, Genzyme, Lundbeck, Nervgen, Novartis, Third Rock Ventures, and Viela Bio. D. Ontaneda received research support from the NIH, National Multiple Sclerosis Society, Patient Centered Outcomes Research Institute, Race to Erase MSFoundation, Genentech, Genzyme, and Novartis, as well as consulting fees from Biogen Idec, Genentech/Roche, Genzyme, Novartis, and Merck. K. Mahajan is funded by the NIH National Institute of Neurological Disorders and Stroke K23 Career Development Award 1K23NS109328. W. Castro-Borrero is an employee of and holds stock/stock options in Biogen. E.M. Mowry has grants from Biogen and Genzyme, is site principal investigator for studies sponsored by Biogen, has received free medication for a clinical trial from Teva, and receives royalties for editorial duties from UpToDate. Go to Neurology.org/N for full disclosures.
References
- 1.Ventura RE, Antezana AO, Bacon T, Kister I. Hispanic Americans and African Americans with multiple sclerosis have more severe disease course than Caucasian Americans. Mult Scler. 2016;23(11):1554-1557. [DOI] [PubMed] [Google Scholar]
- 2.Khan O, Williams MJ, Amezcua L, Javed A, Larsen KE, Smrtka JM. Multiple sclerosis in US minority populations: clinical practice insights. Neurol Clin Pract. 2015;5(2):132-142. [DOI] [PMC free article] [PubMed] [Google Scholar]
- 3.Kister I, Chamot E, Salter AR, Cutter GR, Bacon TE, Herbert J. Disability in multiple sclerosis: a reference for patients and clinicians. Neurology. 2013;80(11):1018-1024. [DOI] [PMC free article] [PubMed] [Google Scholar]
- 4.Rinker JR, Trinkaus K, Naismith RT, Cross AH. Higher IgG index found in African Americans versus Caucasians with multiple sclerosis. Neurology. 2007;69(1):68-72. [DOI] [PubMed] [Google Scholar]
- 5.Weinstock-Guttman B, Ramanathan M, Hashmi K, et al. Increased tissue damage and lesion volumes in African Americans with multiple sclerosis. Neurology. 2010;74(7):538-544. [DOI] [PubMed] [Google Scholar]
- 6.Howard J, Battaglini M, Babb JS, et al. MRI correlates of disability in African-Americans with multiple sclerosis. PLoS One. 2012;7(8):e43061. [DOI] [PMC free article] [PubMed] [Google Scholar]
- 7.Caldito NG, Saidha S, Sotirchos ES, et al. Brain and retinal atrophy in African-Americans versus Caucasian-Americans with multiple sclerosis: a longitudinal study. Brain. 2018;141(11):3115-3129. [DOI] [PMC free article] [PubMed] [Google Scholar]
- 8.Kimbrough DJ, Sotirchos ES, Wilson JA, et al. Retinal damage and vision loss in African American multiple sclerosis patients: retinal damage in MS. Ann Neurol. 2015;77(2):228-236. [DOI] [PMC free article] [PubMed] [Google Scholar]
- 9.Cree BA, Khan O, Bourdette D, et al. Clinical characteristics of African Americans vs Caucasian Americans with multiple sclerosis. Neurology. 2004;63(11):2039-2045. [DOI] [PubMed] [Google Scholar]
- 10.Petracca M, Zaaraoui W, Cocozza S, et al. An MRI evaluation of grey matter damage in African Americans with MS. Mult Scler Relat Disord. 2018;25:29-36. [DOI] [PMC free article] [PubMed] [Google Scholar]
- 11.Al-Kawaz M, Monohan E, Morris E, et al. Differential impact of multiple sclerosis on cortical and deep gray matter structures in African Americans and Caucasian Americans. J Neuroimaging. 2016;27(3):333-338. [DOI] [PubMed] [Google Scholar]
- 12.Artiga S, Hinton E. Beyond Health Care: The Role of Social Determinants in Promoting Health and Health Equity. Kaiser Family Foundation; 2018. [Google Scholar]
- 13.Mowry EM, Bermel RA, Williams JR, et al. Harnessing real-world data to inform decision-making: Multiple Sclerosis Partners Advancing Technology and Health Solutions (MS PATHS). Front Neurol. 2020;11:632. [DOI] [PMC free article] [PubMed] [Google Scholar]
- 14.Learmonth YC, Motl RW, Sandroff BM, Pula JH, Cadavid D. Validation of Patient Determined Disease Steps (PDDS) scale scores in persons with multiple sclerosis. BMC Neurol. 2013;13(1):37. [DOI] [PMC free article] [PubMed] [Google Scholar]
- 15.Rao SM, Galioto R, Sokolowski M, et al. Multiple Sclerosis Performance Test: validation of self-administered neuroperformance modules. Eur J Neurol. 2020;27(5):878-886. [DOI] [PubMed] [Google Scholar]
- 16.Roche A, Maréchal B, Kober T, et al. Assessing brain volumes using MorphoBox prototype. MAGNETOM Flash. 2017;68(2):33-38. [Google Scholar]
- 17.Marrie RA, Cutter G, Tyry T, Vollmer T, Campagnolo D. Does multiple sclerosis associated disability differ between races?. Neurology. 2006;66(8):1235-1240. [DOI] [PubMed] [Google Scholar]
- 18.ACTRIMS 2019–posters. Mult Scler J. 2019;25:20-156. [Google Scholar]
- 19.Kind A, Jencks S, Brock J, et al. Neighborhood socioeconomic disadvantage and 30 day rehospitalizations: an analysis of Medicare data. Ann Intern Med. 2014;161:765-774. [DOI] [PMC free article] [PubMed] [Google Scholar]
- 20.Singh GK. Area deprivation and widening inequalities in US Mortality, 1969-1998. Am J Public Health. 2003;93(7):1137-1143. [DOI] [PMC free article] [PubMed] [Google Scholar]
- 21.Brickman AM, Schupf N, Manly JJ, et al. Brain morphology in older African Americans, Caribbean Hispanics, and Whites from Northern Manhattan. Arch Neurol. 2008;65(8):1053-1061. [DOI] [PMC free article] [PubMed] [Google Scholar]
- 22.Losseff NA, Wang L, Lai HM, et al. Progressive cerebral atrophy in multiple sclerosis: a serial MRI study. Brain. 1996;119(pt 6):2009-2019. [DOI] [PubMed] [Google Scholar]
- 23.Fisher E, Lee JC, Nakamura K, Rudick RA. Gray matter atrophy in multiple sclerosis: a longitudinal study. Ann Neurol. 2008;64(3):255-265. [DOI] [PubMed] [Google Scholar]
- 24.Fisniku LK, Chard DT, Jackson JS, et al. Gray matter atrophy is related to long-term disability in multiple sclerosis. Ann Neurol. 2008;64(3):247-254. [DOI] [PubMed] [Google Scholar]
- 25.Fisher E, Rudick RA, Cutter G, et al. Relationship between brain atrophy and disability: an 8-year follow-up study of multiple sclerosis patients. Mult Scler. 2000;6(6):373-377. [DOI] [PubMed] [Google Scholar]
- 26.Horakova D, Dwyer MG, Havrdova E, et al. Gray matter atrophy and disability progression in patients with early relapsing-remitting multiple sclerosis: a 5-year longitudinal study. J Neurol Sci. 2009;282(1):112-119. [DOI] [PubMed] [Google Scholar]
- 27.Gauthier SA, Berger AM, Liptak Z, et al. Rate of brain atrophy in benign vs early multiple sclerosis. Arch Neurol. 2009;66(2):234-237. [DOI] [PubMed] [Google Scholar]
- 28.Rudick RA, Lee JC, Nakamura K, Fisher E. Gray matter atrophy correlates with MS disability progression measured with MSFC but not EDSS. J Neurol Sci. 2009;282(1-2):106-111. [DOI] [PMC free article] [PubMed] [Google Scholar]
- 29.Alarcón GS, Roseman J, Bartolucci AA, et al. Systemic lupus erythematosus in three ethnic groups, II: features predictive of disease activity early in its course. Arthritis Rheum. 1998;41(7):1173-1180. [DOI] [PubMed] [Google Scholar]
- 30.Wang Y, Tian F, Fitzgerald KC, et al. Socioeconomic status and race are correlated with affective symptoms in multiple sclerosis. Mult Scler Relat Disord. 2020;41:102010. [DOI] [PMC free article] [PubMed] [Google Scholar]
- 31.Reinard K, Nerenz DR, Basheer A, et al. Racial disparities in the diagnosis and management of trigeminal neuralgia. J Neurosurg. 2017;126(2):368-374. [DOI] [PubMed] [Google Scholar]
- 32.Faigle R, Ziai WC, Urrutia VC, Cooper LA, Gottesman RF. Racial differences in palliative care use after stroke in majority-white, minority-serving, and racially integrated U.S. hospitals. Crit Care Med. 2017;45(12):2046-2054. [DOI] [PMC free article] [PubMed] [Google Scholar]
- 33.Marulanda-Londoño ET, Bell MW, Hope OA, et al. Reducing neurodisparity. Neurology. 2019;92(6):274-280. [DOI] [PubMed] [Google Scholar]
- 34.Buron MD, Chalmer TA, Sellebjerg F, et al. Initial high-efficacy disease-modifying therapy in multiple sclerosis. Neurology. 2020;95(8):e1041-e1051. [DOI] [PubMed] [Google Scholar]
- 35.Beatty Moody DL, Taylor AD, Leibel DK, et al. Lifetime discrimination burden, racial discrimination, and subclinical cerebrovascular disease among African Americans. Health Psychol. 2019;38(1):63-74. [DOI] [PMC free article] [PubMed] [Google Scholar]
- 36.Webb R, Kelly JA, Somers EC, et al. Early disease onset is predicted by a higher genetic risk for lupus and is associated with a more severe phenotype in lupus patients. Ann Rheum Dis 2011;70(1):151-156. [DOI] [PMC free article] [PubMed] [Google Scholar]
- 37.Wallin MT, Culpepper WJ, Campbell JD, et al. The prevalence of MS in the United States: a population-based estimate using health claims data. Neurology. 2019;92(10):e1029-e1040. [DOI] [PMC free article] [PubMed] [Google Scholar]
- 38.Enhancing the Diversity of Clinical Trial Populations: Eligibility Criteria, Enrollment Practices, and Trial Designs Draft Guidance for Industry. US Department of Health and Human Services Food and Drug Administration; 2019. [Google Scholar]
Associated Data
This section collects any data citations, data availability statements, or supplementary materials included in this article.
Data Availability Statement
MS PATHS data are currently available only to qualified investigators and collaborators of participating institutions.