

Abstract
Objective
To identify non‐EEG‐based signals and algorithms for detection of motor and non‐motor seizures in people lying in bed during video‐EEG (VEEG) monitoring and to test whether these algorithms work in freely moving people during mobile EEG recordings.
Methods
Data of three groups of adult people with epilepsy (PwE) were analyzed. Group 1 underwent VEEG with additional devices (accelerometry, ECG, electrodermal activity); group 2 underwent VEEG; and group 3 underwent mobile EEG recordings both including one‐lead ECG. All seizure types were analyzed. Feature extraction and machine‐learning techniques were applied to develop seizure detection algorithms. Performance was expressed as sensitivity, precision, F 1 score, and false positives per 24 hours.
Results
The algorithms were developed in group 1 (35 PwE, 33 seizures) and achieved best results (F 1 score 56%, sensitivity 67%, precision 45%, false positives 0.7/24 hours) when ECG features alone were used, with no improvement by including accelerometry and electrodermal activity. In group 2 (97 PwE, 255 seizures), this ECG‐based algorithm largely achieved the same performance (F 1 score 51%, sensitivity 39%, precision 73%, false positives 0.4/24 hours). In group 3 (30 PwE, 51 seizures), the same ECG‐based algorithm failed to meet up with the performance in groups 1 and 2 (F 1 score 27%, sensitivity 31%, precision 23%, false positives 1.2/24 hours). ECG‐based algorithms were also separately trained on data of groups 2 and 3 and tested on the data of the other groups, yielding maximal F 1 scores between 8% and 26%.
Significance
Our results suggest that algorithms based on ECG features alone can provide clinically meaningful performance for automatic detection of all seizure types. Our study also underscores that the circumstances under which such algorithms were developed, and the selection of the training and test data sets need to be considered and limit the application of such systems to unseen patient groups behaving in different conditions.
Keywords: accelerometry, ECG, electrodermal activity, mobile EEG, seizure detection
Abbreviations
- ACC
accelerometry
- EDA
electrodermal activity
- HR
heart rate
- PwE
people with epilepsy
- VEEG
video‐EEG
Key Points.
The performance of non‐EEG‐based signals and algorithms for detection of motor and non‐motor seizures was tested in 3 distinct groups.
ECG‐derived algorithms alone provided meaningful performance for automatic detection of all seizure types.
Performance metrics were dependent on the circumstances under which the algorithms were developed.
The selection of the training and test data sets had a strong impact on the performance of the algorithms.
The development of seizure detection devices requires prospective validation in different conditions and independent patient groups.
1. INTRODUCTION
About one third of people with epilepsy (PwE) has recurrent seizures despite regular intake of anti‐seizure drugs.1 Counseling of PwE requires a reasonable estimate of seizure frequency. To this end, PwE or their relatives and caretakers commonly keep an electronic or paper diary documenting seizure occurrence. A considerable proportion of PwE, however, are not aware of their seizures, forget them, or do not document them for other reasons.2, 3 Thus, self‐reported seizure diaries are unreliable tools for both daily clinical practice as well as clinical trials to assess efficacies of anti‐seizure treatments. Assistive technologies may help PwE to increase correctness of seizure documentation and adjustment of anti‐seizure treatments. Recording of electrical brain activity using surface or intracranial EEG electrodes is the gold standard for seizure detection but are not suitable for all patients and all seizure types. For instance, implantable intracranial EEG recording systems require surgery and are limited to small brain areas.4 Furthermore, PwE appear to prefer non‐invasive and removable detection devices as stated in a previous survey.5
Alternative options are wearable devices equipped with various sensor technologies capturing seizure‐related activities outside the brain such as wrist sensors, chest belts, in‐ear sensors, and others. Previous studies have already proven that automatic seizure detection with reasonable performance is feasible particularly in seizures with predominant motor symptoms (eg, tonic seizures, focal to bilateral tonic‐clonic seizure, and generalized tonic‐clonic seizures) and the use of sensors based on accelerometry (ACC) or electromyography.6, 7 The detection of auras or typical temporal lobe seizures without major motor phenomena, however, is still challenging. Previous studies have investigated alterations of autonomic functions such as heart rate (HR) and electrodermal activity (EDA) in response to seizures with an increase of HR by more than 50% in about 80%‐90% of focal seizures as well as a rise in EDA.8, 9, 10
Here, we hypothesized that most types of epileptic seizures can be detected by analysis of seizure‐related non‐EEG‐based biosignals with appropriate algorithms and that the conditions under which the algorithms were developed to determine their applicability. To address these issues, we developed detection algorithms in PwE during VEEG monitoring while lying in bed and equipped with an ECG sensor alongside with three ACC sensors and palm electrodes for recording of EDA. The resulting algorithms were then tested in two separate patient groups (one group lying in bed and the other group moving freely around).
2. METHODS
2.1. Patients
Adult patients aged 18 years or older with refractory epilepsy who underwent VEEG monitoring in the Department of Epileptology in Bonn for non‐invasive presurgical evaluation, syndrome diagnosis, or monitoring of seizure control were included in the study. The routine diagnostics in most patients of groups 1 and 2 comprised cerebral 3 Tesla MRI, neuropsychological testing, and continuous VEEG monitoring using non‐invasive scalp‐EEG recordings (Micromed® system). Patients of group 3 underwent mobile scalp‐EEG recordings (Micromed® system). A modified lead‐I‐ECG with two adhesive chest electrodes was recorded simultaneously in all patients as part of the routine during VEEG and mobile EEG recordings. Details on patient and seizure characteristics are summarized in Tables 1 and 2.
TABLE 1.
Characteristics of the patient groups. Categorical variables (sex, seizure onset zone, etiology) were compared with chi‐square tests; metric variables were compared with ANOVA tests and Bonferroni corrections
| Group 1 | Group 2 | Group 3 | P‐value | ||
|---|---|---|---|---|---|
| Number of patients | 35 | 97 | 30 | ||
| Age in years (mean, 95% CI) | 36 (32‐41) | 39 (37‐42) | 39 (33‐44) | .58 | |
| Epilepsy duration in years | 17 (13‐21) | 13 (11‐16) | 18 (13‐24) | .09 | |
| Sex | Female | 19/54.3% | 56/57.7% | 8/26.7% | .011 |
| Male | 16/45.7% | 41/42.3% | 22/73.3% | ||
| Seizure‐onset zone (number/proportion) | Unknown | 6/17.14% | 11/11.3% | 0 | .039 |
| Generalized | 0 | 8/8.2% | 6/20% | ||
| Frontal | 4/11.4% | 7/7.2% | 0 | ||
| Temporal | 23/65.7% | 58/59.8% | 20/66.7% | ||
| Parietal | 1/2.9% | 1/1% | 0 | ||
| Occipital | 0 | 1/1% | 1/3.3% | ||
| Insular | 1/2.9% | 0 | 0 | ||
| Hemispheric | 0 | 2/2.1% | 2/6.7% | ||
| Multifocal | 0 | 4/4.1% | 1/3.3% | ||
| Psychogenic | 0 | 5/5.2% | 0 | ||
| Etiology | Unknown | 12/34.3% | 28/28.9% | 7/23.3% | .007 |
| Genetic/idiopathic generalized | 0 | 7/7.2% | 5/16.7% | ||
| Epileptic/developmental encephalopathy | 0 | 1/1% | 3/10% | ||
| Disorders of cortical development | 6/17.1% | 12/12.4% | 1/3.3% | ||
| Hippocampal sclerosis | 10/28.6% | 19/18.1% | 2/6.7% | ||
| Perinatal and infantile cerebral injuries | 0 | 2/2.1% | 0 | ||
| Posttraumatic | 0 | 1/0.6% | 0 | ||
| Tumor | 3/8.6% | 4/6% | 3/10% | ||
| Postinfectious | 0 | 2/2.1% | 0 | ||
| Vascular | 1/2.9% | 4/4.1% | 3/10% | ||
| Immunological | 1/2.9% | 14/14.4% | 6/20% | ||
| Psychogenic, non‐epileptic seizures | 0 | 5/5.2% | 0 |
Significant values with P ≤ .05 are marked in bold.
TABLE 2.
Number and duration of seizures. The seizure durations were compared with ANOVA tests and Bonferroni corrections
| Seizure type | Seizure number/mean duration (min‐max) | |||
|---|---|---|---|---|
| Group 1 | Group 2 | Group 3 | P‐value (duration) | |
| Focal aware non‐motor seizures (FANMS) | 3/134 s (97‐184) | 22/149 s (10‐549) | 22/48 s (18‐139) | .025 |
| Focal aware motor seizures (FAMS) | 0/n.a. | 77/40 s (2‐134) | 0/n.a. | n.a. |
| Focal impaired awareness motor seizures (FIAMS) | 0/n.a. | 8/114 s (54‐200) | 7/73 s (38‐166) | .15 |
| Focal impaired awareness non‐motor seizures (FIANMS) | 25/59 s (19‐120) | 101/94 s (3‐560) | 11/64 s (28‐255) | .05 |
| Focal to bilateral tonic‐clonic seizures (FBTCS) | 4/261 s (115‐658) | 15/224 s (66‐954) | 1/187 s | .94 |
| Generalized‐onset tonic‐clonic seizure (GTCS) | 1/90 s | 2/93 s (93‐93) | 1/111 s | 0 |
| Generalized‐onset motor seizures (GMS) | 0/n.a. | 24/16 s (1‐65) | 2/43 s (26‐61) | .04 |
| Generalized absence seizures (GAS) | 0/n.a. | 3/13 s (8‐22) | 0/n.a. | n.a. |
| Unclassified seizures | 0/n.a. | 3/36 s (22‐61) | 7/67 s (24‐114) | .22 |
Abbreviation: n.a., not applicable.
Significant values with P ≤ .05 are marked in bold.
2.2. Wearable devices
In addition to the standard EEG and ECG electrodes during VEEG and mobile EEG recordings, patients of group 1 were equipped with wearable devices provided by MoviSens GmbH (Karlsruhe, Germany) during VEEG controlled recording of epileptic seizures. A device (EcgMove) attached to the chest (Figure 1A) allowed recordings of ECG and acceleration of the trunk, a second device (EdaMove) was attached to both wrists (Figure 1B), allowing measurement of acceleration of arm movements and EDA. Sample rates were 64 Hz for the acceleration signals, 1024 Hz for the ECG, and 32 Hz for the EDA.
FIGURE 1.

MoviSens sensor units. Patients of group 1 only were equipped with three portable and wearable devices. A, One device was attached to the chest and allowed recordings of ECG and acceleration of the body. B, Two devices were attached to both wrists, allowing measurement of acceleration of arm movements and EDA
2.3. Seizure detection algorithms
The algorithms were derived from analysis of data in patient group 1 (training data set) and applied to data obtained in patients of groups 2 and 3 (distinct test data sets) to assess the performance and its value for unseen patients and conditions. To quantify seizure‐related signal changes across different sensors, multiple features from each modality (ACC, EDA, and ECG in group 1) were calculated. Three sliding windows shifted over the respective signals along the time axis in 10 s‐steps to account for variable seizure duration and to fully characterize seizure‐related alterations as follows (Figure 2):
Pre‐event window: 5‐min (300 s) window to assess long‐term changes before a time point of interest.
Post‐event window: 5‐min (300 s) window to assess long‐term changes after a time point of interest.
Event window: 10‐s window to assess instantaneous changes at a given time point of interest (‘event’).
FIGURE 2.

The windowing concept and concurrent recording from different modalities. The upper time series displays ECG data, the middle signal EDA, and the traces the ACC data from three axes. For any time point of interest (‘event’), a 10‐s window, a 5‐min window before the time point, and a 5‐min window after the time point were considered for feature extraction. All features will be the combined to represent a seizure event in a multi‐dimensional space
2.3.1. Training on data of patient group 1
For each of three windows of three ACC signals, the following features were measured: average displacement, standard deviation of displacement, average velocity, standard deviation of velocity, average acceleration, and standard deviation of acceleration. The following features were determined for the three shifting time windows of the two EDA signals: mean of EDA, standard deviation of EDA, mean of first deviation of EDA, and standard deviation of first deviation EDA. ECG signals were treated in a more complex manner. A total of 105 basic as well as time and frequency domain features of HR variability (HRV) were derived from RR intervals (RRI) determined with an R‐peak detection algorithm as follows: HR per min, mean of RRI, standard deviation of RRI (SDNN), maximum of RRI, minimum of RRI, root‐mean‐square of successive differences of RRI (RMSSD), Shannon entropy of RRI, total power spectral density (PSD), very low frequency (VLF) of PSD in [0.003 0.04] Hz, low frequency (LF) of PSD of RRI in [0.04 0.15] Hz, high frequency (HF) of PSD of RRI in [0.15 0.4] Hz, Cardiac Vagal Index (CVI), Cardiac Sympathetic Index (CSI), NN50, pNN50, and fold variation of HR in two consecutive minutes. In addition to the determination of the ECG features alone, the difference of pre‐ictal versus post‐ictal features was calculated for 23 selected ECG features. See also Table S1 for more details.
To better identify time windows during putative epileptic seizures and to limit the number of false positives, a filtering function was arbitrarily set (ie, relative HR increase by 1.2 within a 1‐min time window as compared to the 1 min before; Figure 3). The windows that survived the filtering procedure were fed to the classifier. To stratify the patterns into their respective correct class (seizure versus non‐seizure), the Random Forest (RF) classifier was used because this model was shown to be appropriate for data which are widely scattered in the feature space.11 The probability threshold was set to 20% to increase the sensitivity of our system at the cost of more false alarms.
FIGURE 3.
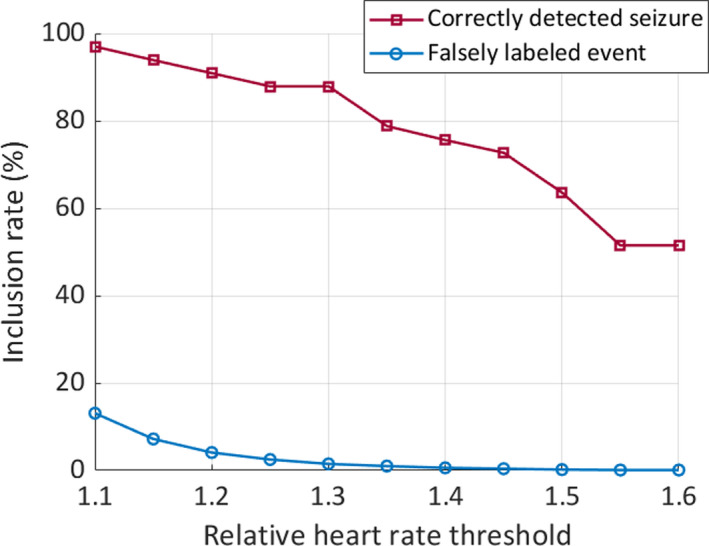
Inclusion rate of events depends on heart rate thresholds. The graph shows that the proportion of correctly labeled events (ie, seizures, in red) when choosing a filter threshold of 1.2‐fold HR increase is well above 90%, while the proportion of falsely labeled events (in blue) drops below 5%
Multimodal recordings were only acquired and tested in patients of group 1. The algorithms included a variable set of modalities in different combinations (ie, ECG alone; ECG and EDA; ECG and ACC; ECG, EDA, and ACC). To evaluate the performance of seizure detection algorithms, a fivefold cross‐validation scheme was conducted. To that end, the data of group 1 were divided into five portions; four of them were used for training and one data portion for testing (80/20 split) to determine performance metrics. This procedure was repeated four times more to cover the other combinations so that all the five portions were used only once for testing. Then, the performance measures of all five procedures were averaged, which yielded the final performance metrics in the results section.
2.3.2. Training on data of patient groups 2 and 3
We also wanted to explore the impact of different training data sets on the test performances. To that end, ECG‐based algorithms (including the 105 HRV features only, see Table S1) were trained as outlined above, using data of patient groups 2 and 3, respectively, and tested on each of the two unseen data sets. ACC and EDA data were not recorded in these patients.
2.4. Statistics and ethics
Comparison of patient and seizure characteristics was performed using chi‐square tests for categorical variables (sex, seizure onset zone, etiology) and ANOVA tests for metric variables; Bonferroni corrections were applied. Performance metrics are reported as sensitivity (also called recall; defined as the proportion of actual positives that are correctly identified as such), precision (also called positive predictive value; defined as the proportion of actual positives among the retrieved events), F 1 score (defined as 2× precision ×sensitivity)/(precision + sensitivity), and false alarms per 24 hours. The part of the study including patients of group 1 has been approved by the local medical ethics committee (Ethikkommission der Medizinischen Fakultät der Rheinischen Friedrich‐Wilhelms‐Universität Bonn, No. 140/13). Patients of group 2 were part of another prospective study for seizure detection which has been approved by the local medical ethics committee (no. 355/16). All patients of groups 1 and 2 gave informed consent for their participation prior to recordings. All data of patients in group 3 were collected during standard clinical care, so that additional informed patient consensus was not required, as approved by the local medical ethics committee (no. 352/12).
3. RESULTS
3.1. Development of seizure detection algorithms in patient group 1
In group 1, a total of 33 seizures were recorded in 35 patients. Since many seizures do not display overt motor symptoms on the one hand, and changes in HR are not specific and occur in many instances on the other hand, we systematically explored the impact of relative HR changes on the proportion of correctly identified seizures and the exclusion of non‐seizure events. It turned out that a threshold of 1.2‐fold HR increase results in a reasonable inclusion of truly positive events (ie, seizures) and the exclusion of most non‐seizure events that are related with an increased HR (Figure 3). This HR filter was arbitrarily set to all data that were fed into the classifier.
A total of 225 features (derived from ECG, EDA, and accelerometry) were determined and fed into the machine‐learning algorithms (see Table S1). The algorithm with the best results was achieved when 105 HRV features extracted from ECG alone were used (see Table S1). In a total recording time of 1030 hours, 22 seizures were correctly identified and 30 events were falsely labeled as seizures. This results in a maximal F 1 score of 55.6%, a sensitivity of 66.9%, and a precision of 44.7% (see Figure 4) with no further improvement by considering the other two modalities (ACC, EDA). False alarms amounted to 0.7 per 24 hours. We have conducted a feature search approach based on two‐sample t test to check for the information every ECG‐feature carries. A selection of the most relevant features is listed in Table 3.
FIGURE 4.

Performance metrics of the algorithm developed with data of group 1 in all 3 patient groups. While the F 1 score in groups 1 and 2 was similar, sensitivity and precision differed. In patient group 3, all performance metrics were considerably lower as compared to the groups 1 and 2
TABLE 3.
Most relevant ECG‐based features for automatic seizure detection
| DiffHeartBeatPrePost | Difference of heart rate, pre‐event vs. post‐event |
|---|---|
| DiffMeanRRIntervalPrePost | Difference of average RRI, pre‐event vs post‐event |
| DiffEntropyRRIntervalPrePost | Difference of entropy of RRI, pre‐event vs post‐event |
| DiffCVIPrePost | Difference of CVI, pre‐event vs post‐event |
| DiffCSIPrePost | Difference of CSI, pre‐event vs post‐event |
| DiffRRIPSDVLFPrePost | Difference of PSD of RRI in VLF, pre‐event vs post‐event |
| DiffRRIPSDLFPrePost | Difference of PSD of RRI in LF, pre‐event vs post‐event |
| DiffRRIPSDHFPrePost | Difference of PSD of RRI in HF, pre‐event vs post‐event |
| DiffRRIPSDTotalPowerPrePost | Difference of PSD of RRI in all freq., pre‐event vs post‐event |
| DiffRRIPSDPowerRatioPrePost | Difference of PSD of RRI in power ratio, pre‐event vs post‐event |
| DiffNN50PrePost | Difference of NN50, pre‐event vs post‐event |
| DiffPNN50PrePost | Difference of PNN50, pre‐event vs post‐event |
| ecgRelHR | Relative heart rate fold change |
3.2. Validation of seizure detection algorithms in patient group 2
The ECG‐based algorithms (105 HRV features only, see Table S1) were validated in a separate patient group with 97 patients with VEEG (and routine one‐lead ECG) who were bound to bed and who had a total of 255 seizures. HR threshold was set to 1.2; recordings from group 2 were used as training and test data sets. Patient and seizure characteristics are summarized in Tables 1 and 2. In a total recording time of 1827 hours, 99 seizures were correctly identified and 30 events were falsely labeled as seizures. This results in a maximal F 1 score of 51%, a sensitivity of 39%, and a precision of 73% (see Figure 4). False alarms amounted to 0.4 per 24 hours.
3.3. Testing of seizure detection algorithms in patient group 3
The same ECG‐based algorithms (105 HRV features only, see Table S1) were applied in group 3 consisting of patients with mobile EEG (and routine one‐lead ECG), allowing them to move freely on the ward. HR threshold was set to 1.2, recordings from group 1 were used as training data set, and recordings from group 3 were used as test data set. Patient and seizure characteristics are summarized in Tables 1 and 2. Thirty patients had a total of 51 seizures. In a total recording time of 758 hours, 16 seizures were correctly identified, and 38 events were falsely labeled as seizures. This results in a maximal F 1 score of 26.5%, a sensitivity of 31.4%, and a precision of 22.9% (see Figure 4). False alarms amounted to 1.2 per 24 hours.
3.4. Performance of ECG‐based algorithm trained and tested in different scenarios
To investigate to what extent the performance metrics depends on the variation of the training and unseen test data sets, ECG‐based algorithms (105 HRV features only, see Table S1) were also separately trained on data of groups 2 and 3 and tested on the data of the two remaining patient groups, respectively. This variation of the training and test data sets yielded different maximal F 1 score between 8% and 26%, depending on the specific constellation (Table 4).
TABLE 4.
Performance of ECG‐based algorithms with separate training and test data sets yielded low performance. ECG‐based algorithms were separately trained on data of patient groups 1, 2, or 3 (as indicated column 1) and tested on the respective remaining groups (as indicated in column 2)
| Training data | Test data | Sensitivity (%) | Precision (%) | Max. F 1 score (%) | False alarms/24 hours |
|---|---|---|---|---|---|
| Group 1 | Group 3 | 40 | 19 | 26 | 3 |
| Group 1 | Group 2 | 29 | 6 | 10 | 2 |
| Group 2 | Group 3 | 34.6 | 15 | 21 | 3.1 |
| Group 2 | Group 1 | 4 | 60 | 8 | 0.08 |
| Group 3 | Group 1 | 62.8 | 6.2 | 11.2 | 5.1 |
| Group 3 | Group 2 | 29.2 | 5.9 | 9.9 | 2.4 |
4. DISCUSSION
In the present study, we have tested in three independent patient groups whether different seizure types, particularly focal impaired awareness seizures without predominant motor symptoms, can be detected using non‐EEG‐based biosignals. Our results suggest that ECG features alone can principally provide a clinically meaningful performance for automatic detection of all types of epileptic seizures, but also underscores that the circumstances under which such algorithms were developed and the question of whether training and test data sets were taken from different patient groups (ie, distinct, and independent), limit the application of such systems to unseen patient groups behaving in different conditions (Figure 4; Table 4).
4.1. Study limitations
Firstly, we have prospectively collected seizure‐related data (EDA, ECG, ACC) in a subgroup of patients (group 1) with the goal of developing algorithms for automatic real‐time seizure detection. However, pre‐defined algorithms were not prospectively applied and thus the performance of real‐time seizure detection was not explicitly tested. Instead, we have applied this algorithm to two separate sets of data (groups 2 and 3) to estimate its performance. Secondly, we have applied event filtering (ie, set thresholds for relative HR changes) to reduce complexity for machine learning and to increase the performance. This is an established strategy but is likely to decrease sensitivity even the threshold is rather moderate (minimal HR change of 20% required to pass the filter).12 Thirdly, due to the retrospective design only limited interictal ECG data were available for patients of group 2 (in most patients only 24 hours) and group 3 (only 24 or 48 hours), so that the number of false‐positive alarms per patient tends to be underestimated. Fourthly, our patient groups were not matched with respect to demographic and epilepsy‐related features, but the composition of the groups displayed significant differences. This might have influenced the performance of the algorithms to some extent but is unlikely to be a major physiologic confounder with respect to seizure‐related HR increases. Finally, we have included only adult patients, limiting the generalizability of our results to pediatric populations.
4.2. Performance metrics in general and compared to previous studies
Seizure detection devices and their performances were previously reviewed by several groups.13, 14 In contrast to our study, most studies aimed at the detection of seizures with major motor symptoms including generalized convulsive seizures (ie, focal to bilateral tonic‐clonic seizures or generalized tonic‐clonic seizures) and therefore mostly used devices targeting movements of extremities or electric muscle activity. Prospectively tested devices for generalized convulsive seizures or major seizures (defined as tonic‐clonic, generalized tonic with duration >30 s, hyperkinetic, or others, including clusters >30 min of short myoclonic/tonic seizures) achieved F 1 scores amounting to 86%‐95%.6, 7, 15 Seven studies investigated (or have specified to investigate) focal impaired awareness seizures, of which 2 studies used a mobile EEG device.16, 17 In one of the five remaining studies, the authors used a combined device with EDA and ACC attached to the wrist and showed that significant EDA increases occurred in association with focal impaired awareness seizures, but more pronounced following focal to bilateral tonic‐clonic seizures.10, 18 Performance metrics, however, were not given. In another study, the authors have analyzed a total recording time of 701 hours including 47 seizures (mostly focal impaired awareness seizures) in 11 patients, using ECG and photopletysmography devices.19 They yielded a sensitivity of 70% and 57% with ECG and photopletysmography, respectively, with 2.11 and 1.92 false alarms per hour, respectively, giving a F 1 score of 4% and 2%. In a further study, nocturnal non‐motor focal seizures of temporal and frontal lobe onset with a duration of at least 20 s (probably mostly containing focal impaired awareness seizures) were investigated with the help of ECG data only.12 The authors yielded a sensitivity of 83% (24 of 29 focal seizures were detected) using an individualized, patient‐dependent algorithm based on two HR features; the false‐positive alarms amounted to 5.36 per night for temporal lobe seizures, roughly giving an F 1 score of 44%. In comparison with our results, their algorithm has performed better with respect to the sensitivity, but the false positives appear to be more frequent. As the authors have selected nocturnal ECG data only and seizures lasting longer than 20 s, the true number of false positives produced by their algorithm might be higher, as the number of false positives related to daily activities and HR increases related to short nocturnal arousals are excluded by their event filtering strategy. At the same time, sensitivity might be lowered in the case of short‐lasting seizures. In two recent clinical studies, algorithms for detection of focal seizures without predominant motor symptoms (ie, nonconvulsive seizures) were developed based on HRV features and prospectively tested.20, 21 Of 100 consecutively recruited patients during VEEG, 43 had a total of 126 (108 nonconvulsive and 18 convulsive) seizures.20 The best algorithm combined a HRV measure of sympathetic activity and a measure of velocity of HR changes. In about 54% of the patients, at least 66% of the seizures were detected. In this subgroup, detection sensitivity amounted to 93% for all seizures and 91% for focal seizures, false‐alarm rate was 1 per 24 hours (and 0.11/night). Importantly, the authors reported that a seizure‐related HR increase of >50 beats per min predicted good performance of the HRV‐based algorithm (positive predictive value of 87%, negative predictive value of 90%).20 This HRV‐based algorithm was prospectively tested in selected 19 patients undergoing VEEG: All 8 focal impaired awareness seizures were detected, and 2 of 4 focal aware seizures, underscoring the potential of ECG‐based algorithms for detection of focal seizures after careful and clinically reasonable patient selection.21
4.3. Clinical impact and outlook
As compared to the previous studies investigating focal, impaired awareness seizures,12, 19, 20, 21 our algorithms performed fairly well if the unseen ECG data were recorded under the same circumstances (ie, in people lying in bed) and without selecting specific patient groups (eg, based on extend of seizure‐related HR changes, or seizure duration and daytime of onset). In unseen and freely behaving subjects, the detection algorithms performed, however, less well, underscoring the need for a clear distinction of training and test data sets on the one hand, and clinical trials under realistic conditions at home on the other hand, as recently suggested by Beniczky and Ryvlin in 2018.22 When evaluating the use of a system for automatic seizure detection, one needs also to consider the performance of self‐reported seizure documentation, which appear to yield F 1 scores around 50%, which may set the threshold for the added value of an automatic detection device.13 Furthermore, a proportion of seizures does not go along with relevant HR increases or display variable and dynamic HR patterns, thus limiting the applicability of HR‐based detection systems.8, 23 As previously suggested a patient‐dependent personalized algorithm which takes into account individual seizure‐related autonomic patterns and which is tested during daily life activities might be the way forward to develop reliable automatic seizure detection systems for a broad range of seizure types including focal impaired awareness seizures.12, 24
5. ETHICAL PUBLICATION STATEMENT
We confirm that we have read the Journal's position on issues involved in ethical publication and affirm that this report is consistent with those guidelines.
CONFLICTS OF INTEREST
The authors declare that the research was conducted in the absence of any commercial or financial relationship that could be construed as a potential conflict of interest. CEE has served as a paid consultant for Desitin, Pfizer, and UCB Pharma. HH is an employee of the Karlsruhe Institute of Technology and received no fees or payment from third party. He was an employee of the Life and Brain Institute Bonn. RDN has received fees as speaker or consultant from Eisai. RS has received fees as speaker or consultant from Arvelle, Bial, Desitin, Eisai, LivaNova, Novartis, UCB Pharma, and UNEEG.
Supporting information
Table S1
ACKNOWLEDGMENTS
This study was partially funded by a grant from the Boll foundation (Kerpen, Germany). The authors would also like to thank the ‘Verein zur Förderung der Epilepsieforschung e.V.’, Bonn, Germany, for travel costs to present the results at a congress.
Jahanbekam A, Baumann J, Nass RD, et al. Performance of ECG‐based seizure detection algorithms strongly depends on training and test conditions. Epilepsia Open. 2021;6:597–606. 10.1002/epi4.12520
REFERENCES
- 1.Kwan P, Brodie MJ. Epilepsy after the first drug fails: substitution or add‐on? Seizure. 2000;9:464–8. [DOI] [PubMed] [Google Scholar]
- 2.Hoppe C, Poepel A, Elger CE. Epilepsy: accuracy of patient seizure counts. Arch Neurol. 2007;64:1595–9. [DOI] [PubMed] [Google Scholar]
- 3.Kerling F, Mueller S, Pauli E, Stefan H. When do patients forget their seizures? An electroclinical study. Epilepsy Behav. 2006;9:281–5. [DOI] [PubMed] [Google Scholar]
- 4.Henle C, Raab M, Cordeiro JG, Doostkam S, Schulze‐Bonhage A, Stieglitz T, et al. First long term in vivo study on subdurally implanted Micro‐ECoG electrodes, manufactured with a novel laser technology. Biomed Microdevice. 2011;13:59–68. [DOI] [PubMed] [Google Scholar]
- 5.Hoppe C, Feldmann M, Blachut B, Surges R, Elger CE, Helmstaedter C. Novel techniques for automated seizure registration: patients’ wants and needs. Epilepsy Behav. 2015;52:1–7. [DOI] [PubMed] [Google Scholar]
- 6.Beniczky S, Polster T, Kjaer TW, Hjalgrim H. Detection of generalized tonic‐clonic seizures by a wireless wrist accelerometer: a prospective, multicenter study. Epilepsia. 2013;54:e58–61. [DOI] [PubMed] [Google Scholar]
- 7.Beniczky S, Conradsen I, Henning O, Fabricius M, Wolf P. Automated real‐time detection of tonic‐clonic seizures using a wearable EMG device. Neurology. 2018;90:e428–34. [DOI] [PMC free article] [PubMed] [Google Scholar]
- 8.Leutmezer F, Schernthaner C, Lurger S, Potzelberger K, Baumgartner C. Electrocardiographic changes at the onset of epileptic seizures. Epilepsia. 2003;44:348–54. [DOI] [PubMed] [Google Scholar]
- 9.Surges R, Scott CA, Walker MC. Enhanced QT shortening and persistent tachycardia after generalized seizures. Neurology. 2010;74:421–6. [DOI] [PMC free article] [PubMed] [Google Scholar]
- 10.Poh MZ, Loddenkemper T, Reinsberger C, Swenson NC, Goyal S, Sabtala MC, et al. Convulsive seizure detection using a wrist‐worn electrodermal activity and accelerometry biosensor. Epilepsia. 2012;53:e93–7. [DOI] [PubMed] [Google Scholar]
- 11.Breiman L. Random forests. Mach Learn. 2001;45:5–32. [Google Scholar]
- 12.De Cooman T, Varon C, Van de Vel A, Jansen K, Ceulemans B, Lagae L, et al. Adaptive nocturnal seizure detection using heart rate and low‐complexity novelty detection. Seizure. 2018;59:48–53. [DOI] [PubMed] [Google Scholar]
- 13.Bidwell J, Khuwatsamrit T, Askew B, Ehrenberg JA, Helmers S. Seizure reporting technologies for epilepsy treatment: a review of clinical information needs and supporting technologies. Seizure. 2015;32:109–17. [DOI] [PubMed] [Google Scholar]
- 14.Kurada AV, Srinivasan T, Hammond S, Ulate‐Campos A, Bidwell J. Seizure detection devices for use in antiseizure medication clinical trials: a systematic review. Seizure. 2019;66:61–9. [DOI] [PubMed] [Google Scholar]
- 15.Arends J, Thijs RD, Gutter T, Ungureanu C, Cluitmans P, Van Dijk J, et al. Multimodal nocturnal seizure detection in a residential care setting: a long‐term prospective trial. Neurology. 2018;91:e2010–9. [DOI] [PMC free article] [PubMed] [Google Scholar]
- 16.Gu Y, Cleeren E, Dan J, Claes K, Van Paesschen W, Van Huffel S, et al. Comparison between scalp EEG and behind‐the‐ear EEG for development of a wearable seizure detection system for patients with focal epilepsy. Sensors (Basel). 2017;18(1):29. [DOI] [PMC free article] [PubMed] [Google Scholar]
- 17.Zibrandtsen IC, Kidmose P, Christensen CB, Kjaer TW. Ear‐EEG detects ictal and interictal abnormalities in focal and generalized epilepsy ‐ A comparison with scalp EEG monitoring. Clin Neurophysiol. 2017;128:2454–61. [DOI] [PubMed] [Google Scholar]
- 18.Poh MZ, Loddenkemper T, Reinsberger C, Swenson NC, Goyal S, Madsen JR, et al. Autonomic changes with seizures correlate with postictal EEG suppression. Neurology. 2012;78:1868–76. [DOI] [PMC free article] [PubMed] [Google Scholar]
- 19.Vandecasteele K, De Cooman T, Gu Y, Cleeren E, Claes K, Paesschen WV, et al. Automated epileptic seizure detection based on wearable ECG and PPG in a hospital environment. Sensors (Basel). 2017;17(10):2338. [DOI] [PMC free article] [PubMed] [Google Scholar]
- 20.Jeppesen J, Fuglsang‐Frederiksen A, Johansen P, Christensen J, Wüstenhagen S, Tankisi H, et al. Seizure detection based on heart rate variability using a wearable electrocardiography device. Epilepsia. 2019;60:2105–13. [DOI] [PubMed] [Google Scholar]
- 21.Jeppesen J, Fuglsang‐Frederiksen A, Johansen P, Christensen J, Wüstenhagen S, Tankisi H, et al Seizure detection using heart rate variability: a prospective validation study. Epilepsia. 2020;61(Suppl 1):S41–6. [DOI] [PubMed] [Google Scholar]
- 22.Beniczky S, Ryvlin P. Standards for testing and clinical validation of seizure detection devices. Epilepsia. 2018;59(Suppl 1):9–13. [DOI] [PubMed] [Google Scholar]
- 23.Jordan A, Bausch M, Surges R. Semi‐automatic quantification of seizure‐related effects on heart activity. Epilepsy Res. 2019;157:106187. [DOI] [PubMed] [Google Scholar]
- 24.Cogan D, Birjandtalab J, Nourani M, Harvey J, Nagaraddi V. Multi‐biosignal analysis for epileptic seizure monitoring. Int J Neural Syst 2016;26:1650031. [DOI] [PubMed] [Google Scholar]
Associated Data
This section collects any data citations, data availability statements, or supplementary materials included in this article.
Supplementary Materials
Table S1