

Abstract
Tubulin polyglutamylation is a post‐translational modification of the microtubule cytoskeleton, which is generated by a variety of enzymes with different specificities. The “tubulin code” hypothesis predicts that modifications generated by specific enzymes selectively control microtubule functions. Our recent finding that excessive accumulation of polyglutamylation in neurons causes their degeneration and perturbs axonal transport provides an opportunity for testing this hypothesis. By developing novel mouse models and a new glutamylation‐specific antibody, we demonstrate here that the glutamylases TTLL1 and TTLL7 generate unique and distinct glutamylation patterns on neuronal microtubules. We find that under physiological conditions, TTLL1 polyglutamylates α‐tubulin, while TTLL7 modifies β‐tubulin. TTLL1, but not TTLL7, catalyses the excessive hyperglutamylation found in mice lacking the deglutamylase CCP1. Consequently, deletion of TTLL1, but not of TTLL7, prevents degeneration of Purkinje cells and of myelinated axons in peripheral nerves in these mice. Moreover, loss of TTLL1 leads to increased mitochondria motility in neurons, while loss of TTLL7 has no such effect. By revealing how specific patterns of tubulin glutamylation, generated by distinct enzymes, translate into specific physiological and pathological readouts, we demonstrate the relevance of the tubulin code for homeostasis.
Keywords: axonal transport, polyglutamylation, TTLL1, TTLL7, tubulin post‐translational modifications
Subject Categories: Cell Adhesion, Polarity & Cytoskeleton; Neuroscience
New mouse models and modification‐specific antibodies reveals that tubulin glutamylases TTLL1 and TTLL7 generate unique glutamylation patterns on neuronal microtubules, which regulate mitochondria motility and neuronal survival.
Introduction
Given the multitude of essential functions of the microtubule cytoskeleton in neurons, it is no surprise that a large number of neurodegenerative disorders involve dysfunctions of microtubules and their associated proteins (reviewed in Matamoros & Baas, 2016). Surprisingly though, little is known on the cytoskeletal functions that might be perturbed in these disorders. The search for pathological mechanisms is difficult as microtubules in neurons have a variety of essential roles, such as determination of neuron shape (Baas et al, 2016) and polarity (van Beuningen & Hoogenraad, 2016), control of intra‐neuronal transport (Guedes‐Dias & Holzbaur, 2019; Sleigh et al, 2019) and synaptic activity (Guedes‐Dias & Holzbaur, 2019; Dent, 2020), and they are also involved in neuronal regeneration (Blanquie & Bradke, 2018). How these distinct functions can be coordinated within one and the same microtubule cytoskeleton mostly remained a conundrum. Understanding how distinct microtubule functions can be selectively controlled in neurons might provide a key to understand cytoskeletal alterations in neurodegenerative diseases.
The concept of the tubulin code (Verhey & Gaertig, 2007) proposes that microtubule properties and functions can be determined by tubulin isotypes incorporated into the microtubules and/or by modifying microtubules with a set of characteristic post‐translational modifications (PTMs) (Janke & Magiera, 2020). Tubulin PTMs can rapidly and dynamically change the identity of microtubules in cells and might thereby “encode” them for specific functions. Indeed, microtubules in neurons carry many of the well‐characterised tubulin PTMs, indicating that they play key roles in coordinating neuronal microtubule functions (Janke & Magiera, 2020).
One PTM that is strongly enriched in neurons is polyglutamylation, a polymodification that adds secondary peptide chains of variable numbers of glutamates onto glutamic acid residues of the primary peptide chains of tubulins. All currently known sites of polyglutamylation are located within the carboxy‐terminal (C‐terminal) tails of α‐ and β‐tubulin (Eddé et al, 1990; Alexander et al, 1991; Rüdiger et al, 1992). Polyglutamylation is catalysed by a variety of enzymes from the tubulin tyrosine ligase‐like (TTLL) family (Janke et al, 2005; van Dijk et al, 2007) and is reversed by deglutamylases from the cytosolic carboxypeptidase (CCP) family (Rogowski et al, 2010; Tort et al, 2014). Each glutamylase has a characteristic way to modify tubulin: enzymes have preferences for either α‐ or β‐tubulin, as well as for the initiation or elongation of the glutamate chains (van Dijk et al, 2007; Mahalingan et al, 2020). Henceforth, it is expected that each of these enzymes generates a unique polyglutamylation pattern on microtubules, which in turn “encodes” specific microtubule functions. However so far, this hypothesis has not been tested under physiological conditions.
In neurons, several glutamylases and deglutamylases are expressed. Strikingly, and in stark contrast to tubulin‐modifying enzymes involved in acetylation and detyrosination, two other tubulin PTMs that are also prominent in neurons, enzymes catalysing polyglutamylation are predominantly expressed in the adult brain (Bodakuntla et al, 2020b), suggesting that polyglutamylation might play a central role in neuronal homeostasis throughout life. This notion has been confirmed by our recent findings that the lack of deglutamylating enzymes, which causes an abnormal increase of polyglutamylation, leads to neurodegeneration in mice and humans (Rogowski et al, 2010; Magiera et al, 2018; Shashi et al, 2018). By contrast, mouse models in which other tubulin PTMs were altered present either early neurodevelopmental abnormalities as seen in a mouse with strongly increased tubulin detyrosination (Erck et al, 2005; Aillaud et al, 2017) or no striking neuronal phenotypes, such as a mouse lacking tubulin acetylation (Kalebic et al, 2013).
The causative role of abnormally accumulated polyglutamylation in neurodegeneration has initially been demonstrated in the so‐called Purkinje‐cell‐degeneration (pcd) mice (Mullen et al, 1976) that carry a mutation in the AGTPBP1 or NNA1 gene (Fernandez‐Gonzalez et al, 2002) encoding the deglutamylase CCP1. Loss of CCP1 in these mice leads to hyperglutamylation in brain regions where CCP1 is the main deglutamylase (Rogowski et al, 2010) and which had been shown to degenerate in pcd mice (Mullen et al, 1976; Greer & Shepherd, 1982). The degeneration of the Purkinje cells in the cerebellum of CCP1‐deficient mice could be entirely prevented by the concomitant depletion of the polyglutamylase TTLL1 (Berezniuk et al, 2012; Magiera et al, 2018), which suggested that re‐equilibration of polyglutamylation saved these neurons from degeneration. While this demonstrated that accumulation of polyglutamylation is causative for the observed degeneration, the underlying mechanisms of these defects have not been fully understood. Increased polyglutamylation led to a reduction of axonal transport of a variety of neuronal cargoes in hippocampal pyramidal neurons, with a particularly strong impact on mitochondria motility (Magiera et al, 2018; Bodakuntla et al, 2020b), which was also found in cerebellar granule neurons (Gilmore‐Hall et al, 2019). How tightly this transport defect is linked to different polyglutamylation levels on neuronal microtubules and whether specific polyglutamylases play distinct roles in controlling neuronal transport and causing neurodegeneration have remained open questions.
Here, we generated a series of a novel mouse models lacking combinations of the deglutamylase CCP1 and glutamylases TTLL1 (Janke et al, 2005) and TTLL7 (Ikegami et al, 2006) to demonstrate that different patterns of polyglutamylation generated by specific enzymes have distinct biological functions in controlling axonal transport and the overall survival of different neurons in vivo.
Results
TTLL1 and TTLL7 are the two main glutamylases in adult mouse brain
Our recent expression analysis of tubulin‐modifying enzymes in brain tissue had shown that several TTLL family members are expressed in adult brain. Using quantitative RT–PCR, we found substantial expression levels for the glutamylases TTLL1, TTLL5, TTLL7 and TTLL11 (Bodakuntla et al, 2020b). Previous biochemical work has shown that TTLL1 is a major polyglutamylase in brain tissue, as depletion of this enzyme led to a massive loss of the overall glutamylation activity in brain extracts (Janke et al, 2005). A second enzyme with an important role in the nervous system is TTLL7, as depletion of this enzyme in cultured neuronal cells caused a drop in β‐tubulin glutamylation (Ikegami et al, 2006). These early experiments suggested that TTLL1 and TTLL7 might be key enzymes involved in the control of tubulin polyglutamylation in adult brain; however, functional evidence for this hypothesis was so far lacking.
To determine the contribution of TTLL1 and TTLL7 to microtubule polyglutamylation in the nervous system, we first characterised mouse strains lacking either of these two enzymes. While the Ttll1 −/− mouse was already available (Magiera et al, 2018), we generated a new Ttll7 −/− mouse model for this study (Appendix Fig S1). We first characterised polyglutamylation status in brain tissue of these two mouse models using a panel of (poly)glutamylation‐specific antibodies. As the established antibodies GT335, recognising the branch point of glutamate chains (Wolff et al, 1992), and polyE, which specifically detects long glutamate chains, and thus polyglutamylation (Shang et al, 2002; Rogowski et al, 2010), barely detected β‐tubulin glutamylation, we developed a novel antibody exclusively recognising β‐tubulin glutamylation. Early mass‐spectrometry analyses had pinpointed that the major β‐tubulin isotype in the brain, β2‐tubulin, is mostly glutamylated on the glutamate residue (E) 435 (Rüdiger et al, 1992). This glutamylation site is preceded by a glycine (G) and followed by a phenylalanine (F) residue (Fig 1A) and can therefore not be detected by the broadly used antibody for glutamylation, GT335, which requires an acidic amino acid residue at the position following the glutamylation site (Wolff et al, 1992) (Fig 1A, yellow residues). This explains why GT335 had persistently shown very weak detection levels of β‐tubulin in past studies and underpinned the need for a new detection tool. We thus raised polyclonal antibodies to a peptide mimicking the C‐terminal tail of β2‐tubulin (TubB2) with a single‐glutamate branch at E435 (Fig 1B). This antibody was called β‐monoE.
Figure 1. TTLL1 and TTLL7 have distinct enzymatic specificities in brain and in neurons.
-
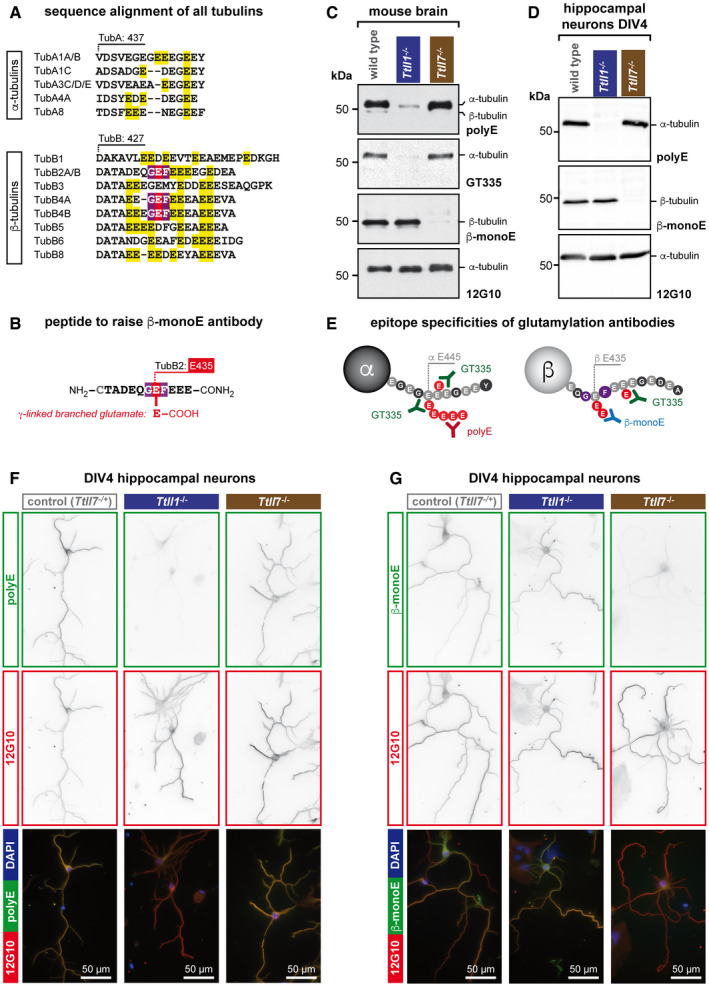
AAlignment of sequences of all human α‐ and β‐tubulin isotypes. Only the C‐terminal tail region of the tubulins is shown. Isotypes with identical amino acid sequence in these regions are pooled. A large number of glutamate residues in the C‐terminal tails would, if modified by glutamylation, be detectable with GT335 (yellow), which requires one additional acidic amino acid residue after the modification site (Wolff et al, 1992). By contrast, the GEF motif (red/purple), which is the main glutamylation site in β2‐tubulin (TUBB2) in the brain (Rüdiger et al, 1992), is present only in a few β‐tubulin isotypes, but not in α‐tubulin.
-
BSchematic representation of the synthetic peptide used as antigen to raise the β‐monoE antibody. The modified glutamate residue is in red.
-
CRepresentative immunoblots of brain extracts of wild‐type, Ttll1 −/− and Ttll7 −/− mice. Polyglutamylation of α‐tubulin, detected with polyE and GT335, is specifically lost in Ttll1 −/− brain. By contrast, β‐tubulin glutamylation, which is specifically detected with β‐monoE, is absent from brains of Ttll7 −/− mice.
-
DRepresentative immunoblots of extracts of wild‐type, Ttll1 −/− and Ttll7 −/− primary hippocampal neurons at DIV4. As in brain (C), α‐tubulin polyglutamylation is specifically lost in Ttll1 −/− neurons, while β‐tubulin glutamylation lacks in Ttll7 −/− neurons.
-
ESchematic representation of the epitopes detected by the anti‐glutamylation antibodies used in this study. For clarity, α‐ and β‐tubulin are shown separately.
-
F, GImmunocytochemistry of DIV4 primary hippocampal neurons from wild‐type, Ttll1 −/− and Ttll7 −/− mice. Microtubules in Ttll1 −/− cells have reduced levels of polyE signal, indicative of lower α‐tubulin polyglutamylation (F), and Ttll7 −/− neurons are specifically reduced in β‐monoE reactivity, indicating the lack of β‐tubulin glutamylation (G).
Source data are available online for this figure.
To detect the levels of glutamylation on α‐ and β‐tubulin, brain extracts from wild‐type, Ttll1 −/− and Ttll7 −/− mice were separated on SDS–PAGE gels that allow a clear separation of α‐ and β‐tubulin (Magiera & Janke, 2013). Additionally, we adjusted all samples to equal tubulin content in order to specifically highlight changes in levels and distribution of the tubulin PTMs. In wild‐type brain, the novel β‐monoE antibody detected a strong and specific signal on β‐tubulin, while entirely omitting α‐tubulin. By contrast, GT335 and polyE strongly labelled α‐tubulin, but showed virtually no signal on β‐tubulin (Fig 1C; wild type). This shows that, as predicted, the novel β‐monoE antibody is specific to the glutamylated GEF motif found on β2‐tubulin, but appears to not detect any other glutamylation site, given the complete lack of α‐tubulin detection (Fig 1E).
In the Ttll1 −/− brains, the strong labelling of α‐tubulin with GT335 and polyE was almost entirely lost, while the β‐monoE antibody detected similar β‐tubulin glutamylation levels as in wild‐type brains (Fig 1C; Ttll1 −/−). In Ttll7 −/− brains, by contrast, only the β‐monoE labelling disappeared, while GT335 and polyE remained unchanged (Fig 1C; Ttll7 −/−). These observations demonstrate that in the nervous system, the glutamylation of α‐ and β‐tubulin is independently controlled by TTLL1 and TTLL7, respectively. It also shows that—at least in the mature brain—TTLL1 and TTLL7 are the predominant polyglutamylating enzymes of tubulin. Importantly, our experiments also reveal that the loss of glutamylation on α‐ and β‐tubulin in Ttll1 −/− and Ttll7 −/− brains is not compensated for by other TTLL enzymes. The independent and distinct roles of TTLL1 and TTLL7 in tubulin glutamylation are key prerequisites allowing these enzymes to independently control yet‐to‐be defined functions of the microtubule cytoskeleton.
So far, we had characterised α‐ and β‐tubulin in whole‐brain extracts, which contain neurons as well as glia cells. To ascertain that both TTLL1 and TTLL7 are involved in the glutamylation of tubulin in neurons, we prepared primary neurons from Ttll1 −/− and Ttll7 −/− hippocampi and analysed them by immunoblot after 4 days of differentiation (days in vitro 4, DIV4). Similar to what we observed with the brain extracts (Fig 1C), Ttll1 −/− neurons almost entirely lost the polyE signal on α‐tubulin, while Ttll7 −/− neurons selectively lacked β‐tubulin glutamylation as revealed with β‐monoE antibody (Fig 1D). This was confirmed by immunocytochemistry of primary hippocampal neurons: while polyE, but not β‐monoE, labelling was decreased in Ttll1 −/− cells (Fig 1F), a specific loss of β‐monoE signal was observed in Ttll7 −/− neurons, while the polyE signal remained unchanged (Fig 1G). Besides confirming that both TTLL1 and TTLL7 specifically modify α‐ and β‐tubulin in neurons, this result also demonstrated that due to the specificity of these two antibodies (Fig 1C–E), they can be used to selectively detect α‐ and β‐tubulin glutamylation by immunocytochemistry, which was so far not possible.
In summary, TTLL1 and TTLL7 are the two key enzymes that catalyse polyglutamylation in the nervous system, and both enzymes are active in neurons. Under physiological conditions, they show strictly distinct activities: TTLL1 modifies α‐tubulin, while TTLL7 modifies β‐tubulin, and they do not compensate for each other if one of the two enzymes is inactivated. We thus hypothesised that both enzymes control neuronal functions in an independent manner.
Distinct roles of TTLL1 and TTLL7 in Purkinje‐cell degeneration
We have previously demonstrated that an abnormal accumulation of polyglutamylation on both α‐ and β‐tubulin leads to degeneration of various neuronal populations (Magiera et al, 2018). In some brain regions, such as the cerebellum, inactivation of a single deglutamylase, CCP1, was sufficient to induce hyperglutamylation and neurodegeneration. The most striking phenotype of Ccp1 −/− mice is the degeneration of the cerebellar Purkinje cells within the first month of life (Mullen et al, 1976). We and others previously demonstrated that this degeneration can be prevented by the concomitant depletion or deletion of the glutamylase TTLL1 (Rogowski et al, 2010; Berezniuk et al, 2012). Moreover, we showed that the protective effect of TTLL1 loss is a cell‐autonomous mechanism, as deleting TTLL1 selectively in Purkinje cells of Ccp1 −/− mice (Ccp1 −/− Ttll1flox / flox – cre‐L7) fully prevented their degeneration for up to 20 months (Magiera et al, 2018). While these experiments have provided a definitive proof that accumulation of polyglutamylation generated by TTLL1 is the primary cause of the degeneration of Purkinje cells in Ccp1 −/− mice, a direct link with the enzymatic specificity of TTLL1 has not been established.
Having demonstrated that TTLL1 and TTLL7 are the two key enzymes involved in tubulin polyglutamylation in neurons, with each of them catalysing an exclusive subtype of glutamylation (Fig 1), we tested their individual involvements in the degeneration of Purkinje cells in mice lacking CCP1. For this, we generated two combinatorial mouse strains: Ccp1 −/− Ttll1 −/− and Ccp1 −/− Ttll7 −/−. As expected, Purkinje cells of Ccp1 −/− Ttll1 −/− mice were protected from degeneration. By contrast, this was not the case in Ccp1 −/− Ttll7 −/− mice, in which Purkinje cells, like in the Ccp1 −/− mice, are entirely lost (Fig 2A). Moreover, degeneration of Purkinje cells in both Ccp1 −/− and Ccp1 −/− Ttll7 −/− mice appears to follow a similar pattern of degeneration as seen at 25 days after birth, where we observed early signs of degeneration such as partial loss of Purkinje cells and axonal swellings specifically in Ccp1 −/− and Ccp1 −/− Ttll7 −/− mice (Fig 2B). This demonstrates that TTLL1‐catalysed polyglutamylation alone is sufficient to cause the neurodegeneration observed in Ccp1 −/− mice, while TTLL7 appears to play no role in this process.
Figure 2. TTLL1 plays a key role in Purkinje‐cell degeneration and tubulin hyperglutamylation.
-
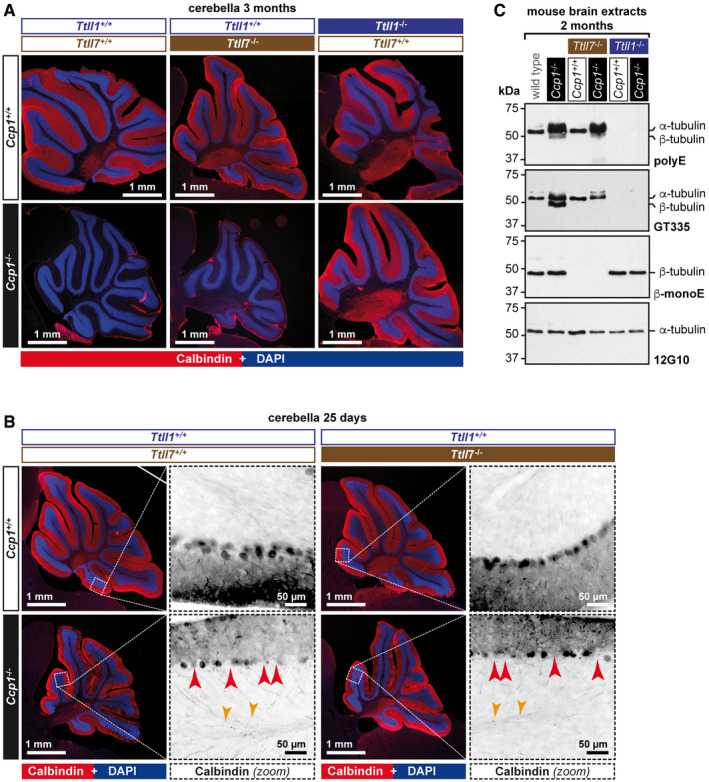
ARepresentative histology images of cerebella from 3‐month‐old mice stained with anti‐calbindin antibody, which specifically labels Purkinje cells (Sequier et al, 1988). Note the presence of an intact Purkinje‐cell layer in cerebella of wild‐type, Ttll1 −/−, Ttll7 −/− and Ccp1 −/− Ttll1 −/− mice, in contrast to the complete absence of these cells in Ccp1 −/− and Ccp1 −/− Ttll7 −/− mice. A complete representation of all analysed cerebella is shown in Fig EV1.
-
BHistology of 25‐day‐old mice with partial degeneration of Purkinje Cells. Note that both Ccp1 −/− and Ccp1 −/− Ttll7 −/− brains show highly similar pattern of partial Purkinje‐cell loss (red arrow heads: gaps in the Purkinje‐cell layer, indicating degenerated Purkinje cells; and orange arrow heads: swellings of Purkinje‐cell axons, indicative of ongoing degeneration).
-
CRepresentative immunoblots of cerebellum extracts of wild‐type, Ccp1 −/−, Ttll7 −/−, Ccp1 −/− Ttll7 −/−, Ttll1 −/− and Ccp1 −/− Ttll1 −/− mice. Loss of CCP1 leads to hyperglutamylation of α‐ and β‐tubulin as revealed with polyE and GT335 antibodies. Concomitant deletion of TTLL7 leads to a loss of glutamylation from β‐tubulin (β‐monoE, GT335), while hyperglutamylation of α‐tubulin persists (polyE, GT335). Concomitant loss of CCP1 and TTLL1 eliminates hyperglutamylation from both α‐ and β‐tubulin (polyE, GT335), while β‐tubulin glutamylation is unaltered (β‐monoE).
Source data are available online for this figure.
Figure EV1. Cerebella from all mice analysed in this study (complement to Fig 2A).
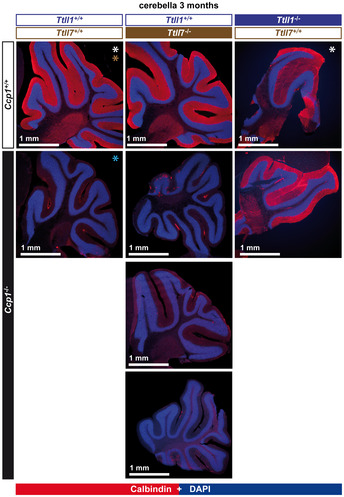
Histology of cerebella from 3‐month‐old mice stained with anti‐calbindin antibody. Note the presence of an intact Purkinje‐cell layer in all cerebella of wild‐type, Ttll1 −/−, Ttll7 −/− and Ccp1−/−Ttll1 −/− mice, in contrast to the complete absence of these cells in Ccp1 −/− and Ccp1 −/− Ttll7 −/− mice (*heterozygous alleles were present in some mice analysed here: Ccp1 +/− (white*); Ttll1 +/− (blue*); and Ttll7 +/− (brown*)).
Source data are available online for this figure.
To understand the changes in polyglutamylation patterns underlying the different impacts of the two glutamylases on neurodegeneration, we analysed cerebella of the different mouse models by immunoblot with our set of glutamylation‐specific antibodies (Fig 1E). The characteristic features of Ccp1 −/− mice are a massive accumulation of polyE‐reactive polyglutamylation, and a strong GT335 signal on β‐tubulin, which is not seen in wild type (Fig 2C; Ccp1 −/−). In Ccp1 −/− Ttll7 −/− brains, the β‐monoE reactivity was completely lost, and GT335 also failed to detect the β‐tubulin band. However, the massive polyE‐reactive hyperglutamylation on α‐tubulin persisted in the absence of TTLL7 (Fig 2C; Ccp1 −/− Ttll7 −/−). This was contrasted by a complete loss of polyE‐ and GT335‐reactive hyperglutamylation on both α‐ and β‐tubulin in Ccp1 −/− mice lacking TTLL1 (Fig 2C; Ccp1 −/− Ttll1 −/−) that had been observed previously (Berezniuk et al, 2012). By contrast, the glutamylation of β‐tubulin at E435, detected with β‐monoE antibody, was similar to wild‐type levels in the cerebella of Ccp1 −/− Ttll1 −/− mice, underpinning the unique role of TTLL7 in the modification of this site.
These results imply that TTLL1 is the sole glutamylase involved in the generation of the abnormally high levels of polyglutamylation observed in mice lacking CCP1, while TTLL7 appears to play no critical role in the generation of hyperglutamylation. Nevertheless, we observed an accumulation of GT335‐reactive β‐tubulin glutamylation in mice lacking CCP1 (Fig 2C; Ccp1 −/−), which initially suggested that TTLL7 could still be involved. However, even the abnormal increase in β‐tubulin glutamylation appears to be dependent on TTLL1, as it was not seen in the Ccp1 −/− Ttll1 −/− mice (Fig 2C; Ccp1 −/− Ttll1 −/−). By demonstrating that TTLL7 alone does not lead to hyperglutamylation in the absence of CCP1, our observations provide the mechanistic background for the dominant role of TTLL1 in the generation of hyperglutamylation that leads to neurodegeneration of the Purkinje cells.
Synergy of TTLL7 and TTLL1 in modifying different sites on β‐tubulin
Analyses using the new β‐monoE antibody revealed that TTLL7 predominantly modifies E435 on β‐tubulin, a glutamylation site that cannot be detected with GT335 (Fig 1E). In brain tissue of Ccp1 −/− mice, however, β‐tubulin is strongly labelled with GT335 (Fig 2C; Ccp1 −/−), indicating that other sites are glutamylated (Fig 1A, yellow residues). Strikingly, the generation of GT335‐reactive glutamylation on β‐tubulin requires TTLL1 and TTLL7, as it is absent in both Ccp1 −/− Ttll1 −/− and Ccp1 −/− Ttll7 −/− brains (Fig 2C). It thus appears that the two enzymes have a synergistic activity. A likely scenario could be that TTLL7 initiates glutamylation on multiple modification sites on β‐tubulin, and in the absence of deglutamylation (Ccp1 −/−), the nascent glutamate chains are elongated by TTLL1, thus stabilising them. In the wild‐type situation, however, the side‐chain elongation is reversed by CCP1, which in turn could also favour the removal of the nascent chains. A similar observation had previously been made with other combinations of glutamylating enzymes: expression of the initiating glutamylase TTLL5 together with elongating enzymes in cultured cells generated much stronger GT335 signals than expression of TTLL5 alone (van Dijk et al, 2007). Therefore, TTLL7, while predominantly modifying E435 of β2‐tubulin in neurons (Fig 1), has the capacity to modify other sites on β‐tubulin in brain, which is however mostly occurring in the absence of CCP1. Indeed, it has previously been demonstrated that recombinant TTLL7 can add more than 20 glutamate residues to a single β‐tubulin molecule (Valenstein & Roll‐Mecak, 2016), most likely to multiple modification sites given the predominant initiating activity of this glutamylase (van Dijk et al, 2007). The restriction of β2‐tubulin glutamylation to mostly E435 in wild‐type brain (Fig 1C), however, suggests that such TTLL7‐mediated hyperglutamylation does not occur under physiological conditions in the nervous system.
A key role of TTLL1‐mediated hyperglutamylation in the degeneration of motor axons
We have so far shown that TTLL1 is the key glutamylase to mediate hyperglutamylation in cerebella of Ccp1 −/− mice and that inactivating TTLL1 can avoid the degeneration of the most emblematic neuron population in this brain region, the Purkinje cells. However, hyperglutamylation can lead to the degeneration of a variety of neurons. In Ccp1 −/− mice, neurodegeneration is found in several other regions of the central nervous system (Greer & Shepherd, 1982; LaVail et al, 1982; O'Gorman, 1985; Ghetti et al, 1987). Moreover, we had recently found a massive degeneration of motor neurons, demonstrating that hyperglutamylation‐induced neurodegeneration also affects the peripheral nervous system (Shashi et al, 2018). We thus focussed on myelinated axons of motor neurons to determine the roles of TTLL1 and TTLL7 in the degeneration of other neuron types.
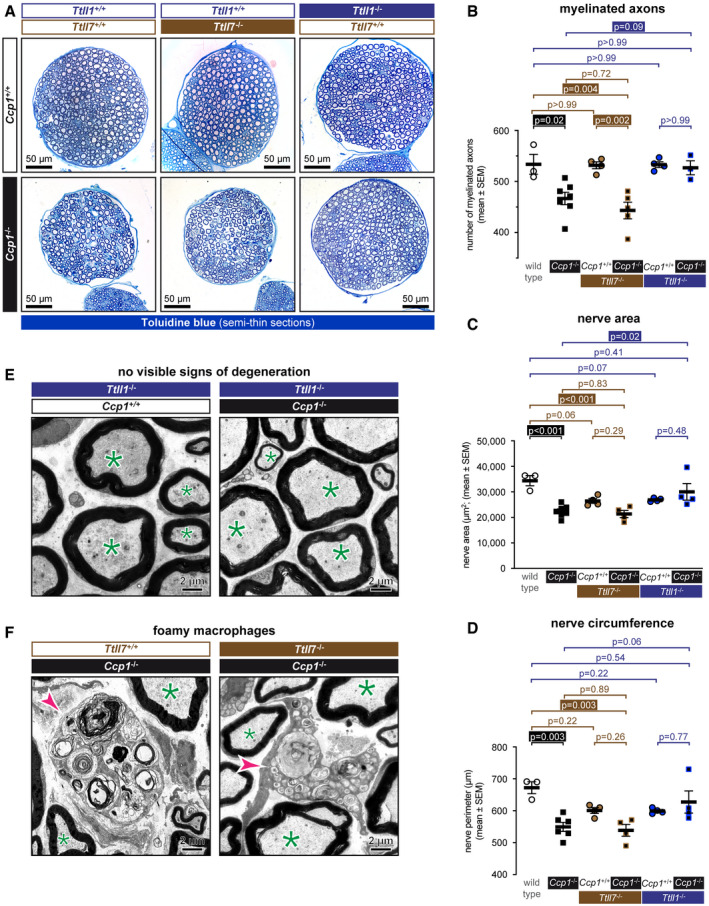
We had previously shown that the femoral quadriceps nerve shows a lower number of myelinated axons in Ccp1 −/− mice (Shashi et al, 2018), indicative of axon degeneration. To determine whether the axonal degeneration is mediated by TTLL1 or TTLL7, we now quantified the same parameter in Ccp1 −/− Ttll1 −/− and Ccp1 −/− Ttll7 −/− mice and the corresponding controls on semithin tissue sections (Fig 3A). In Ccp1 −/− mice, the number of myelinated axons was reduced to 87% relative to wild type, while in Ccp1 −/− Ttll1 −/− mice, 99% of myelinated axons are preserved. In Ccp1 −/− Ttll7 −/− mice, by contrast, the number of myelinated nerves had dropped to 83% of the numbers obtained in wild‐type and Ccp1 −/− Ttll1 −/− mice (Figs 3B and EV2).
Figure 3. TTLL1‐mediated polyglutamylation is responsible for the degeneration of motor axons.
-
ASemithin cross sections of femoral quadriceps nerves stained with alkaline methylene blue. Note the smaller size of Ccp1 −/− and Ccp1 −/− Ttll7 −/− nerves.
-
B–DSections from (A) were quantified for (B) number of myelinated axons, (C) nerve area (D) and nerve perimeter (Fig EV2) of femoral quadriceps nerves from wild‐type, Ccp1 −/−, Ttll7 −/−, Ccp1 −/− Ttll7 −/−, Ttll1 −/− and Ccp1 −/− Ttll1 −/− mice. Scatter dot plots in which each point represents one nerve of an individual mouse are shown. The black lines indicate means ±SEM. Significance was tested with one‐way ANOVA and Holm–Šídák’s multiple comparison test. Note that all three parameters are decreased for Ccp1 −/− and Ccp1 −/− Ttll7 −/− mice, while Ccp1 −/− Ttll1 −/− mice showed no difference to the Ttll1 −/− control.
-
E, FRepresentative electron microscopy images of cross sections of femoral quadriceps nerves. (E) Nerves from Ttll1 −/− and Ccp1 −/− Ttll1 −/− mice show no abnormalities of myelinated axons (green asterisks), indicating that loss of TTLL1 prevents axonal degeneration caused by the absence of CCP1. (F) Ccp1 −/− and Ccp1 −/− Ttll7 −/− mice both show the presence of foamy macrophages (magenta arrowheads), which are signs for myelin phagocytosis during axon degeneration. This indicates that loss of TTLL7 cannot prevent the CCP1‐induced degeneration of femoral quadriceps nerves.
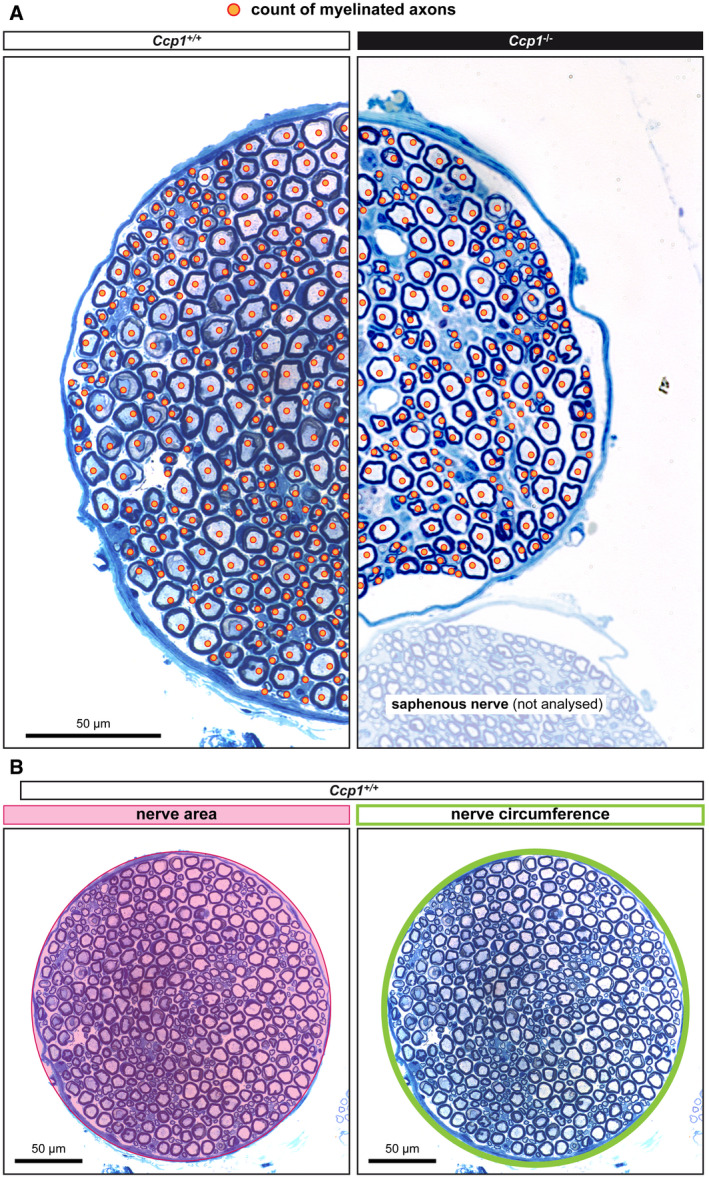
Figure EV2. Measure paradigm of femoral quadriceps nerve parameters (complement to Fig 3A–D).
-
ARepresentative example of how myelinated axons, identified by orange spots, were counted. Axons of all calibres were counted.
-
BThe surface and the circumference of nerves was measured as indicated.
As a complementary measure, we also compared the perimeter and area of femoral quadriceps nerves of the six different mouse strains. Ccp1 −/− mice showed a significant reduction of the nerve perimeter to 80% and of the nerve area to 65% of the wild‐type values, thus clearly confirming the degeneration of the Ccp1 −/− nerves. Ccp1 −/− Ttll7 −/− mice showed parameters similar to Ccp1 −/−, thus confirming that degeneration was not prevented. By contrast, Ccp1 −/− Ttll1 −/− nerves showed values similar to their Ttll1 −/− control, confirming the rescue of degeneration (Fig 3C and D). Despite having normal numbers of myelinated axons comparable to wild‐type mice (Fig 3B), nerve size for Ttll7 −/− and Ttll1 −/− mice was also smaller than in wild type (Fig 3C and D). This suggests that loss of polyglutamylation by either TTLL1 or TTLL7 might affect the axon calibre thus leading to a smaller femoral quadriceps nerve, but does not lead to degeneration given the unchanged number of myelinated axons (Figs 3B and EV2).
Together, these results demonstrate that axons of the femoral quadriceps nerve in Ccp1 −/− mice are protected from hyperglutamylation‐induced degeneration by inactivation of TTLL1, but not TTLL7 (Fig 3A–D). This conclusion is supported by ultrastructural analyses of femoral quadriceps nerves, which revealed normal myelinated fibres in nerves from Ttll1 −/− and Ccp1 −/− Ttll1 −/− mice (Fig 3E), while foamy macrophages, which are signs of myelin phagocytosis that typically appear in Wallerian‐like degeneration and mouse models of inherited neuropathies (Groh et al, 2012; Klein & Martini, 2016), were found in both Ccp1 −/− and Ccp1 −/− Ttll7 −/− mice (Fig 3F).
This demonstrates that similar to Purkinje cells in the cerebellum, peripheral nerves degenerate as a result of hyperglutamylation generated by the polyglutamylase TTLL1, but not from TTLL7‐mediated glutamylation. It thus appears that hyperglutamylation‐induced neurodegeneration in the absence of efficient deglutamylation is consistently induced by TTLL1 in the central and the peripheral nervous system and can be avoided by inactivating this enzyme.
Selective control of mitochondrial transport by TTLL1
We and others had previously shown that hyperglutamylation generated upon deactivation of the deglutamylase CCP1 leads to the reduction of mitochondria motility in mouse primary hippocampal neurons (Magiera et al, 2018; Bodakuntla et al, 2020b), as well as in cerebellar granule neurons (Gilmore‐Hall et al, 2019). Mitochondria movement is commonly used to assess axonal transport and its potential defects (Niwa et al, 2013; Sorbara et al, 2014; Guo et al, 2017; Sleigh et al, 2019). Our observations together with past reports of accumulation of intracellular material and organelles, reminiscent of intracellular transport defects, in degenerating neurons of pcd (Ccp1 −/−) mice (Landis & Mullen, 1978), thus suggested that perturbations of axonal transport could be linked to hyperglutamylation‐induced neurodegeneration.
Having observed that inactivation of TTLL1 in Ccp1 −/− mice prevented Purkinje cells from degeneration, while knockout of TTLL7 did not have this neuroprotective effect, prompted us to ask whether these two glutamylases could have distinct roles in controlling axonal transport. To answer this question, we measured the motility of mitochondria in primary hippocampal neurons from Ttll1 −/− and Ttll7 −/− mice. At DIV4, the time point at which we analyse axonal transport, Ttll1 −/− neurons entirely lack α‐tubulin polyglutamylation, and Ttll7 −/− neurons are void of β‐tubulin glutamylation (Fig 1D).
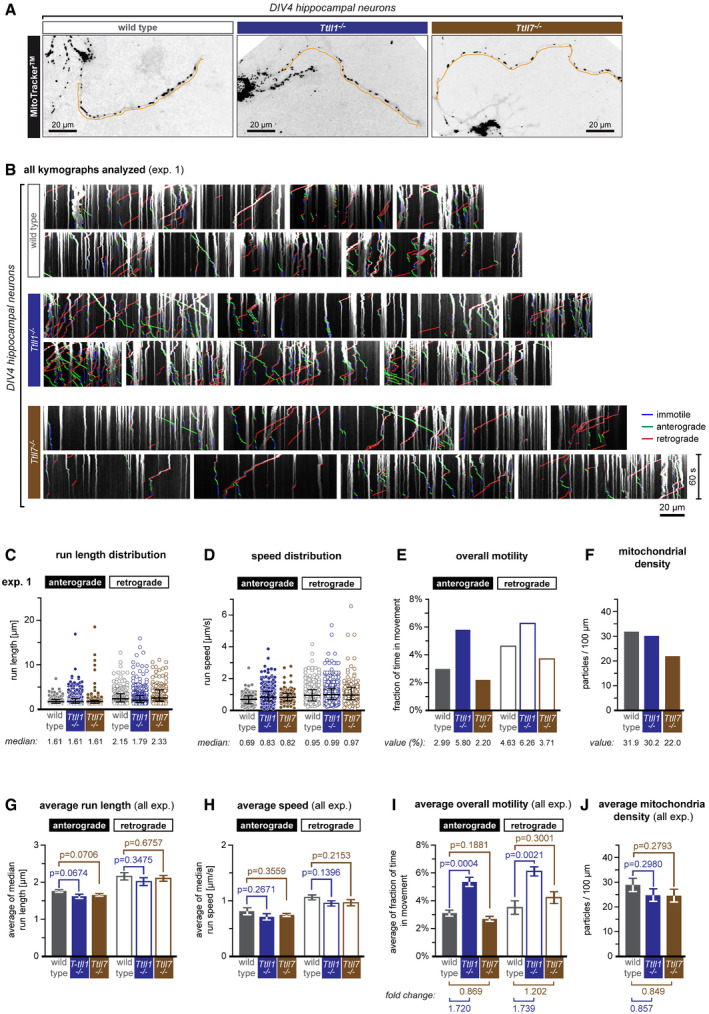
To determine mitochondria movements, we visualised them with MitoTracker™ and recorded in the longest neurites (Fig 4A and B, Movie [Link], [Link]). At least six neurons of each genotype were imaged per experiment. Mitochondria movements were analysed separately for each experiment following our established protocol (Figs 4B–F and EV3) (Magiera et al, 2018; Bodakuntla et al, 2020a; Bodakuntla et al, 2020b), and average parameters were calculated from all experiments (Fig 4G–J). While both average run length (Fig 4G) and speed (Fig 4H) of mitochondria were unaltered in axons of Ttll1 −/− and Ttll7 −/− neurons, we found an almost twofold increase of overall motility in Ttll1 −/− neurons. By contrast, no significant difference in overall mitochondria motility was detected in Ttll7 −/− neurons (Fig 4I). Numbers of mitochondria were similar in wild‐type, Ttll1 −/− and Ttll7 −/− neurons (Fig 4J).
Figure 4. Glutamylation patterns generated by TTLL1 and TTLL7 have distinct effects on mitochondria motility in axons.
- A
- B
-
C–FAnalysis of one single experiment shown in (B). Scatter dot plots of (C) run length and (D) speed distributions, where each point represents a single run extracted from the kymographs shown in (B). The black lines indicate the median of the distribution, with whiskers at interquartile range. Numerical values of medians are indicated below each plot. (E) A bar graph showing the overall motility of mitochondria (the fraction of time mitochondria spent in movement relative to the total number of mitochondria during the recording time of 60 s). (F) A bar graph showing mitochondrial density in analysed axons. Values of the overall motilities and mitochondrial densities are given below the bar plots.
-
G–JStatistical analyses of mitochondrial transport parameters of five independent experiments shown in (D–G and Fig EV3A–D). Each bar represents the mean (±SEM) of medians of single experiments for (G) run length and (H) speed distributions, and average (±SEM) (I) overall mitochondrial motility and (J) density of all five experiments. Values of fold change between control and Ttll1 −/− and Ttll7 −/− conditions are indicated below the graphs. Full bars are for anterograde, and empty bars for retrograde transport events. Significance was tested using unpaired t‐test. Average (G) run length as well as (H) speed showed no significant differences between control and Ttll1 −/− and Ttll7 −/− conditions. (I) The averages of overall motilities reveal an about 1.7‐fold increase in overall mitochondrial motility in Ttll1 −/− neurons, while no significant differences were found in Ttll7 −/− neurons. (J) Mitochondrial density was unaltered between control and knockout conditions. Total number of mitochondria analysed from five independent experiments: control (1,260), Ttll1 −/− (1,158) and Ttll7 −/− (1,191). For further statistical data on transport analyses, see Appendix Table S2.
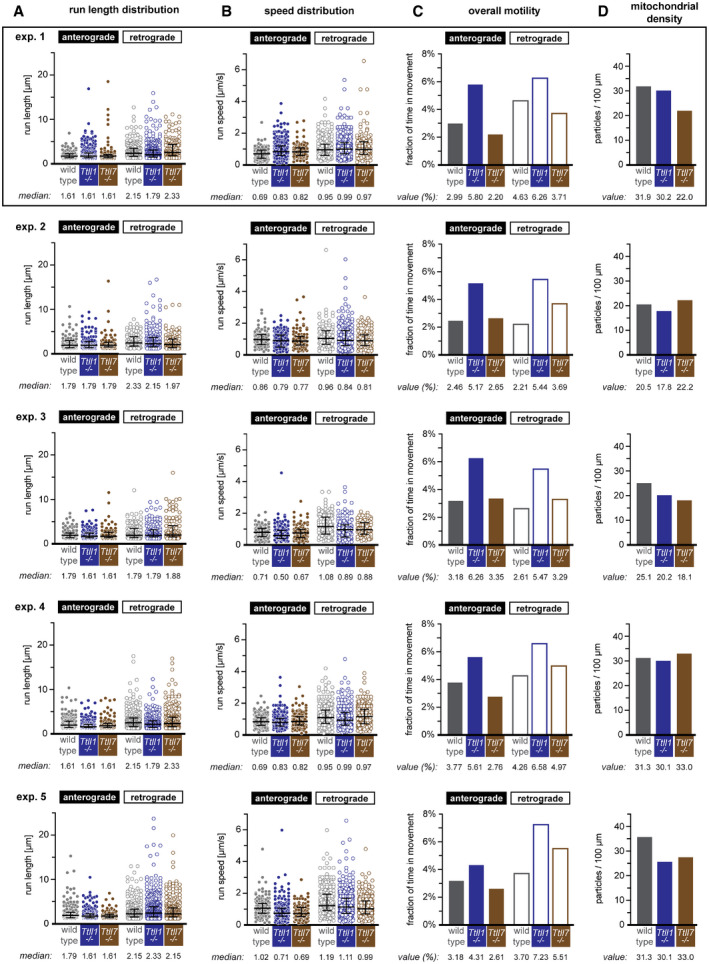
Figure EV3. Analyses of mitochondrial transport in wild‐type, Ttll1 −/− and Ttll7 −/− primary hippocampal neurons (complement to Fig 4).
-
A, BScattered dot plots of (A) run length and (B) speed measurements, where each point represents a single particle movement without change in direction or speed (run). The black lines indicate the median of the distribution, with whiskers at interquartile range. The numerical values of the medians are shown below each plot.
-
CBar graphs of the overall motility (fraction of time mitochondria spent in movement relative to the total number of mitochondria present during the recording time of 60 s). Values for single experiment are shown below plots.
-
DBar graphs of mitochondria densities (values are shown below plots).
How polyglutamylation affects mitochondria motility remains an open question. Given that neither run length nor speed is altered, it is unlikely that the molecular motors are directly affected. Indeed, first in vitro analyses showed that the motility of neither of the two key motors that drive mitochondria transport, dynein and kinesin‐1 (Sheng & Cai, 2012), is strongly affected by polyglutamylation of their microtubule tracks (Sirajuddin et al, 2014). By contrast, the observation that polyglutamylation changes overall motility of mitochondria hints towards a mechanism that affects the initiation of their movements. This could be either related to microtubule docking, a process mediated by syntaphilin (Kang et al, 2008), by altered binding of the kinesin adapter protein TRAK1 (Milton) (Stowers et al, 2002) to microtubules (Henrichs et al, 2020) or by the presence of road blocks formed from microtubule‐associated proteins (MAPs) (Vershinin et al, 2007; Dixit et al, 2008; Monroy et al, 2018; Siahaan et al, 2019; Tan et al, 2019; Deniston et al, 2020).
Notwithstanding the underlying molecular mechanisms, it appears that polyglutamylation generated by TTLL1 can specifically tune the overall motility of mitochondria in neurons, while TTLL7‐mediated glutamylation has no impact. Together with our observation that accumulation of polyglutamylation in Ccp1 −/− mice, which leads to a decrease of overall mitochondria motility (Magiera et al, 2018; Bodakuntla et al, 2020b), is mediated by TTLL1, and not by TTLL7 (Fig 2C), this suggests that TTLL1‐mediated polyglutamylation acts as a rheostatic regulator of mitochondria motility. Given that several other axonal cargoes are also affected by hyperglutamylation in Ccp1 −/− hippocampal neurons (Bodakuntla et al, 2020b), it is possible that they are also controlled by TTLL1‐mediated polyglutamylation.
While a causative link between the transport defects and the degeneration of Ccp1 −/− neurons has so far not been established, our finding that mitochondria are more motile in Ttll1 −/− neurons suggests that the rescue of hyperglutamylation‐mediated neurodegeneration by knockout of TTLL1 is linked to a recovery of the reduced axonal transport in these neurons. By contrast, inactivation of TTLL7 might fail to protect Purkinje cells and peripheral motor neuron axons from degeneration in Ccp1 −/− mice because TTLL7‐mediated glutamylation does not affect mitochondria motility and thus cannot rescue transport defects.
Discussion
Regulation of the microtubule cytoskeleton by tubulin PTMs holds the potential of selectively controlling the multiple molecular interactions that take place on microtubules. This regulation at the molecular level is expected to control and coordinate microtubule functions at the cellular level, thereby assuring homeostasis at the tissue and organism level. Polyglutamylation is a PTM that progressively accumulates in neurons during differentiation (Audebert et al, 1993; Audebert et al, 1994), and is kept in check by a balance between glutamylases and deglutamylases (Fig 5A). Loss of deglutamylases has been shown to cause abnormal accumulation of polyglutamylation in neurons, which ultimately leads to their degeneration (Rogowski et al, 2010; Magiera et al, 2018; Shashi et al, 2018). The fact that this degeneration could be specifically avoided for cerebellar Purkinje cells by deleting one of the main polyglutamylases in brain, TTLL1 (Berezniuk et al, 2012; Magiera et al, 2018), demonstrated that unopposed polyglutamylation was the cause of degeneration. However, it did not reveal the potential role of other polyglutamylases in this process, nor whether TTLL1 and/or other glutamylases play the same role in other degenerating neuronal types.
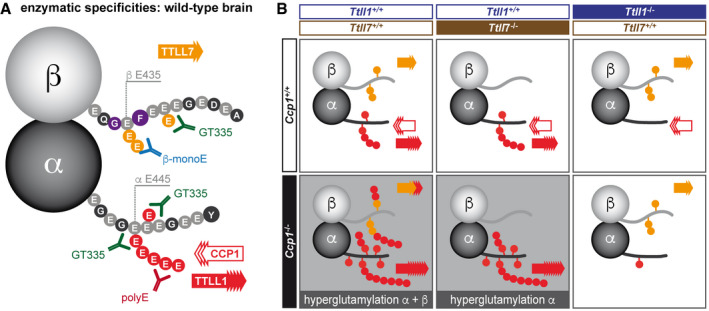
Figure 5. Schematic representation of the enzymatic mechanism of polyglutamylation in brain.
-
ARepresentation of the differential glutamylation of α‐ and β‐tubulin and which epitopes can be detected by the glutamylation‐specific antibodies used in this study. The most prominent tubulin isotypes in brain, α1‐ and β2‐tubulin are shown with their C‐terminal tails represented as amino acid sequences. The main modification sites, glutamates (E) 445 on α1‐tubulin (Eddé et al, 1990) and E435 on β2‐tubulin (Rüdiger et al, 1992) are indicated. However, all glutamate residues in these C‐terminal tails (light grey circles) could potentially be glutamylated. Glutamylation generated by TTLL1 is colour‐coded red, while TTLL7‐catalysed glutamylation is orange. Note that under wild‐type conditions, TTLL1 and TTLL7 exclusively modify α‐ and β‐tubulin, respectively, in brain tissue.
-
BRepresentation of glutamylation patterns found in the knockout mouse models studied here, and interpretation of the participation of the TTLL1, TTLL7 and CCP1 in their generation. Based on the immunoblot analysis shown in Fig 2C, it can be deduced that TTLL1 is able to hyperglutamylate both α‐ and β‐tubulin in the absence of CCP1. By contrast, loss of CCP1 in the absence of TTLL1 does not lead to hyperglutamylation, suggesting that TTLL7 is not sufficient to generate this phenotype. In this context, our observation that hyperglutamylation of β‐tubulin is abolished with TTLL7 indicates that while TTLL1 can hyperglutamylate β‐tubulin, it requires prior glutamylation by TTLL7 to do so. We thus conclude that TTLL1 specifically elongates nascent glutamate chains generated by TTLL7.
In the current work, we revealed that the two main polyglutamylases in the nervous system, TTLL1 and TTLL7, generate strictly distinct patterns of polyglutamylation on the neuronal microtubules under physiological conditions. Our analyses in knockout mice further showed that the vast majority of tubulin polyglutamylation in the nervous system is catalysed by these two enzymes, which is surprising given that several other glutamylases are also expressed in the brain (Bodakuntla et al, 2020b). Strikingly, in contrast to TTLL1, TTLL7 does not participate in the generation of hyperglutamylation in mice lacking CCP1 (Fig 5B), and consequently, the deletion of TTLL7 in Ccp1 −/− mice does not prevent degeneration of Purkinje cells. We further show that the degeneration of peripheral nerves can be avoided by deleting TTLL1, but not TTLL7, revealing that TTLL1 might be the key enzyme responsible for hyperglutamylation in the variety of neurodegenerative phenotypes found in mouse models or patients that carry mutations in deglutamylating enzymes (Magiera et al, 2018; Shashi et al, 2018).
We further demonstrate that TTLL1 has a specific function at the subcellular level: the control of the efficiency of mitochondria transport. Loss of TTLL1 leads to an increase of mitochondria motility, while lack of TTLL7 had no impact. This finding is intriguing in the light of our observation that TTLL1, but not TTLL7, causes hyperglutamylation in Ccp1 −/− neurons, which had previously been demonstrated to cause a reduction in mitochondria motility (Magiera et al, 2018; Gilmore‐Hall et al, 2019; Bodakuntla et al, 2020b). It thus appears that TTLL1‐mediated polyglutamylation specifically affects the efficiency of mitochondria motility in neurons, and does so in a rheostat‐like manner. TTLL7, which has no impact on mitochondria motility, might affect other microtubule functions. For instance, it could regulate the transport of other axonal cargoes, the binding of subsets of MAPs to microtubules, as well as microtubule severing. Indeed, TTLL7‐mediated glutamylation had been shown to regulate spastin‐mediated severing in a rheostatic manner (Valenstein & Roll‐Mecak, 2016). While the role of TTLL7 in controlling microtubule severing in vivo remains to be demonstrated, the picture that emerges is that TTLL1 and TTLL7 could control microtubule functions in an independent manner, probably uniquely based on the different modification patterns they generate. That neither deletion of TTLL7 nor of spastin (Magiera et al, 2018) could avoid degeneration of Purkinje cells might thus be taken as an indication that perturbed microtubule severing cannot cause the degeneration of neurons with hyperglutamylation. By contrast, the distinctive role of TTLL1 in controlling mitochondria traffic together with its unique role in neurodegeneration provides support for the hypothesis that perturbation of axonal transport could be one causative factor for the degeneration of neurons with hyperglutamylation. Given that many human neurodegenerative disorders have been linked to perturbations in axonal transport (Millecamps & Julien, 2013; Brady & Morfini, 2017; Beijer et al, 2019; Sleigh et al, 2019), our findings emphasise that perturbations of polyglutamylation could be a promising underlying mechanism of neurodegeneration that has so far not been fully explored.
By further demonstrating that deletion of the glutamylase TTLL1 did prevent not only the characteristic and rapid degeneration of cerebellar Purkinje cells in Ccp1 −/− mice, but also the more recently discovered progressive degeneration of motor neurons (Shashi et al, 2018), we provide evidence for the notion that the mechanisms underlying hyperglutamylation‐induced neurodegeneration are similar in the entire nervous system. The broad validity of these mechanisms makes polyglutamylation a promising target in neurodegeneration research. The demonstration how different glutamylating enzymes, by generating distinct patterns of polyglutamylation on neuronal microtubules, selectively control subcellular and physiological functions provides a molecule‐to‐organism validation of the tubulin code hypothesis. It also opens an exciting prospect of specifically modulating physiological outcomes by targeting distinct polyglutamylation enzymes.
Materials and Methods
Mouse lines
All the C57BL/6N animals in this study were used in accordance with the recommendations of the European Community (2010/63/UE). Experimental procedures were specifically approved by the ethics committee of the Institut Curie CEEA‐IC #118 (authorisation no. 04395.03 given by National Authority) in compliance with the international guidelines. Embryos and mice, both male and female, were used for the analyses.
C57BL/6NTac‐Ttll1tm1a(EUCOMM)Wtsi /IcsOrl mice were generated at PHENOMIN‐ICS (Institut Clinique de la Souris, Illkirch, France; www‐mci.u‐strasbg.fr) with an ES‐cell clone from EUCOMM (www.mousephenotype.org/data/alleles/MGI:2443047/tm1a(EUCOMM)Wtsi).
The Ttll7 tm1Ics conditional mutant mouse line was established at the ICS. The targeting vector was constructed as follows: A 705‐bp fragment encompassing exon 7 (ENSMUSE00000224794) was amplified by PCR (from BAC RP24‐70J13 genomic DNA) and subcloned in an MCI proprietary vector. This MCI vector contains a LoxP site as well as a floxed and flipped Neomycin resistance cassette. A 2.3‐kb fragment corresponding to the 3′ homology arm and 3.7‐kb fragment corresponding to the 5′ homology arms were amplified by PCR and subcloned in step 1 plasmid to generate the final targeting construct.
The linearised construct was electroporated in C57BL/6N mouse embryonic stem (ES) cells (ICS derived line BD10). After selection, targeted clones were identified by PCR using external primers and further confirmed by Southern blot with a Neo probe (5′ and 3′ digests) as well as a 3′ external probe.
Two positive ES clones were injected into BALB/cN blastocysts. Resulting male chimeras were bred with Flp‐deleter C57Bl/6N females that show maternal contribution (Birling et al, 2012). Germline transmission of the conditional allele was obtained.
Genotyping
For adult mice, DNA was extracted from ear fragments collected during the identification of mice or from tail fragments using lysis buffer (0.1 M Tris–HCl pH 8 (Sigma #T1503), 0.2 M NaCl (Sigma #S3014), 5 mM EDTA (Euromedex #EU0007‐C) and 0.4% SDS (Euromedex #EU0660)) containing 0.1 mg/ml proteinase K (#193504, MP Biomedicals). Lysis buffer with proteinase K was added to the sample and incubated at 56°C for 4 h or overnight. After the digestion, the proteinase K was inactivated by boiling the sample at 95°C for 10 min. For hippocampal neuron cultures, a piece of the brain tissue from E17.5 embryos collected during the dissection of hippocampi was lysed using REDExtract‐N‐Amp™ Tissue PCR Kit (Sigma #XNAT) using the manufacturer’s instructions. PCR‐based genotyping was used to analyse the samples. All the primers and protocols used for genotyping are described in Appendix Fig S1.
Sequence comparison and antibody epitope analyses
The sequence for all human tubulin isotypes was aligned using Clustal X software. Sequences are TUBA1A (NP_006000), TUBA1B (NP_006073), TUBA1C (NP_116093), TUBA3C (NP_005992), TUBA3D (NP_525125), TUBA3E (NP_997195), TUBA4A (NP_005991), TUBA8 (NP_061816), TUBB1 (NP_110400), TUBB2A (NP_001060), TUBB2B (NP_821080), TUBB3 (NP_006077), TUBB4A (NP_006078), TUBB4B (NP_006079), TUBB5 (NP_821133), TUBB6 (NP_115914) and TUBB8 (NP_817124). Only C‐terminal tail regions were shown to compare potential glutamylation sites. GT335 is expected to detect all glutamylation events on glutamate (E) residues with a subsequent acidic amino acid residue (glutamate—E, aspartate—D) in the primary sequence (Wolff et al, 1992). All residues fulfilling these criteria are labelled in yellow. A specific glycine–glutamate–phenylalanine (GEF) motif known to be modified in β2‐tubulin (TUBB2) (Rüdiger et al, 1992), highlighted in red and purple, is exclusively present on TUBB2 and TUBB4 isotypes.
Peptide synthesis and antibody production
The sequence for the C‐terminal tail peptide of β2‐tubulin was designed with glutamylation on the amino acid residues that are found to be highly modified in the brain tissue (Rüdiger et al, 1992) (Fig 1B). Standard peptide synthesis protocol was used to generate peptides with monoglutamylated side chain on glutamate 435 (Fig 1B). The peptide was purified by high‐performance liquid chromatography (HPLC; Peptide Specialty Laboratory) and coupled to keyhole limpet haemocyanin. Antibodies against the peptide were raised in rabbits (Pettingill Technology). For purification, 3 mg of the modified peptide was covalently linked to an NHS‐activated sepharose column (#GE17‐0716‐01; Sigma‐Aldrich) as per the manufacturer’s protocol. The rabbit serum was centrifuged at 90,000× g for 30 min at 4°C to remove any cell debris, filtered with a 0.2‐µm syringe filter (#16532; Sartorius) and loaded onto the affinity column. After washing with ˜20 ml of PBS, the antibodies were eluted with 100 mM glycine‐HCl, pH 2.3, which is immediately neutralised to pH 8.0 with 1 M glycine, pH 9.0. The purified antibody was subsequently dialysed against 3 × 1 l PBS at 4°C. The concentration of the antibody was estimated with the Pierce BCA protein assay kit (#23225; Life Technologies).
Sample preparation and immunoblotting
Mice of desired genotype and age were sacrificed by cervical elongation, and brain tissue was immediately dissected. Primary hippocampal neurons cultured from wild‐type, Ttll1 −/− and Ttll7 −/− embryos were collected in 2× Laemmli buffer: 180 mM DTT (Sigma #D9779), 4% SDS (VWR #442444H), 160 mM Tris–HCl pH 6.8, 20% glycerol (VWR #24388.295), bromophenol blue, at DIV4. Brain samples were also collected in 2× Laemmli buffer and homogenised using an Eppendorf tube potter. The samples were boiled at 95°C for 5 min, spun down at 15,000× g for 5 min using a table top centrifuge and stored at −20°C. Samples were ran on SDS–PAGE gels allowing to separate α‐ and β‐tubulin (Magiera & Janke, 2013) and transferred onto a nitrocellulose membrane using Bio‐Rad Trans‐Blot® Turbo system, according to the manufacturer’s instructions. The membranes were blocked in 5% skimmed milk prepared in 1× TBST (Tris‐buffered saline containing 0.1% Tween 20 (VWR #0777)) and incubated with desired primary antibodies for 2 h (see Appendix Table S1 for dilutions). Chemiluminescence signal on the membrane was revealed using Clarity™ Western ECL Substrate (Bio‐Rad #1705060) solution.
Mouse hippocampal neuron cultures
Wild‐type, Ttll1 −/− and Ttll7 −/− hippocampal neurons were prepared on the same day, and axonal transport was measured in different neurons on the same day. To this end, single‐embryo cultures from crosses of heterozygous parents (Ttll1 +/− × Ttll1 +/− and Ttll7 +/− × Ttll7 +/− ) were performed to obtain wild‐type, Ttll1 −/− (reduced polyglutamylation on α‐tubulin) and Ttll7 −/− neurons (reduced polyglutamylation on β‐tubulin). Hippocampal neurons were cultured according to standard protocols described earlier (Kaech & Banker, 2006; Bodakuntla et al, 2020a). Briefly, pregnant mice at 17.5 days of gestation were sacrificed by means of cervical elongation. The embryos were rapidly decapitated, and the hippocampi from each embryo were collected in separate tubes. Meanwhile, a small piece of embryo’s brain tissue was collected and genotyped. Hippocampi were enzymatically and mechanically dissociated and passed through a 70‐µm cell strainer to obtain single cell suspension of neurons. Based on the genotyping results, wild‐type, Ttll1 −/− and Ttll7 −/− neurons were counted and plated on a poly‐D‐lysine (#354210, Corning)‐coated support, depending on the application. Neurons were plated on coverslips for immunocytochemistry, on plastic dishes for immunoblot analysis and glass‐bottom dishes (#81158, Ibidi) for live cell imaging (transport analysis).
Immunocytochemistry
Neurons were fixed at DIV4 using a previously described protocol (Magiera & Janke, 2013), which allows to maintain macromolecular structures, such as microtubules, inside fixed cells. Fixed cells were blocked with 10% horse serum in PBS for 30 min at room temperature. Then, they were incubated in the presence of primary antibodies (see Appendix Table S1 for dilutions) in phosphate‐buffered saline (PBS; 10 mM Na2HPO4, 1.8 mM KH2PO4, pH 7.4, 137 mM NaCl, 2.7 mM KCl), containing 0.1% Triton X‐100 for 1 h at room temperature, washed four times with PBS‐0.1% Triton X‐100 and 3% bovine serum albumin (BSA), and incubated with secondary antibodies and DAPI (1 µg/ml) for 1 h at room temperature. Following five washes, cells were mounted on microscopy slides using the ProLong™ Gold antifade reagent (#P36934, Life Technologies). Cells were imaged on the Leica DM6000B microscope, and images were analysed and adjusted using the ImageJ software.
Transcardial perfusion
Animals were anaesthetised using ketamine (Imalgène®, 80–100 mg/ml)/xylazine (Rompun®, 5–10 mg/ml) and transcardially perfused first with PBS followed by 4% PFA (diluted from 32% EM grade, #15714, EMS) in phosphate buffer (PB; 0.1 M Na2HPO4/NaH2PO4 pH 7.4). For electron microscopy, the fixative used was 2% PFA and 2% glutaraldehyde (25% EM grade, #16216, EMS) in PB or in CaCo buffer (0.1 M Cacodylate (#15540.03, Serva)/HCl pH 7.4). Organs were then dissected and post‐fixed in the 2% PFA in PB or CaCo buffer overnight at 4°C and then washed three times in PB or CaCo buffer.
Immunohistochemistry
Organs were cryoprotected in 30% sucrose, then embedded in Tissue‐Tek® O.C.T. (#4483; Sakura Finetek) and frozen on dry ice. The tissue was then cut sagittally in 40‐µm floating sections. Immunostaining was performed by incubating the sections with the antibody (see Appendix Table S1 for dilutions). Sections were imaged on the Leica DM6000B microscope, and images were analysed and adjusted using Adobe Photoshop.
Electron microscopy
Femoral nerves were dissected from paraformaldehyde/glutaraldehyde‐perfused four‐ to six‐month‐old wild‐type, Ccp1 −/−, Ttll1 −/−, Ttll7 −/−, Ccp1 −/− Ttll1 −/− and Ccp1 −/− Ttll7 −/− mice, osmicated and then embedded in epoxy resin according to published protocols (Groh et al, 2012). Blocks were cut into semithin sections (0.5 µm) and ultrathin sections (80 nm). Semithin section were stained with alkaline methylene blue and analysed by light microscopy using an Axiophot 2 microscope (Zeiss) equipped with a CCD camera (Visitron Systems). Ultrathin sections were counterstained with lead citrate for electron microscopy.
Electron micrographs were taken by a ProScan Slow Scan CCD camera (ProScan) mounted to a Leo 906 E electron microscope (Zeiss). For quantification of axonal loss, total numbers of myelinated axons were counted on composed electron micrographs of femoral quadriceps nerve cross sections. Statistical analyses were performed using one‐way ANOVA and Holm–Šídák's multiple comparison test.
Imaging of axonal transport
Transport assays and analysis paradigms used in the study were designed following established approaches (Ghiretti et al, 2016; Klinman & Holzbaur, 2016) and have been described earlier (Bodakuntla et al, 2020a). Briefly, neurons at DIV4 were incubated with 2 nM MitoTracker™ Red CMXRos (Thermo Fisher #M7512) for 1 min in the cell culture incubator and were washed once with conditioned medium (medium from untreated wild‐type neurons). Mitochondria movements in the axon (longest neurite) were imaged using a Nikon Ti‐E spinning disc inverted confocal laser microscope equipped with a 60× oil‐immersion objective (N.A. 1.40) and an ORCA‐Flash 4.0 camera (Hamamatsu) at 2 × 2 binning and operated through Leica MM AF imaging software. Mitochondria movements were imaged every 300 ms for 1 min in stream mode, with the imaging chamber set at 37°C and 5% CO2. A total of at least six neurons were images per treatment group, without exceeding 30 min of imaging time per each microscope dish.
Quantification of axonal transport
All transport analyses procedures were described in detail earlier (Bodakuntla et al, 2020a). Briefly, the analyses were performed using ImageJ 1.47v equipped with KymoToolBox plugin (Zala et al, 2013) (available upon request from F. Cordelières, Bordeaux Imaging Center, France). Mitochondria movements in the axon were converted into kymographs calibrated in x‐axis (distance in µm) and y‐axis (time in seconds). The trajectories of the movements were manually traced and divided in to individual runs, where a “run” is defined as an uninterrupted movement of mitochondria without changes in its speed or direction. The plugin generates a coloured kymograph where anterograde runs are shown in green, retrograde runs in red and immotile trajectories in blue. Runs travelling with speeds lower than 0.10 µm/s or a distance lower than 0.9 µm (equivalent to 5 pixels and average size of the mitochondria) were considered immotile.
Mitochondria density is calculated as the number of mitochondria per length of the axon. For each experiment, medians of the run length and run speed distributions were calculated. The “average run length” and “average run speed” were determined by calculating the mean of the respective median values from all experiments. Overall motility is calculated as the fraction of time mitochondria spent in movement during the entire imaging time. A 100% motility of mitochondria means that all particles were in movement for the whole duration of the observation time (60 s). The “average overall motility” and “average mitochondria density” were determined by calculating the mean of the respective values from all the experiments.
Statistical analyses of mitochondrial transport data
Run length and run speed of a single experiment were plotted as scatter dot plots, where the horizontal line in the distribution graph indicates the median value with whiskers at interquartile ranges (25th and 75th percentiles) (Fig 4). Overall motility or the fraction of time spent in movement and the particle density in the axon were calculated for each experiment and are shown as bar graphs (Figs 4E and F, and EV3C and D). These analyses were repeated for five independent experiments. Median values for run length and run speed distributions were averaged from all the experiments and shown as bar graphs of mean ±SEM. Particle densities and overall motility calculated in individual experiments were averaged and shown as bar graphs of mean ± SEM. Statistical significance was tested using unpaired multiple t‐tests, and P values for the comparisons were given in the respective graphs. All the numerical values used for the transport analysis are given in Appendix Table S2.
For statistical analyses of transport parameters, values for run length and speed of a single experiment were represented as scatter plots with a line indicating a median and whiskers at interquartile ranges (25th and 75th percentiles; Figs 4C and D, and EV3A and B). Fraction of time spent in movement (overall motility) and particle density in the axon were calculated and represented as bar graphs. Five independent experiments were performed. Medians of the run length and speed distributions from all the experiments were averaged and shown as bar graphs of mean ± SEM. Statistical significance was tested using unpaired Student’s t‐test. Particle densities and overall motility calculated in individual experiments were averaged and shown as bar graphs of mean ± SEM. Statistical significance was tested using unpaired multiple t‐tests in the Prism 8 software, and P values for the respective comparison are given above the graphs. All the numerical values used for the quantification of axonal transport are shown in Appendix Table S2.
Author contributions
Conceptualisation: SB, RM, CJ and MMM. Formal analysis: SB, XY, MG, DK, RM, CJ and MMM. Investigation: SB, XY, MG, SG, SL and MMM. Resources: SG and M‐CB. Writing—original draft: SB, CJ and MMM. Writing—review and editing: SB, MMM, CJ, MG and RM. Supervision: RM, MMM and CJ. Project administration: RM, MMM and CJ. Funding acquisition: SB, MMM, CJ and RM.
Conflict of interest
The authors declare that they have no conflict of interest.
Supporting information
Review Process File
Appendix
Expanded View Figures PDF
Movie EV1
Source Data for Figure 1
Source Data for Figure 2
Acknowledgements
This work was supported by the Agence Nationale de la Recherche ANR‐10‐IDEX‐0001‐02 and the LabEx Cell(n)Scale ANR‐11‐LBX‐0038. CJ is supported by the Institut Curie, the French National Research Agency (ANR) awards ANR‐12‐BSV2‐0007 and ANR‐17‐CE13‐0021, the Institut National Du Cancer 2014‐PL BIO‐11‐ICR‐1 and the Fondation pour la Recherche Medicale (FRM) grant DEQ20170336756. MMM is supported by the European Molecular Biology Organization short‐term fellowship ASTF 148‐2015, the Fondation Vaincre Alzheimer FR‐16055p and the France Alzheimer grant 2023. SB is supported by the FRM grant FDT201805005465. RM is supported by Elite Network of Bavaria “Translational Neuroscience”. The Ttll7 −/− mouse line was established at the Mouse Clinical Institute (PHENOMIN‐Institut Clinique de la Souris, MCI/ICS) in the Genetic Engineering and Model Validation Department. We further thank C. Alberti, E. Belloir, F. Bertrand, C. Caspersen, V. Dangles‐Marie, I. Grandjean, V. Henriot, H. Hermange, C. Jouhanneau, C. Serieyssol and A. Thadal (Institut Curie), as well as H. Blazyca, S. Loserth and B. Meyer (University Hospital Würzburg), for technical assistance. We are grateful to M.‐N. Soler, C. Lovo and L. Besse from the imaging platform PICT‐IBiSA@Orsay (Institut Curie, Orsay) for technical assistance in the use of the light microscopy systems.
The EMBO Journal (2021) 40: e108498.
Contributor Information
Carsten Janke, Email: carsten.janke@curie.fr.
Maria M Magiera, Email: maria.magiera@curie.fr.
Data availability
This study includes no data deposited in external repositories.
References
- Aillaud C, Bosc C, Peris L, Bosson A, Heemeryck P, Van Dijk J, Le Friec J, Boulan B, Vossier F, Sanman LEet al (2017) Vasohibins/SVBP are tubulin carboxypeptidases (TCPs) that regulate neuron differentiation. Science 358: 1448–1453 [DOI] [PubMed] [Google Scholar]
- Alexander JE, Hunt DF, Lee MK, Shabanowitz J, Michel H, Berlin SC, MacDonald TL, Sundberg RJ, Rebhun LI, Frankfurter A (1991) Characterization of posttranslational modifications in neuron‐specific class III beta‐tubulin by mass spectrometry. Proc Natl Acad Sci USA 88: 4685–4689 [DOI] [PMC free article] [PubMed] [Google Scholar]
- Audebert S, Desbruyeres E, Gruszczynski C, Koulakoff A, Gros F, Denoulet P, Eddé B (1993) Reversible polyglutamylation of alpha‐ and beta‐tubulin and microtubule dynamics in mouse brain neurons. Mol Biol Cell 4: 615–626 [DOI] [PMC free article] [PubMed] [Google Scholar]
- Audebert S, Koulakoff A, Berwald‐Netter Y, Gros F, Denoulet P, Eddé B (1994) Developmental regulation of polyglutamylated alpha‐ and beta‐tubulin in mouse brain neurons. J Cell Sci 107: 2313–2322 [DOI] [PubMed] [Google Scholar]
- Baas PW, Rao AN, Matamoros AJ, Leo L (2016) Stability properties of neuronal microtubules. Cytoskeleton 73: 442–460 [DOI] [PMC free article] [PubMed] [Google Scholar]
- Beijer D, Sisto A, Van Lent J, Baets J, Timmerman V (2019) Defects in axonal transport in inherited neuropathies. J Neuromuscul Dis 6: 401–419 [DOI] [PMC free article] [PubMed] [Google Scholar]
- Berezniuk I, Vu HT, Lyons PJ, Sironi JJ, Xiao H, Burd B, Setou M, Angeletti RH, Ikegami K, Fricker LD (2012) Cytosolic carboxypeptidase 1 Is involved in processing alpha‐ and beta‐tubulin. J Biol Chem 287: 6503–6517 [DOI] [PMC free article] [PubMed] [Google Scholar]
- van Beuningen SF, Hoogenraad CC (2016) Neuronal polarity: remodeling microtubule organization. Curr Opin Neurobiol 39: 1–7 [DOI] [PubMed] [Google Scholar]
- Birling M‐C, Dierich A, Jacquot S, Herault Y, Pavlovic G (2012) Highly‐efficient, fluorescent, locus directed cre and FlpO deleter mice on a pure C57BL/6N genetic background. Genesis 50: 482–489 [DOI] [PubMed] [Google Scholar]
- Blanquie O, Bradke F (2018) Cytoskeleton dynamics in axon regeneration. Curr Opin Neurobiol 51: 60–69 [DOI] [PubMed] [Google Scholar]
- Bodakuntla S, Magiera MM, Janke C (2020a) Measuring the impact of tubulin posttranslational modifications on axonal transport. Methods Mol Biol 2101: 353–370 [DOI] [PubMed] [Google Scholar]
- Bodakuntla S, Schnitzler A, Villablanca C, Gonzalez‐Billault C, Bieche I, Janke C, Magiera MM (2020b) Tubulin polyglutamylation is a general traffic‐control mechanism in hippocampal neurons. J Cell Sci 133: jcs241802 [DOI] [PubMed] [Google Scholar]
- Brady ST, Morfini GA (2017) Regulation of motor proteins, axonal transport deficits and adult‐onset neurodegenerative diseases. Neurobiol Dis 105: 273–282 [DOI] [PMC free article] [PubMed] [Google Scholar]
- Deniston Ck, Salogiannis J, Mathea S, Snead Dm, Lahiri I, Matyszewski M, Donosa O, Watanabe R, Böhning J, Shiau Aket al (2020) Structure of LRRK2 in Parkinson's disease and model for microtubule interaction. Nature 588: 344–349 [DOI] [PMC free article] [PubMed] [Google Scholar]
- Dent EW (2020) Dynamic microtubules at the synapse. Curr Opin Neurobiol 63: 9–14 [DOI] [PMC free article] [PubMed] [Google Scholar]
- van Dijk J, Rogowski K, Miro J, Lacroix B, Eddé B, Janke C (2007) A targeted multienzyme mechanism for selective microtubule polyglutamylation. Mol Cell 26: 437–448 [DOI] [PubMed] [Google Scholar]
- Dixit R, Ross JL, Goldman YE, Holzbaur ELF (2008) Differential regulation of dynein and kinesin motor proteins by tau. Science 319: 1086–1089 [DOI] [PMC free article] [PubMed] [Google Scholar]
- Eddé B, Rossier J, Le Caer JP, Desbruyeres E, Gros F, Denoulet P (1990) Posttranslational glutamylation of alpha‐tubulin. Science 247: 83–85 [DOI] [PubMed] [Google Scholar]
- Erck C, Peris L, Andrieux A, Meissirel C, Gruber Ad, Vernet M, Schweitzer A, Saoudi Y, Pointu H, Bosc Cet al (2005) A vital role of tubulin‐tyrosine‐ligase for neuronal organization. Proc Natl Acad Sci USA 102: 7853–7858 [DOI] [PMC free article] [PubMed] [Google Scholar]
- Fernandez‐Gonzalez A, La Spada AR, Treadaway J, Higdon JC, Harris BS, Sidman RL, Morgan JI, Zuo J (2002) Purkinje cell degeneration (pcd) phenotypes caused by mutations in the axotomy‐induced gene, Nna1. Science 295: 1904–1906 [DOI] [PubMed] [Google Scholar]
- Ghetti B, Norton J, Triarhou LC (1987) Nerve cell atrophy and loss in the inferior olivary complex of "Purkinje cell degeneration" mutant mice. J Comp Neurol 260: 409–422 [DOI] [PubMed] [Google Scholar]
- Ghiretti AE, Thies E, Tokito MK, Lin T, Ostap EM, Kneussel M, Holzbaur ELF (2016) Activity‐dependent regulation of distinct transport and cytoskeletal remodeling functions of the dendritic kinesin KIF21B. Neuron 92: 857–872 [DOI] [PMC free article] [PubMed] [Google Scholar]
- Gilmore‐Hall S, Kuo J, Ward JM, Zahra R, Morrison RS, Perkins G, La Spada AR (2019) CCP1 promotes mitochondrial fusion and motility to prevent Purkinje cell neuron loss in pcd mice. J Cell Biol 218: 206–219 [DOI] [PMC free article] [PubMed] [Google Scholar]
- Greer CA, Shepherd GM (1982) Mitral cell degeneration and sensory function in the neurological mutant mouse Purkinje cell degeneration (PCD). Brain Res 235: 156–161 [DOI] [PubMed] [Google Scholar]
- Groh J, Weis J, Zieger H, Stanley ER, Heuer H, Martini R (2012) Colony‐stimulating factor‐1 mediates macrophage‐related neural damage in a model for Charcot‐Marie‐Tooth disease type 1X. Brain 135: 88–104 [DOI] [PMC free article] [PubMed] [Google Scholar]
- Guedes‐Dias P, Holzbaur ELF (2019) Axonal transport: driving synaptic function. Science 366: science.aaw9997 [DOI] [PMC free article] [PubMed] [Google Scholar]
- Guo W, Naujock M, Fumagalli L, Vandoorne T, Baatsen P, Boon R, Ordovás L, Patel A, Welters M, Vanwelden Tet al (2017) HDAC6 inhibition reverses axonal transport defects in motor neurons derived from FUS‐ALS patients. Nat Commun 8: 861 [DOI] [PMC free article] [PubMed] [Google Scholar]
- Henrichs V, Grycova L, Barinka C, Nahacka Z, Neuzil J, Diez S, Rohlena J, Braun M, Lansky Z (2020) Mitochondria‐adaptor TRAK1 promotes kinesin‐1 driven transport in crowded environments. Nat Commun 11: 3123 [DOI] [PMC free article] [PubMed] [Google Scholar]
- Ikegami K, Mukai M, Tsuchida J‐i, Heier RL, Macgregor GR, Setou M (2006) TTLL7 is a mammalian beta‐tubulin polyglutamylase required for growth of MAP2‐positive neurites. J Biol Chem 281: 30707–30716 [DOI] [PMC free article] [PubMed] [Google Scholar]
- Janke C, Magiera MM (2020) The tubulin code and its role in controlling microtubule properties and functions. Nat Rev Mol Cell Biol 21: 307–326 [DOI] [PubMed] [Google Scholar]
- Janke C, Rogowski K, Wloga D, Regnard C, Kajava AV, Strub J‐M, Temurak N, van Dijk J, Boucher D, van Dorsselaer Aet al (2005) Tubulin polyglutamylase enzymes are members of the TTL domain protein family. Science 308: 1758–1762 [DOI] [PubMed] [Google Scholar]
- Kaech S, Banker G (2006) Culturing hippocampal neurons. Nat Protoc 1: 2406–2415 [DOI] [PubMed] [Google Scholar]
- Kalebic N, Sorrentino S, Perlas E, Bolasco G, Martinez C, Heppenstall PA (2013) alphaTAT1 is the major alpha‐tubulin acetyltransferase in mice. Nat Commun 4: 1962 [DOI] [PubMed] [Google Scholar]
- Kang J‐S, Tian J‐H, Pan P‐Y, Zald P, Li C, Deng C, Sheng Z‐H (2008) Docking of axonal mitochondria by syntaphilin controls their mobility and affects short‐term facilitation. Cell 132: 137–148 [DOI] [PMC free article] [PubMed] [Google Scholar]
- Klein D, Martini R (2016) Myelin and macrophages in the PNS: an intimate relationship in trauma and disease. Brain Res 1641: 130–138 [DOI] [PubMed] [Google Scholar]
- Klinman E, Holzbaur ELF (2016) Comparative analysis of axonal transport markers in primary mammalian neurons. Methods Cell Biol 131: 409–424 [DOI] [PubMed] [Google Scholar]
- Landis SC, Mullen RJ (1978) The development and degeneration of Purkinje cells in pcd mutant mice. J Comp Neurol 177: 125–143 [DOI] [PubMed] [Google Scholar]
- LaVail MM, Blanks JC, Mullen RJ (1982) Retinal degeneration in the pcd cerebellar mutant mouse. I. Light microscopic and autoradiographic analysis. J Comp Neurol 212: 217–230 [DOI] [PubMed] [Google Scholar]
- Magiera MM, Bodakuntla S, Žiak J, Lacomme S, Marques Sousa P, Leboucher S, Hausrat TJ, Bosc C, Andrieux A, Kneussel Met al (2018) Excessive tubulin polyglutamylation causes neurodegeneration and perturbs neuronal transport. EMBO J 37: e100440 [DOI] [PMC free article] [PubMed] [Google Scholar]
- Magiera MM, Janke C (2013) Investigating tubulin posttranslational modifications with specific antibodies. In Methods cell biology, Correia JJ, Wilson L (eds), Vol. 115, 2013/08/27 edn, pp 247–267. Burlington: Academic Press; [DOI] [PubMed] [Google Scholar]
- Mahalingan KK, Keith Keenan E, Strickland M, Li Y, Liu Y, Ball HL, Tanner ME, Tjandra N, Roll‐Mecak A (2020) Structural basis for polyglutamate chain initiation and elongation by TTLL family enzymes. Nat Struct Mol Biol 27: 802–813 [DOI] [PubMed] [Google Scholar]
- Matamoros AJ, Baas PW (2016) Microtubules in health and degenerative disease of the nervous system. Brain Res Bull 126: 217–225 [DOI] [PMC free article] [PubMed] [Google Scholar]
- Millecamps S, Julien J‐P (2013) Axonal transport deficits and neurodegenerative diseases. Nat Rev Neurosci 14: 161–176 [DOI] [PubMed] [Google Scholar]
- Monroy BY, Sawyer DL, Ackermann BE, Borden MM, Tan TC, Ori‐McKenney KM (2018) Competition between microtubule‐associated proteins directs motor transport. Nat Commun 9: 1487 [DOI] [PMC free article] [PubMed] [Google Scholar]
- Mullen RJ, Eicher EM, Sidman RL (1976) Purkinje cell degeneration, a new neurological mutation in the mouse. Proc Natl Acad Sci USA 73: 208–212 [DOI] [PMC free article] [PubMed] [Google Scholar]
- Niwa S, Takahashi H, Hirokawa N (2013) beta‐Tubulin mutations that cause severe neuropathies disrupt axonal transport. EMBO J 32: 1352–1364 [DOI] [PMC free article] [PubMed] [Google Scholar]
- O'Gorman S (1985) Degeneration of thalamic neurons in "Purkinje cell degeneration" mutant mice. II. Cytology of neuron loss. J Comp Neurol 234: 298–316 [DOI] [PubMed] [Google Scholar]
- Rogowski K, van Dijk J, Magiera MM, Bosc C, Deloulme J‐C, Bosson A, Peris L, Gold ND, Lacroix B, Grau MBet al (2010) A family of protein‐deglutamylating enzymes associated with neurodegeneration. Cell 143: 564–578 [DOI] [PubMed] [Google Scholar]
- Rüdiger M, Plessman U, Kloppel KD, Wehland J, Weber K (1992) Class II tubulin, the major brain beta tubulin isotype is polyglutamylated on glutamic acid residue 435. FEBS Lett 308: 101–105 [DOI] [PubMed] [Google Scholar]
- Sequier JM, Hunziker W, Richards G (1988) Localization of calbindin D28 mRNA in rat tissues by in situ hybridization. Neurosci Lett 86: 155–160 [DOI] [PubMed] [Google Scholar]
- Shang Y, Li B, Gorovsky MA (2002) Tetrahymena thermophila contains a conventional gamma‐tubulin that is differentially required for the maintenance of different microtubule‐organizing centers. J Cell Biol 158: 1195–1206 [DOI] [PMC free article] [PubMed] [Google Scholar]
- Shashi V, Magiera MM, Klein D, Zaki M, Schoch K, Rudnik‐Schoneborn S, Norman A, Lopes Abath Neto O, Dusl M, Yuan Xet al (2018) Loss of tubulin deglutamylase CCP1 causes infantile‐onset neurodegeneration. EMBO J 37: e100540 [DOI] [PMC free article] [PubMed] [Google Scholar]
- Sheng Z‐H, Cai Q (2012) Mitochondrial transport in neurons: impact on synaptic homeostasis and neurodegeneration. Nat Rev Neurosci 13: 77–93 [DOI] [PMC free article] [PubMed] [Google Scholar]
- Siahaan V, Krattenmacher J, Hyman AA, Diez S, Hernandez‐Vega A, Lansky Z, Braun M (2019) Kinetically distinct phases of tau on microtubules regulate kinesin motors and severing enzymes. Nat Cell Biol 21: 1086–1092 [DOI] [PubMed] [Google Scholar]
- Sirajuddin M, Rice LM, Vale RD (2014) Regulation of microtubule motors by tubulin isotypes and post‐translational modifications. Nat Cell Biol 16: 335–344 [DOI] [PMC free article] [PubMed] [Google Scholar]
- Sleigh JN, Rossor AM, Fellows AD, Tosolini AP, Schiavo G (2019) Axonal transport and neurological disease. Nat Rev Neurol 15: 691–703 [DOI] [PubMed] [Google Scholar]
- Sorbara C, Wagner N, Ladwig A, Nikić I, Merkler D, Kleele T, Marinković P, Naumann R, Godinho L, Bareyre Fet al (2014) Pervasive axonal transport deficits in multiple sclerosis models. Neuron 84: 1183–1190 [DOI] [PubMed] [Google Scholar]
- Stowers RS, Megeath LJ, Gorska‐Andrzejak J, Meinertzhagen IA, Schwarz TL (2002) Axonal transport of mitochondria to synapses depends on milton, a novel Drosophila protein. Neuron 36: 1063–1077 [DOI] [PubMed] [Google Scholar]
- Tan R, Lam AJ, Tan T, Han J, Nowakowski DW, Vershinin M, Simo S, Ori‐McKenney KM, McKenney RJ (2019) Microtubules gate tau condensation to spatially regulate microtubule functions. Nat Cell Biol 21: 1078–1085 [DOI] [PMC free article] [PubMed] [Google Scholar]
- Tort O, Tanco S, Rocha C, Bièche I, Seixas C, Bosc C, Andrieux A, Moutin M‐J, Avilés FX, Lorenzo Jet al (2014) The cytosolic carboxypeptidases CCP2 and CCP3 catalyze posttranslational removal of acidic amino acids. Mol Biol Cell 25: 3017–3027 [DOI] [PMC free article] [PubMed] [Google Scholar]
- Valenstein ML, Roll‐Mecak A (2016) Graded control of microtubule severing by tubulin glutamylation. Cell 164: 911–921 [DOI] [PMC free article] [PubMed] [Google Scholar]
- Verhey KJ, Gaertig J (2007) The tubulin code. Cell Cycle 6: 2152–2160 [DOI] [PubMed] [Google Scholar]
- Vershinin M, Carter BC, Razafsky DS, King SJ, Gross SP (2007) Multiple‐motor based transport and its regulation by Tau. Proc Natl Acad Sci USA 104: 87–92 [DOI] [PMC free article] [PubMed] [Google Scholar]
- Wolff A, de Nechaud B, Chillet D, Mazarguil H, Desbruyeres E, Audebert S, Eddé B, Gros F, Denoulet P (1992) Distribution of glutamylated alpha and beta‐tubulin in mouse tissues using a specific monoclonal antibody, GT335. Eur J Cell Biol 59: 425–432 [PubMed] [Google Scholar]
- Zala D, Hinckelmann M‐V, Yu H, Lyra da Cunha MM, Liot G, Cordelieres FP, Marco S, Saudou F (2013) Vesicular glycolysis provides on‐board energy for fast axonal transport. Cell 152: 479–491 [DOI] [PubMed] [Google Scholar]
Associated Data
This section collects any data citations, data availability statements, or supplementary materials included in this article.
Supplementary Materials
Review Process File
Appendix
Expanded View Figures PDF
Movie EV1
Source Data for Figure 1
Source Data for Figure 2
Data Availability Statement
This study includes no data deposited in external repositories.