Abstract
Background/Aim: Magnetic resonance imaging (MRI) is a technique for evaluating patients with primary and metastatic tumors. The contrast agents improve the diagnostic accuracy of MRI. Large quantities of a contrast agent must be administrated into the patient to obtain useful images, which leads to cell injury. Gadolinium has been reported to cause central lobular necrosis of the liver and nephrogenic systemic fibrosis. However, the toxicity caused on brain tissue is uncertain. Materials and Methods: This study mainly aimed on the in vitro study of high concentration (2 and 5-fold of normal concentration) gadolinium-based contrast agents (GBCAs), gadodiamide (Omniscan®), on normal brain glial SVG P12 cells. MTT assay, DAPI staining, immunofluorescent staining, LysoTracker Red staining, and western blotting analysis were applied on the cells. Results: The viability of gadodiamide (1.3, 2.6, 5.2, 13 and 26 mM)-treated SVG P12 cells was significantly reduced after 24 h of incubation. Gadodiamide caused significant autophagic flux at 2.6, 5.2 and 13.0 mM as seen by acridine orange (AO) staining, LC-3-GFP and LysoTracker Red staining. The expression levels of autophagy-related proteins such as beclin-1, ATG-5, ATG-14 and LC-3 II were up-regulated after 24 h of gadodiamide incubation. Autophagy inhibitors including 3-methyladenine (3-MA), chloroquine (CQ) and bafilomycin A1 (Baf) significantly alleviated the autophagic cell death effect of gadodiamide on normal brain glial SVG P12 cells. Gadodiamide induced significant apoptotic effects at 5.2 mM and 13.0 mM as seen by DAPI staining and the pan-caspase inhibitor significantly alleviated the apoptotic effect. Gadodiamide at 5.2 mM and 13.0 mM inhibited anti-apoptotic protein expression levels of Bcl-2 and Bcl-XL, while promoted pro-apoptotic protein expression levels of Bax, BAD, cytochrome c, Apaf-1, cleaved-caspase-9 and cleaved-caspase-3. Conclusion: Normal brain glial SVG P12 cells treated with high concentrations of gadodiamide can undergo autophagy and apoptosis.
Keywords: Brain glial SVG P12 cells, gadodiamide, autophagy, apoptosis
Magnetic resonance imaging (MRI) is a non-invasive technique used to produce detailed images of internal structure in the human body and diagnose medical conditions. The density of adjacent organs is similar. Therefore, it is impossible to distinguish the shape, location and focus of the organ. MRI contrast agents are used to improve the image contrast between normal and diseased tissues. The density of contrast agent produces a strong contrast effect (1,2). Gadolinium-containing contrast agent is a paramagnetic contrast agent and can be injected into the body through arteriovenous injection to provide paramagnetic resonance imaging contrast agents for the whole body, head, spinal cord, and vascular artery that enhances magnetic resonance imaging (3).
The classification of gadolinium-based contrast agents (GBCAs) can be roughly divided into three categories: (I) According to structure classification; GBCAs are divided into macrocyclic or linear agents which can be either ionic or non-ionic. The free gadolinium ion is highly toxic and blocks calcium channels. It has been reported that free gadolinium ion causes muscle contraction, blood coagulation and impaired mitochondrial function (4). The macrocyclic and the ionic contrast agents have a strong bonding ability with the gadolinium ion, which are less toxic to the human body, and adverse reactions such as allergies and nephrogenic systemic fibrosis (NSF) (5-7). (II) According to pharmacokinetic characteristics; GBCAs based on principle distribution sites are divided into extracellular compartment and hepatobiliary contrast agents (8). Extracellular fluid contrast agents distributed within extracellular space are mainly gadoterate meglumine (Dotarem®), gadobutrol (Gadovist®), gadobenate dimeglumine (MultiHance®), gadopentetate dimeglumine (Magnevist®) and gadodiamide (Omniscan®). Hepatobiliary contrast agents such as gadobenate dimeglumine (MultiHance®) and gadoxetate disodium (Primovist) are used for inspecting gallbladder, grading of cirrhosis and quantification of liver function (5,6). (III) According to relaxation rate; GBCAs are divided into high relaxation rate and general relaxation rate contrast agents. The relaxation rate indicates the rate of hydrogen protons relaxes back into its longitudinal magnetization. The higher the relaxation rate, the shorter the relaxation time and better the contrast effect. Of contrast agents, gadobenate dimeglumine (MultiHance®) and gadoxetate disodium (Primovist) are widely applied in clinical uses (9).
Relaxation times (values specified for T1 and T2) and relaxation rates (corresponding to T1 and T2, 1/T1 and 1/T2) are simply inverse of each other. The increase of the longitudinal relaxation rate (1/T1) is directly proportional to the tissue contrast medium concentration (10). Therefore, quantification of the absolute T1values in tissue before and after intravenous injection of gadolinium would allow objective characterization of the gadolinium uptake. In 2014, Dr. Kanda discovered that the relaxation time T1 increased in the globus pallidus and dentate nucleus of the cerebellum, which may be caused by deposition of GBCAs. This deposition phenomenon can also be seen in people whose renal function was normal (11,12). Researchers have successively used inductively coupled plasma mass spectrometry (ICP-MS) to analyze the contents of GBCAs in the brain, which confirms that no matter the ring or linear, ionic and non-ionic structure, there will be accumulation of GBCAs in the brain (13,14). Except NSF, there is no evidence that the accumulation of GBCAs in the brain is related to the potential interaction of the disease process (15). No neurological disorders, behavioral abnormalities, physiological dysfunctions or any other signs of neurotoxicity have been detected in animal in vivo tests (16).
The European Medicines Agency’s Pharmacovigilance Risk Assessment Committee (PRAC) recommended a preventive suspension of the marketing authorization for three linear contrast agents-gadodiamide (Omniscan), gadopentetate dimeglumine (Megnevist) and gadoversetamide (Optimark), because their linear structure may allow gadolinium to be easily released and cause toxicity in March 2017. The European Commission for Medicines for Human Use (EMA) officially announced the restriction of use of the linear gadolinium contrast agents in MRI in December 2017. The US Food and Drug Administration announced that there is no evidence to show that accumulation of GBCAs can cause harm to the brain, but it is continuing to evaluate the safety of the linear gadolinium contrast agents in May 2017. Taiwan Food and Drug Administration (TFDA) in August 2017 also investigated whether the linear gadolinium contrast agents caused adverse effects on the human body or the brain. TFDA officially announced GBCAs could be applied for clinical use because there were no data to show that the accumulation of GBCAs could cause harm the brain on November 23, 2017. TFDA also declared that physicians should carefully evaluated GBCAs before use on a basis of clinical benefits (17), and suggested to use the lowest effective dose (18,19). The main purpose of the present study was to explore the mechanisms of damage and death of normal brain cells caused by the accumulation of high concentration of gadodiamide (Omniscan®) in the normal glial SVG P12 cell model.
Materials and Methods
Cell line and culture. Human normal brain glial SVG p12 cells were cultured in MEM media, supplemented with 10% fetal bovine serum, 100 U/ml penicillin, 0.1 mg/ml streptomycin and 2 mM L-glutamine. Cells were maintained in an incubator at 37˚C, 5% CO2, and 95% humidity.
Reagents. Gadodiamide was purchased from Dr. Yuh-Feng Tsai of Department of Diagnostic Radiology, Shin-Kong Wu Ho-Su Memorial Hospital. Phosphate buffered saline (PBS), dimethyl sulfoxide (DMSO), 3-(4, 5-dimethylthiazol-2-yl)-2, 5-diphenyltetrazoliumbromide (MTT), acridine orange (AO), 3-Methyladenine (3-MA), chloroquine (CQ) and bafilomycin A1 were acquired from Sigma Chemical Co., St. Louis, MO, USA.
Cell viability by MTT assay. The cell viability was assessed using MTT (thiazolyl blue tetrazolium bromide) colorimetric assay (20). SVG p12 cells were seeded in a 96-well culture dish. After a 24-h incubation to allow cell attachment, different concentrations (0.65, 1.3, 2.6, 5.2, 13 and 26 mM) of gadodiamide were added into cells for 24 h. The supernatants were removed and the cells were incubated with 0.5 μg of MTT for 4 h. The surviving cells converted MTT to formazan that generated a blue-purple color. Formazan were dissolved with DMSO and analyzed the absorbance value of 570 nm wavelength by spectrophotometer. The experiment was repeated three times and the cell viability was determined as the percentage of MTT reduction, assuming the absorbance of control cells as 100%. This experiment was calculated the half-maximal inhibitory concentration (IC50) values of gadodiamide against SVG p12 cells. Viability was expressed as percentage of control (21,22).
Acridine orange (AO) staining. Formation of acidic vesicular organelles (AVOs), the cells were treated with gadodiamide, washed with PBS and stained with 1 ml of fresh medium containing 1 μg/ml acridine orange (AO) for 20 min at 37˚C. AVO were observed under an inverted fluorescent and analyzed using NucleoCounter NC–3000 (ChemoMetec A/S) according to the manufacturer’s protocol (23). The cytoplasm and nucleus of AO-stained cells were fluoresced bright green, whereas the acidic autophagic vacuoles showed fluoresced bright red. The mean of red fluorescence intensity was used to quantify the autophagy responses. To inhibit autophagy, the cells were pretreated with 3-Methyladenine (3-MA), chloroquine (CQ) or 100 nM bafilomycin A1 (Baf) for 4 h, subsequent incubation in the absence or presence of gadodiamide for 24 h at the indicated concentrations (23-25).
DAPI staining. The morphology of SVG p12 cell apoptosis was examined by nuclear staining with DAPI dye. Brifly, the cells were seeded at a concentration of 2×10⁵ in a 6 well culture plate for 24 h to allow attachment. The cells were then treated with gadodiamide and incubated for 24 h, followed by fixing with ethanol 70% (v/v) for 15 min. The cells were washed with PBS and stained with DAPI dye (125 ng/ml) for 30 min in the dark. Apoptotic cells were observed and examined the nuclear morphological changes including reduction in volume and chromatin condensation under a fluorescence microscope (23,26).
Immunofluorescent staining of LC3-GFP. To examine the intensity of LC3-GFP, the cells were seeded with 70% confluence and transfected with 2 μg of GFP–LC3 expression plasmid [Premo Autophagy Sensor LC3B-GFP (BacMam 2.0), Thermo Fisher Scientific] for 24 h. After 24 h, transfected cells were treated with gadodiamide for 24 h, and the green fluorescent dots of GFP–LC3 were visualized under a fluorescence microscope (23,24).
LysoTracker red staining. The cells are treated with gadodiamide for 24 h, washed with PBS and added 1 ml of fresh medium containing 1 μg/ml LysoTracker Red for 20 min. Bright red small cells in the cells were observed under an inverted fluorescent microscope (24).
Western blot analysis. For Western blot analysis, cells were harvested and lysed in RIPA lysis buffer. Protein concentrations were determined and protein samples (100 μg per lane) were separated on the 10% SDS–polyacrylamide gel electrophoresis (SDS-PAGE). After spreading by SDS-PAGE, the protein samples were transferred onto the polyvinylidene difluoride (PVDF) membrane. The PVDF membranes were blocked in 5% nonfat milk and then incubated with the desired primary antibody overnight at 4˚C, followed by appropriate horseradish peroxidase-conjugated secondary antibodies. The protein bands were visualized by an enhanced chemiluminescence detection kit (Amersham Pharmacia Biotech). Image J software was used to analyze the expression of each protein, which was normalized by β-actin (27).
Statistical analysis. Each experiment was performed at least three times. The data were expressed as the means value±standard deviation (SD). Statistical difference was evaluated by one-way analysis of variance (ANOVA) and was considered to be statistically significant when the p-Value is less than 0.05.
Results
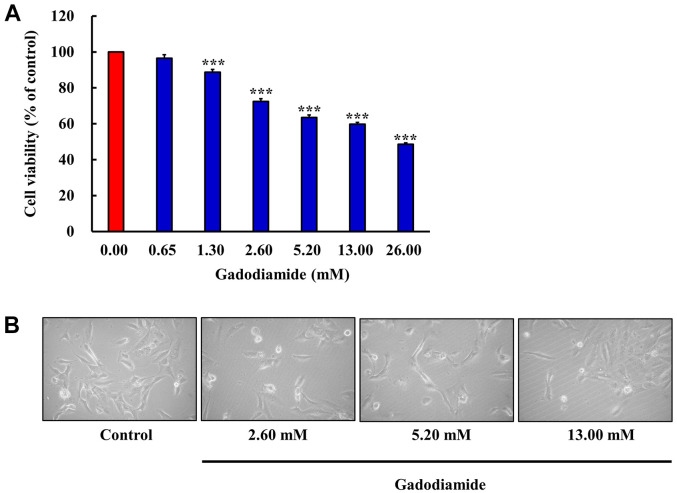
Gadodiamide significantly inhibits cell proliferation of glial cells in vitro. The chemical structure of gadodiamide (Omniscan®) is shown in Figure 1. The effects of gadodiamide on human fetal glial SVG P12 cells were investigated over a wide concentration range. Cells were treated with gadodiamide (0, 0.65, 1.30, 2.60, 5.20, 13.00 and 26.00 mM) for 24 h, and cell viability was assessed by the MTT assay. Our results showed that gadodiamide inhibited glial cell viability in a concentration-dependent manner. Gadodiamide concentrations from 1.3 to 26 mM potently induced glial cell death (Figure 2A). After 24 h incubation with 0-13 mM gadodiamide, the cell morphological changes generally showed cell shrinkage and round forms (Figure 2B). Cells may undergo apoptotic.
Figure 1. Chemical structure of Gadodiamide (Omniscan®).
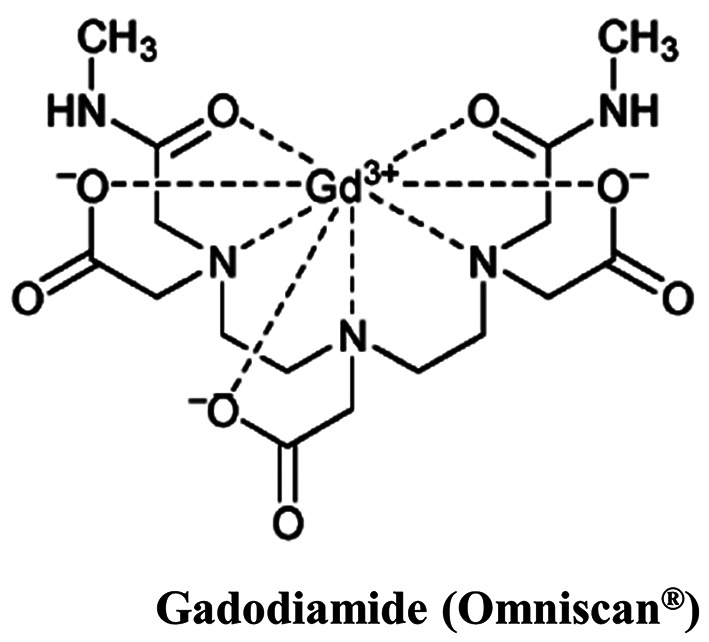
Figure 2. SVG P12 cell viability as influenced by various concentrations of gadodiamide. (A) The cells (5×10⁴ cells/well) were incubated for 24 h with various concentrations of gadodiamide as indicated. Cell viability of SVG P12 cells was assessed by the MTT assay. The results are normalized with the untreated control and values are mean (n=3) (***p<0.001). (B) Cell morphology of SVG P12 cells were observed after treating with different concentrations of gadodiamide for 24 h.
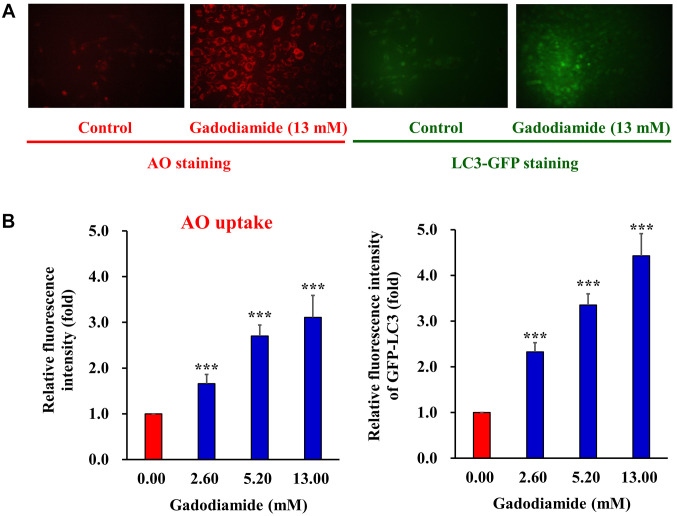
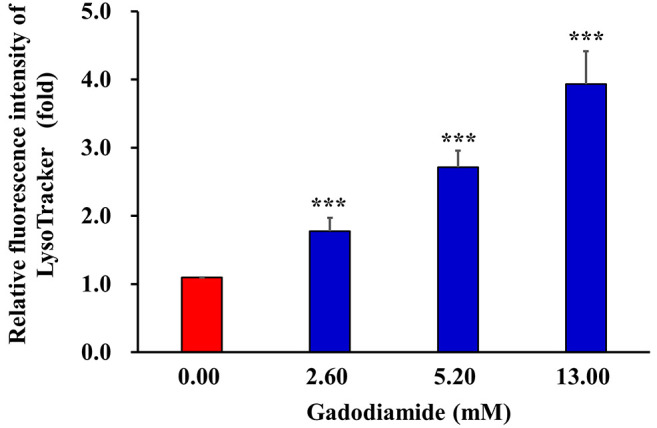
Gadodiamide activates autophagy in SVG P12 cells. Both apoptosis and autophagy are important in regulating cell fate. Recent studies showed that apoptosis and autophagy share the same regulators, including p53, Bcl family proteins, FADD, Atg proteins, and PI3 kinase/Akt pathway (28). Glial cells may induce autophagic cell death in response to gadodiamide. To address this issue, SVG P12 cells were treated with 13 mM gadodiamide, and subsequently the acridine orange (AO) staining was performed to present the formation of autophagic vesicles. Gadodiamide treatment resulted in the appearance of autophagic vacuoles with AO staining (Figure 3A, left panel). For quantitative analysis, we characterized the relative fluorescence intensity. Data showed that gadodiamide significantly increased the relative fluorescence intensity compared to control cells (Figure 3B, left panel). Our findings indicate that 13.0 mM gadodiamide induce an autophagic response, as observed by AO staining of autophagic vacuoles. Members of the LC3 family play a crucial role during the maturation of the autophagosome (25). LC-3-GFP are employed for autophagosome formation by fluorescence microscopy. SVG P12 cells were transfected with LC-3-GFP for 24 h and then treated with 13 mM gadodiamide for another 24 h. LC-3-GFP translocated to nascent autophagosomes in a punctate distribution. Data revealed that autophagosome formed in the gadodiamide-treated glial cells (Figure 3A, right panel). The quantitative analysis determined the relative fluorescence intensity of LC-3-GFP compared to control cells (Figure 3B, right panel). Our findings indicate that 13.0 mM gadodiamide instigate an autophagic response as observed by LC-3-GFP staining of autophagosome formation. LysoTracker Red is a fluorescent probe and cell permeable dye widely used for viable cell staining of acidic lysosomes. SVG P12 cells were treated with at the concentrations of 2.6, 5.2 and 13 mM gadodiamide and performed the LysoTracker Red staining to observe the lysosome changes. Data showed that the relative fluorescence intensity of LysoTracker Red increased compared to control cells in a concentration-dependent manner (Figure 4).
Figure 3. Gadodiamide induces autophagy. The acidic vacuoles in the autophagosomes were stained using acridine orange (AO). (A) Representative fluorescent images of AO-stained (left panels) and LC3-GFP-stained SVG P12 (right panels) after treating with 13 mM gadodiamide. (B) The cells were treated with the indicated concentrations of gadodiamide and quantitative changes were measured. Asterisks represent statistically significant differences from control cells (***p<0.001).
Figure 4. Gadodiamide induces lysosomal membrane permeability. The cells were treated with the indicated concentrations of gadodiamide and stained with LysoTracker Red. ***p<0.001.
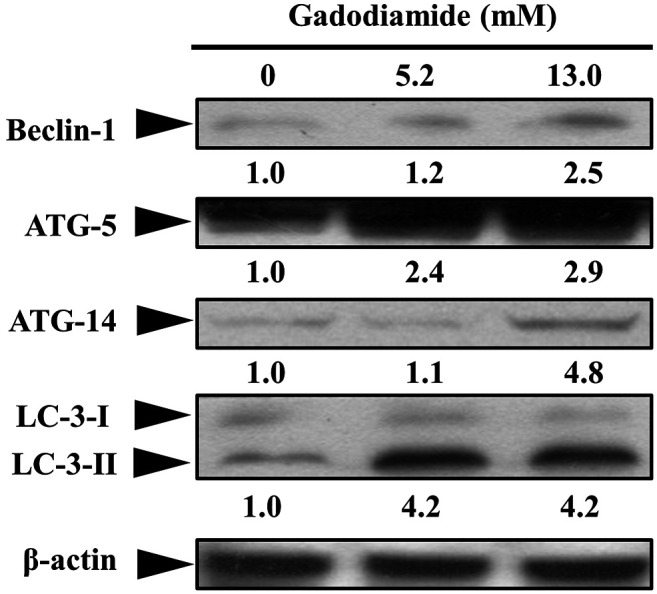
To determine which autophagy proteins are involved in gadodiamide-induced autophagy, we performed western blotting in beclin1, Atg5, Atg14 and LC3-II. Protein expression levels of beclin1, Atg5, Atg14 and LC3-II were elevated in gadodiamide treated SVG P12 cells (Figure 5). These results suggest that gadodiamide induces autophagy.
Figure 5. Gadodiamide enhanced the expression of autophagy-related genes encoding proteins, beclin1, Atg5, Atg14 and LC-3-II in SVG P12 cells. Representative western blots were prepared and analyzed. Values show fold changes relative to the control protein (β-actin).
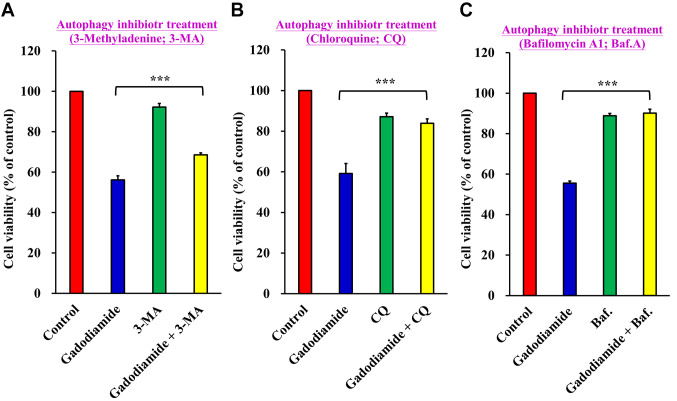
Gadodiamide-induced cell death was decreased by co-treatment with autophagy inhibitors. To confirm the effect of gadodiamide-induced autophagy on gadodiamide-mediated cytotoxicity, SVG P12 cells were co-treated with the autophagy inhibitors 3-Methyladenine (3-MA), Chloroquine (CQ) or Bafilomycin A1 (Baf) in the presence of 13 mM gadodiamide for 24 h. Cell viability was measured using the MTT assay. Cell viability increased to 68.61±0.95% on co-treatment with gadodiamide and 3-MA versus 56.17±2.04% in the gadodiamide-treated group (Figure 6A), 83.88±2.18% on co-treatment of gadodiamide with CQ versus 59.16±4.95% in the gadodiamide-treated group (Figure 6B), and 90.12±2.01 % on co-treatment with gadodiamide and Baf versus 55.58±1.01% in the gadodiamide-treated group (Figure 6C). These results suggest that gadodiamide-induced autophagy enhances gadodiamide-mediated SVG P12 cell death.
Figure 6. Autophagy inhibitors restore cell viability in SVG P12 cells. The cells were treated with 13 mM gadodiamide and (A) 3-Methyladenine (3-MA), (B) Chloroquine (CQ) and (C) Bafilomycin A1 (Baf). Cell viability was assessed by the MTT assay. ***p<0.001 versus respective controls.
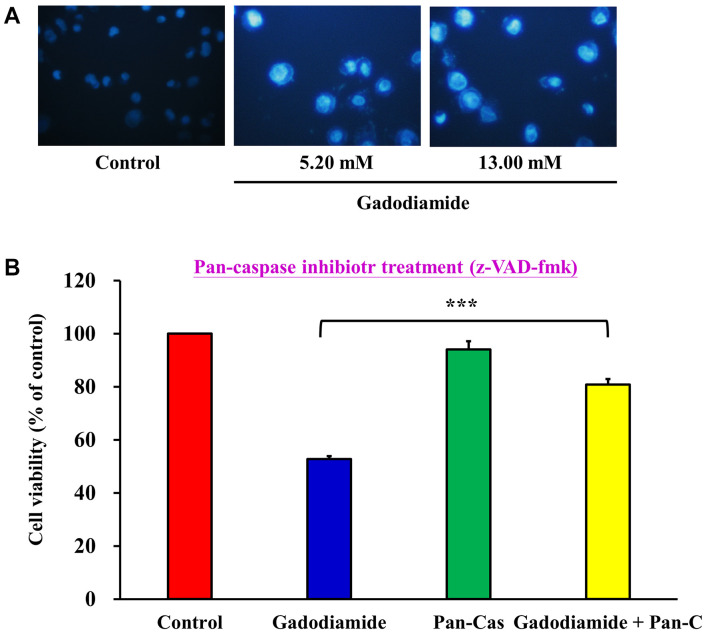
Gadodiamide induces apoptosis in SVG P12 cells. Chromatin condensation is a morphological hallmark of apoptotic cell death. To explore the changes of chromatin condensation upon gadodiamide treatment, cells were treated with gadodiamide at the concentrations of 5.2 and 13 mM, followed by DAPI staining (Figure 7A). The number of brightly fluoresced and fragmented nuclei was greater in the gadodiamide treated cells than in control cells. Data indicated that gadodiamide induced chromatin condensation and apoptosis in apoptosis cells.
Figure 7. Gadodiamide induces apoptosis in SVG P12 cells. (A) Chromatin condensation was induced in cells after treatment with 13 mM gadodiamide, as seen by DAPI staining. (B) The pan-caspase inhibitor restored cell viability, as seen by the MTT assay. ***p<0.001.
To evaluate the effect of pan-caspase inhibitor Z-VAD-FMK on apoptosis in SVG P12 cells, cells were treated with 13 mM gadodiamide in the absence or presence of the pan-caspase inhibitor, followed by the MTT assay (Figure 7B). The results showed that gadodiamide induced apoptosis and the pan-caspase inhibitor significantly alleviated the apoptotic effect of gadodiamide in SVG P12 cells.
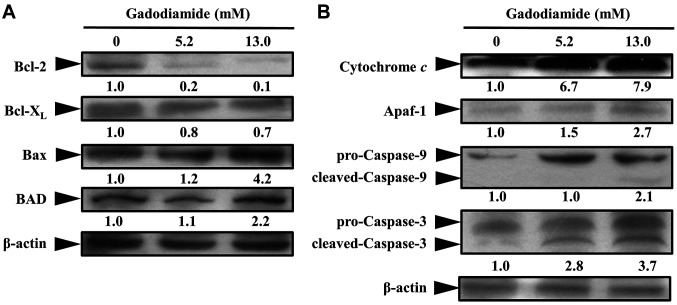
To investigate the mechanisms by which gadodiamide induce apoptosis, western blot analysis was performed for detecting the expression changes in apoptosis-related proteins. Data showed a significant decrease of Bcl-2 and Bcl-XL, whilst an increase of Bax and BAD in gadodiamide treated SVG P12 cells (Figure 8A), suggesting that mitochondrial dysfunction was associated with gadodiamide-treated cells. Cytochrome c is located on mitochondrial inter-membrane and maintains mitochondrial potential and ATP production. Apoptotic stimuli induce the permeabilization of the mitochondrial outer membrane, leading to cytochrome c release from the mitochondria. To characterize whether gadodiamide induces the mitochondrial pathway of apoptosis, SVG P12 cells were treated with gadodiamide for examining the expression changes in cytochrome c and apoptotic protease activating factor-1 (Apaf-1). Our results revealed that the expression levels of cytochrome c and Apaf-1 proteins were elevated in gadodiamide treated SVG P12 cells (Figure 8B). Caspase-9 and caspase-3 are key molecules involved in the mitochondrial pathway of apoptosis. Pro-caspase-9 and pro-caspase-3 become active and cleaved upon apoptosis. Our results showed that the expression levels of cleaved-caspase-9 and cleaved-caspase-3 proteins were increased in gadodiamide-treated SVG P12 cells (Figure 8B). Our findings suggest that gadodiamide induces cell death via the mitochondrial pathway of apoptosis.
Figure 8. Gadodiamide affected the expression of apoptosis-related proteins in SVG P12 cells. (A) Gadodiamide inhibited expression levels of Bcl-2 and Bcl-XL and increased the expression levels of Bax and BAD. (B) Gadodiamide increased the expression levels of cytochrome c, Apaf-1, cleaved-caspase-9 and cleaved-caspase-3.
Discussion
GBCAs enhance the image contrast between normal and diseased tissues (29). As a free ion, gadolinium causes central lobular necrosis of the liver, NSF and calcium channel blocking, which is highly toxic to cells. Gadodiamide is classified into a linear and ionic GBCA. The known risks associated with gadolinium-containing contrast agents include possible acute reactions and nephrogenic systemic fibrosis (NSF) (30). Acute or immediate adverse reactions are allergic reactions that occur within 1 h after the injection of the gadolinium-containing contrast agent, which is unpredictable. Patients at risk of acute allergic reactions are those who have had a history of acute reactions to GBCAs, asthma or other allergic diseases (31).
By far, NSF is the most severe clinical symptom of gadolinium retention in body tissues. Early GBCA-related NSF symptoms include pain, itching, swelling, and erythema, usually starting in the legs, while late GBCA-related NSF symptoms are characterized by fibrosis and thickening of the skin and subcutaneous tissue, visceral fibrosis, and finally limb contracture, cachexia and death (29). Gadolinium metal ions replaced from the contrast agent compound (transmetalation) and free gadolinium ions are deposited in different tissues of the body such as skin, leading to fibrosis. GBCAs stay in the body for a long time for patients with abnormal renal function. It is recommended to limit GBCA use, especially in dialyzed patients and patients with an estimated Glomerular filtration rate <30 ml/min /1.73 m2 (30). Since hospitals require renal function testing before using GBCAs, the risk of NSF is not high in recent years.
In the current study, the normal brain glial cell line SVG P12 is assessed for toxicity of gadodiamide. The cells instigate autophagy and apoptosis after treatment with a high dose of gadodiamide at concentrations 6.5-13 mM (normal concentration: 1.3 mM). The SVG P12 cell proliferation was inhibited after at least 1.3 mM of gadodiamide treatment. Cells apoptosis is induced at a higher concentration than 2.6 mM gadodiamide. We observed a significant autophagic flux in response to gadodiamide. Using AO, autophagic vesicles were formed in the gadodiamide treated cells. Autophagosome formation was found after 13 mM gadodiamide treatment for 24 h by LC-3-GFP staining. In addition, mitochondrial permeability increased after a high dose of gadodiamide treatment using LysoTracker Red staining. Autophagy-related proteins were elevated in gadodiamide-treated cells. Taken together, we indeed found that autophagy is triggered in cells after the high doses of gadodiamide treatment.
Two main apoptotic pathways inducing the extrinsic pathway and the intrinsic pathway have been characterized (28). The intrinsic pathway is associated with the involvement of mitochondria. We found that gadodiamide caused mitochondrial dysfunctions. The mitochondrial pathway of apoptosis-related proteins was examined. Cytochrome c was released from mitochondria and bound to Apaf-1, which activates caspase-9 and trigger caspase cascade. Cleaved-caspase-9 and cleaved-caspase-3 were increased in the gadodiamide-treated cells. Anti-apoptotic proteins including Bcl-2 and Bcl-XL were up-regulated, while pro-apoptotic proteins such as Bax and BAD were down-regulated. Collectively, cells induce apoptosis after the high doses of gadodiamide treatment.
On the other hand, autophagy is a critical mechanism in regulating cell death (28). The antiproliferative effect associated with autophagy of gadodiamide in glial cells was evaluated. In this study, gadodiamide-induced SVG P12 cell autophagy was detected by the increasing lysosomal activity, and the formation of autophagic vesicles and acidic vesicular organelles. Early stage of autophagy is induced by ATG protein complex which catalyzes the expanding autophagosome membrane. Subsequently, members of the LC3 family play a crucial role during the maturation of the autophagosome (25,28). Our results revealed that autophagosome formed in the gadodiamide-treated glial cells by AO staining and LC-3-GFP staining. Further molecular signaling was shown by western blot analysis in Beclin1, Atg5, Atg14 and LC3-II. These results suggest that gadodiamide induces SVG P12 cell autophagy.
In conclusion, treatment with gadodiamide at a concentration of 6.5-13 mM can induce glial cell damage, cell autophagy and cell apoptosis. This study confirmed the toxicological effects of high-dose gadodiamide and provided the safety assessment of gadodiamide in the use of MRI examinations. Clinical physicians must pay attention to the relative dose of gadodiamide for yielding clinical benefits and contributing academic research.
Conflicts of Interest
The Authors declare no conflicts of interest in relation to this study.
Authors’ Contributions
YFT, SCT and JSY conceived and designed the experiments. JSY and FJT performed the experiments. YFT, SCT, CCL and JSY analyzed the data. YFT, SCT, YJC and JSY wrote and modified the paper. All authors read and approved the manuscript and agree to be accountable for all aspects of the research in ensuring that the accuracy or integrity of any part of the work are appropriately investigated and resolved.
Acknowledgements
The present study was supported by the project from Dr. Yuh-Feng Tsai of the Shin-Kong Wu Ho-Su Memorial Hospital (Taipei, Taiwan) (grant no. 2020SKHADR032), in part by the project from Dr. Jai-Sing Yang of China Medical University Hospital (Taichung, Taiwan) (grant no. DMR-106-179), in part by the project from Dr. Yu-Jen Chiu of Taipei Veterans General hospital (Taipei, Taiwan) (grant no. V110B-038) and in part by the project from Dr. Shih-Chang Tsai of China Medical University (grant no. CMU-103-S-16 and MOST 106-2314-B-039-046). We thank the Office of Research & Development at China Medical University, Taichung, Taiwan, R.O.C. for using the Medical Research Core Facilities to perform experiments and data analysis.
References
- 1.Chang AL, Yu HJ, von Borstel D, Nozaki T, Horiuchi S, Terada Y, Yoshioka H. Advanced imaging techniques of the wrist. AJR Am J Roentgenol. 2017;209(3):497–510. doi: 10.2214/AJR.17.18012. [DOI] [PubMed] [Google Scholar]
- 2.Czeyda-Pommersheim F, Martin DR, Costello JR, Kalb B. Contrast agents for MR imaging. Magn Reson Imaging Clin N Am. 2017;25(4):705–711. doi: 10.1016/j.mric.2017.06.011. [DOI] [PubMed] [Google Scholar]
- 3.Martí-Bonmatí L, Martí-Bonmatí E. Retention of gadolinium compounds used in magnetic resonance imaging: a critical review and the recommendations of regulatory agencies. Radiologia. 2017;59(6):469–477. doi: 10.1016/j.rx.2017.09.007. [DOI] [PubMed] [Google Scholar]
- 4.Feng X, Xia Q, Yuan L, Yang X, Wang K. Impaired mitochondrial function and oxidative stress in rat cortical neurons: implications for gadolinium-induced neurotoxicity. Neurotoxicology. 2010;31(4):391–398. doi: 10.1016/j.neuro.2010.04.003. [DOI] [PubMed] [Google Scholar]
- 5.Beam AS, Moore KG, Gillis SN, Ford KF, Gray T, Steinwinder AH, Graham A. GBCAs and risk for nephrogenic systemic fibrosis: a literature review. Radiol Technol. 2017;88(6):583–589. [PubMed] [Google Scholar]
- 6.Malikova H, Holesta M. Gadolinium contrast agents - are they really safe? J Vasc Access. 2017;18(Suppl 2):1–7. doi: 10.5301/jva.5000713. [DOI] [PubMed] [Google Scholar]
- 7.Wilson J, Gleghorn K, Seigel Q, Kelly B. Nephrogenic systemic fibrosis: A 15-year retrospective study at a single tertiary care center. J Am Acad Dermatol. 2017;77(2):235–240. doi: 10.1016/j.jaad.2017.02.003. [DOI] [PubMed] [Google Scholar]
- 8.Aime S, Caravan P. Biodistribution of gadolinium-based contrast agents, including gadolinium deposition. J Magn Reson Imaging. 2009;30(6):1259–1267. doi: 10.1002/jmri.21969. [DOI] [PMC free article] [PubMed] [Google Scholar]
- 9.Gianolio E, Bardini P, Arena F, Stefania R, Di Gregorio E, Iani R, Aime S. Gadolinium retention in the rat brain: Assessment of the amounts of insoluble gadolinium-containing species and intact gadolinium complexes after repeated administration of gadolinium-based contrast agents. Radiology. 2017;285(3):839–849. doi: 10.1148/radiol.2017162857. [DOI] [PubMed] [Google Scholar]
- 10.Gowland P, Mansfield P, Bullock P, Stehling M, Worthington B, Firth J. Dynamic studies of gadolinium uptake in brain tumors using inversion-recovery echo-planar imaging. Magn Reson Med. 1992;26(2):241–258. doi: 10.1002/mrm.1910260206. [DOI] [PubMed] [Google Scholar]
- 11.Kanda T, Fukusato T, Matsuda M, Toyoda K, Oba H, Kotoku J, Haruyama T, Kitajima K, Furui S. Gadolinium-based contrast agent accumulates in the brain even in subjects without severe renal dysfunction: Evaluation of autopsy brain specimens with inductively coupled plasma mass spectroscopy. Radiology. 2015;276(1):228–232. doi: 10.1148/radiol.2015142690. [DOI] [PubMed] [Google Scholar]
- 12.Kanda T, Nakai Y, Hagiwara A, Oba H, Toyoda K, Furui S. Distribution and chemical forms of gadolinium in the brain: a review. Br J Radiol. 2017;90(1079):20170115. doi: 10.1259/bjr.20170115. [DOI] [PMC free article] [PubMed] [Google Scholar]
- 13.Tibussek D, Rademacher C, Caspers J, Turowski B, Schaper J, Antoch G, Klee D. Gadolinium brain deposition after macrocyclic gadolinium administration: A pediatric case-control study. Radiology. 2017;285(1):223–230. doi: 10.1148/radiol.2017161151. [DOI] [PubMed] [Google Scholar]
- 14.Runge VM. Critical questions regarding gadolinium deposition in the brain and body after injections of the gadolinium-based contrast agents, safety, and clinical recommendations in consideration of the EMA’s pharmacovigilance and risk assessment committee recommendation for suspension of the marketing authorizations for 4 linear agents. Invest Radiol. 2017;52(6):317–323. doi: 10.1097/RLI.0000000000000374. [DOI] [PubMed] [Google Scholar]
- 15.Attenberger UI, Runge VM, Morelli JN, Williams J, Jackson CB, Michaely HJ. Evaluation of gadobutrol, a macrocyclic, nonionic gadolinium chelate in a brain glioma model: comparison with gadoterate meglumine and gadopentetate dimeglumine at 1.5 T, combined with an assessment of field strength dependence, specifically 1.5 versus 3 T. J Magn Reson Imaging. 2010;31(3):549–555. doi: 10.1002/jmri.22089. [DOI] [PubMed] [Google Scholar]
- 16.Murata N, Gonzalez-Cuyar LF, Murata K, Fligner C, Dills R, Hippe D, Maravilla KR. Macrocyclic and other non-group 1 gadolinium contrast agents deposit low levels of gadolinium in brain and bone tissue: Preliminary results from 9 patients with normal renal function. Invest Radiol. 2016;51(7):447–453. doi: 10.1097/RLI.0000000000000252. [DOI] [PubMed] [Google Scholar]
- 17.Habermeyer J, Boyken J, Harrer J, Canneva F, Ratz V, Moceri S, Admard J, Casadei N, Jost G, Bäuerle T, Frenzel T, Schmitz C, Schütz G, Pietsch H, von Hörsten S. Comprehensive phenotyping revealed transient startle response reduction and histopathological gadolinium localization to perineuronal nets after gadodiamide administration in rats. Sci Rep. 2020;10(1):22385. doi: 10.1038/s41598-020-79374-z. [DOI] [PMC free article] [PubMed] [Google Scholar]
- 18.Strickler SE, Clark KR. Gadolinium deposition: a study review. Radiol Technol. 2021;92(3):249–258. [PubMed] [Google Scholar]
- 19.Costa AF, van der Pol CB, Maralani PJ, McInnes MDF, Shewchuk JR, Verma R, Hurrell C, Schieda N. Gadolinium deposition in the brain: A systematic review of existing guidelines and policy statement issued by the Canadian Association of Radiologists. Can Assoc Radiol J. 2018;69(4):373–382. doi: 10.1016/j.carj.2018.04.002. [DOI] [PubMed] [Google Scholar]
- 20.Tsai YF, Chen YF, Hsiao CY, Huang CW, Lu CC, Tsai SC, Yang JS. Caspase-dependent apoptotic death by gadolinium chloride (GdCl3) via reactive oxygen species production and MAPK signaling in rat C6 glioma cells. Oncol Rep. 2019;41(2):1324–1332. doi: 10.3892/or.2018.6913. [DOI] [PubMed] [Google Scholar]
- 21.Lin CC, Chen KB, Tsai CH, Tsai FJ, Huang CY, Tang CH, Yang JS, Hsu YM, Peng SF, Chung JG. Casticin inhibits human prostate cancer DU 145 cell migration and invasion via Ras/Akt/NF-ĸB signaling pathways. J Food Biochem. 2019;43(7):e12902. doi: 10.1111/jfbc.12902. [DOI] [PubMed] [Google Scholar]
- 22.Ha HA, Yang JS, Tsai FJ, Li CW, Cheng YD, Li J, Hour MJ, Chiu YJ. Establishment of a novel temozolomide resistant subline of glioblastoma multiforme cells and comparative transcriptome analysis with parental cells. Anticancer Res. 2021;41(5):2333–2347. doi: 10.21873/anticanres.15008. [DOI] [PubMed] [Google Scholar]
- 23.Ha HA, Chiang JH, Tsai FJ, Bau DT, Juan YN, Lo YH, Hour MJ, Yang JS. Novel quinazolinone MJ-33 induces AKT/mTOR-mediated autophagy-associated apoptosis in 5FU-resistant colorectal cancer cells. Oncol Rep. 2021;45(2):680–692. doi: 10.3892/or.2020.7882. [DOI] [PMC free article] [PubMed] [Google Scholar]
- 24.Chang CH, Lee CY, Lu CC, Tsai FJ, Hsu YM, Tsao JW, Juan YN, Chiu HY, Yang JS, Wang CC. Resveratrol-induced autophagy and apoptosis in cisplatin-resistant human oral cancer CAR cells: A key role of AMPK and Akt/mTOR signaling. Int J Oncol. 2017;50(3):873–882. doi: 10.3892/ijo.2017.3866. [DOI] [PubMed] [Google Scholar]
- 25.Yang JS, Lu CC, Kuo SC, Hsu YM, Tsai SC, Chen SY, Chen YT, Lin YJ, Huang YC, Chen CJ, Lin WD, Liao WL, Lin WY, Liu YH, Sheu JC, Tsai FJ. Autophagy and its link to type II diabetes mellitus. Biomedicine (Taipei) 2017;7(2):8. doi: 10.1051/bmdcn/2017070201. [DOI] [PMC free article] [PubMed] [Google Scholar]
- 26.Huang WW, Tsai SC, Peng SF, Lin MW, Chiang JH, Chiu YJ, Fushiya S, Tseng MT, Yang JS. Kaempferol induces autophagy through AMPK and AKT signaling molecules and causes G2/M arrest via downregulation of CDK1/cyclin B in SK-HEP-1 human hepatic cancer cells. Int J Oncol. 2013;42(6):2069–2077. doi: 10.3892/ijo.2013.1909. [DOI] [PubMed] [Google Scholar]
- 27.Wu KM, Hsu YM, Ying MC, Tsai FJ, Tsai CH, Chung JG, Yang JS, Tang CH, Cheng LY, Su PH, Viswanadha VP, Kuo WW, Huang CY. High-density lipoprotein ameliorates palmitic acid-induced lipotoxicity and oxidative dysfunction in H9c2 cardiomyoblast cells via ROS suppression. Nutr Metab (Lond) 2019;16:36. doi: 10.1186/s12986-019-0356-5. [DOI] [PMC free article] [PubMed] [Google Scholar]
- 28.Thorburn A. Apoptosis and autophagy: regulatory connections between two supposedly different processes. Apoptosis. 2008;13(1):1–9. doi: 10.1007/s10495-007-0154-9. [DOI] [PMC free article] [PubMed] [Google Scholar]
- 29.Michaely HJ, Aschauer M, Deutschmann H, Bongartz G, Gutberlet M, Woitek R, Ertl-Wagner B, Kucharczyk W, Hammerstingl R, De Cobelli F, Rosenberg M, Balzer T, Endrikat J. Gadobutrol in renally impaired patients: Results of the GRIP study. Invest Radiol. 2017;52(1):55–60. doi: 10.1097/RLI.0000000000000307. [DOI] [PMC free article] [PubMed] [Google Scholar]
- 30.Lange S, Mędrzycka-Dąbrowska W, Zorena K, Dąbrowski S, Ślęzak D, Malecka-Dubiela A, Rutkowski P. Nephrogenic systemic fibrosis as a complication after gadolinium-containing contrast agents: a rapid review. Int J Environ Res Public Health. 2021;18(6):3000. doi: 10.3390/ijerph18063000. [DOI] [PMC free article] [PubMed] [Google Scholar]
- 31.Behzadi AH, Prince MR. Immediate reaction to gadolinium based contrast agent with fatal outcome. Radiol Case Rep. 2018;13(5):1091–1092. doi: 10.1016/j.radcr.2018.06.009. [DOI] [PMC free article] [PubMed] [Google Scholar]


