

ABSTRACT
Background
Dietary guidelines traditionally recommend low-fat dairy because dairy's high saturated fat content is thought to promote cardiovascular disease (CVD). However, emerging evidence indicates that dairy fat may not negatively impact CVD risk factors when consumed in foods with a complex matrix.
Objective
The aim was to compare the effects of diets limited in dairy or rich in either low-fat or full-fat dairy on CVD risk factors.
Methods
In this randomized controlled trial, 72 participants with metabolic syndrome completed a 4-wk run-in period, limiting their dairy intake to ≤3 servings/wk of nonfat milk. Participants were then randomly assigned to 1 of 3 diets, either continuing the limited-dairy diet or switching to a diet containing 3.3 servings/d of either low-fat or full-fat milk, yogurt, and cheese for 12 wk. Exploratory outcome measures included changes in the fasting lipid profile and blood pressure.
Results
In the per-protocol analysis (n = 66), there was no intervention effect on fasting serum total, LDL, and HDL cholesterol; triglycerides; free fatty acids; or cholesterol content in 38 isolated plasma lipoprotein fractions (P > 0.1 for all variables in repeated-measures ANOVA). There was also no intervention effect on diastolic blood pressure, but a significant intervention effect for systolic blood pressure (P = 0.048), with a trend for a decrease in the low-fat dairy diet (−1.6 ± 8.6 mm Hg) compared with the limited-dairy diet (+2.5 ± 8.2 mm Hg) in post hoc testing. Intent-to-treat results were consistent for all endpoints, with the exception that systolic blood pressure became nonsignificant (P = 0.08).
Conclusions
In men and women with metabolic syndrome, a diet rich in full-fat dairy had no effects on fasting lipid profile or blood pressure compared with diets limited in dairy or rich in low-fat dairy. Therefore, dairy fat, when consumed as part of complex whole foods, does not adversely impact these classic CVD risk factors. This trial was registered at clinicaltrials.gov as NCT02663544.
Keywords: cardiometabolic disease, metabolic syndrome, dairy, cardiovascular disease risk, serum lipid profile, blood pressure, humans
Introduction
Dairy is considered a part of a healthy diet in several dietary guidelines around the world (1–4). Traditionally, low-fat dairy is recommended based on the hypothesis that the high SFA content of full-fat dairy foods leads to an increase in fasting total and LDL-cholesterol concentrations, which would, in turn, be expected to increase the risk of cardiovascular disease (CVD) (5). However, new evidence indicates that the association between SFAs and CVD is not as robust as previously believed (6). It is also important to consider substantial differences in the physiology and health effects of individual SFAs (7), as well as a modifying effect of the food matrix (8).
In the observational literature, there is consistently no evidence of an association between the consumption of full-fat dairy foods with an increased risk of CVD (9–11). Even consuming large amounts of butter was not associated with an increased risk for CVD, coronary artery disease, or stroke in a recent meta-analysis (12). While many observational studies use FFQs, there is also no evidence of an association between dairy fat biomarkers in plasma phospholipids (PL), a more objective measure of dairy fat consumption, and CVD (13, 14). Therefore, the existing observational literature does not provide evidence to support the hypothesis that the consumption of full-fat dairy increases the risk for CVD.
This lack of an association between dairy fat intake and CVD risk may be unexpected given that trials consistently indicate that butter, as compared with fats rich in unsaturated fatty acids, results in elevated fasting total and LDL-cholesterol concentrations (15). However, recent trials suggest that a harmful impact of dairy fat on serum lipids is not observed when the same amount of dairy fat is consumed in the form of cheese (16, 17). These results suggest that dairy fat may differentially impact serum lipids when consumed as butter when compared with dairy foods with a complex matrix. Indeed, a review of randomized controlled trials (RCTs) indicates that consumption of full-fat dairy in the form of whole dairy foods does not affect HDL or LDL cholesterol or other CVD risk factors such as blood pressure (18). However, most of these studies did not directly compare low-fat with full-fat dairy products and did not include a diverse range of dairy foods in their interventions. As a result, questions remain as to whether full-fat versus low-fat dairy foods differentially affect the serum lipid profile and other CVD risk factors when dairy is consumed as a mixture of whole foods. Therefore, we compared the effect of consuming 3.3 servings/d of low-fat versus full-fat milk, yogurt, and cheese versus a control group limited in dairy on a comprehensive fasting lipid profile and blood pressure in a 12-wk parallel-design RCT.
Methods
Trial registration
This trial was registered on clinicaltrials.gov on 26 January 2016 (registry number NCT02663544), prior to enrolling participants. Changes were made after the commencement of the study, but before the end of the trial and any laboratory or statistical analyses, to add outcomes that broadened our ability to interpret trial effects on CVD risk. This includes adding the change in cholesterol concentrations in 38 plasma lipoprotein fractions and the change in the LDL relative flotation rate (Rf) as exploratory endpoints.
Study design
This parallel-design RCT was carried out January 2016 through October 2018 at the University of Washington (UW) and the Fred Hutchinson Cancer Research Center (Fred Hutch) located in Seattle, Washington. Participants completed a 4-wk run-in period [previously called wash-in period in the first paper from this trial (19)] during which they followed a limited-dairy diet. After completing a baseline clinic visit during the last week of the run-in period, participants were randomly assigned to either continue the limited-dairy diet or switch to either a low-fat or full-fat diary diet for 12 wk. The randomization was performed using a random-number generator by M Kratz and S Holte using a block randomization procedure, with a block size of 3, stratified by gender and the screening visit HOMA-IR (<5.0 vs. ≥5.0 or diagnosis of diabetes). Participants were assigned to the intervention diets by the study coordinators using standardized procedures and forms. Subjects completed a follow-up clinic visit in the final week of the intervention period.
Participants
We enrolled 18- to 75-y-old, weight-stable participants with metabolic syndrome (MetS) (20). Key exclusion criteria included history of bariatric surgery, uncontrolled diabetes [glycated hemoglobin (HbA1c) >8%], the presence of major chronic inflammatory or autoimmune disease, fasting triglycerides >1000 mg/dL, or recent use of medications or diagnosis of any medical condition likely to interfere with study endpoints.
We identified potentially eligible participants predominantly through automated screens of UW electronic medical records. After study staff reviewed medical records for key exclusion criteria, the remaining potentially eligible participants were contacted by mail. This letter was followed by a telephone screening interview and then an in-person screening visit at Fred Hutch. During the screening visit, the study protocol was discussed in detail and participants completed a fasting blood draw, health history questionnaire, and diet history questionnaire, and anthropometrics were assessed. Furthermore, participants sampled the intervention dairy foods. Informed consent was obtained from all participants prior to enrollment. The Fred Hutch institutional review board approved this study.
Study diets
During the run-in period, participants were asked not to consume any dairy other than a maximum of 3 servings/wk of nonfat milk (“limited-dairy diet”). At the baseline clinic visit, participants were randomly assigned to 1 of 3 diets: to continue the limited-dairy diet or switch to a diet rich in either low-fat or full-fat dairy. In the low-fat dairy diet arm, participants were asked to consume 3.3 servings of dairy/d in the form of nonfat milk and yogurt and low-fat cheese. In the full-fat dairy diet arm, participants were asked to consume 3.3 servings of dairy/d in the form of whole milk (3.25% fat), full-fat yogurt (3.1% fat), and full-fat cheese. We administered 3.3 servings of dairy/d to ensure that those who were included in the per-protocol analysis, partly defined as those who consumed at least 90% of the dairy provided, would still consume at least 3 servings of dairy/d, as recommended in the 2015 Dietary Guidelines for Americans. One serving was defined as 240 mL of milk, 170 g of yogurt, and 42.5 g of cheese. Darigold produced the nonfat and whole milk. Mountain High (General Mills) produced the nonfat and full-fat yogurt. Low-fat and full-fat cheeses included cheddar cheese (21.2% and 32.9% fat, respectively; Sargento), gouda (18.0% and 32.2% fat, respectively; Beemster), and mozzarella (10.6% and 21.2% fat, respectively; Frigo/Saputo). Additional ingredients, besides milk, for each dairy product included the following—for full-fat cheddar: cheese culture, salt, enzymes, annatto; for low-fat cheddar: cheese culture, salt, enzymes, vegetable color, vitamin A palmitate; for full-fat mozzarella: cheese cultures, salt, enzymes; for low-fat mozzarella: cheese cultures, salt, enzymes, vitamin A palmitate; for full-fat gouda: salt, cheese culture, animal rennet, annatto; for low-fat gouda: salt, cheese culture, animal rennet, annatto; for low-fat and full-fat yogurt: fruit pectin, vitamin A acetate, vitamin D3; for whole milk: vitamin D3; and for skimmed milk: vitamin A palmitate, vitamin D3. All study dairy foods are commercially available and were not specifically designed or altered for this study. The total amount of dairy fat in the administered dairy foods averaged 0, 8, and 29 g/d in the limited, low-fat, and full-fat dairy diets, respectively. The Human Nutrition Laboratory at Fred Hutch provided all study dairy products. During the study, participants were instructed not to consume any dairy foods, defined as any food item or mixed dish containing a significant amount of dairy, other than those provided. Participants were then instructed to otherwise continue to consume their habitual diet ad libitum, incorporating the administered dairy products into their regular meals and snacks. They were also asked to record their dairy consumption in a daily log and to return any leftover dairy foods for weigh-backs.
Clinic visits and data collection
At both clinic visits, we collected fasting blood (after a 12-h overnight fast), measured body weight and waist and hip circumference, conducted a whole-body DXA scan on a Lunar iDXA scanner (GE Healthcare) to assess fat mass, and measured blood pressure. Blood pressure was measured according to the guidelines outlined by the American Heart Association (21). Participants sat comfortably for 5 min with legs uncrossed, with their back and upper arm supported; then, clothing that covered the arm was removed and the first blood pressure was taken. A minimum of 2 blood pressure measurements were taken with an interval time of 1 min. If there was a >5 mm Hg difference between the first and second reading, a third reading was taken, and all readings were averaged together. Participants also completed physical activity questionnaires at baseline (clinic visit 1) and monthly during the 12-wk intervention period. Twice during the run-in diet period and 3 times during the intervention period, participants completed an unannounced 24-h dietary recall administered by a staff member of the Fred Hutch Nutrition Assessment Shared Resource who was otherwise not associated with the trial.
Laboratory procedures
Serum lipids (triglycerides, HDL cholesterol, LDL cholesterol, total cholesterol, free fatty acids, and LDL-Rf) and cholesterol concentrations in 38 lipoprotein fractions in fasting plasma were measured at Northwest Lipid Research Laboratories in Seattle, Washington. Lipid profiling was done by enzymatic assays on a Roche Double Modular P Analytics automated analyzer. HDL cholesterol was similarly assessed after precipitation of apoB-containing particles. The lipoprotein fractions were isolated using a non-equilibrium density gradient ultracentrifugation procedure to determine the cholesterol content of each of the 38 fractions and the flotation rate of LDL particles, as described previously (22). This method is designed to optimize the resolution of apoB-containing lipoproteins. Briefly, the procedure involves the layering of density-adjusted plasma samples under potassium bromide solution to form a discontinuous gradient. The plasma samples thus prepared are then subjected to ultracentrifugation, and the resulting lipoprotein layers are drained from the bottom of each tube as 38 fractions. The measurement of cholesterol in each of the 38 fractions results in a lipoprotein profile where HDL, LDL, intermediate-density lipoprotein, and VLDL are easily identified. The LDL-Rf is calculated as the fraction number of the major peak of LDL divided by the total number of fractions. The Rf of each plasma sample calculated by this procedure is highly reproducible (CV <2%). The LDL-Rf indicates the mean density of the most common LDL particles, thus classifying individuals with small, dense LDL versus large, buoyant LDL.
As 1 assessment of intervention compliance, we measured the amounts of pentadecanoic acid (C15:0), heptadecanoic acid (C17:0), and trans-palmitoleic acid(trans-C16:1n–7) in plasma PL (conducted in the Kraft Lab, Burlington, VT), as these are validated biomarkers of dairy fat intake (23, 24). Plasma lipids were extracted according to the method of Folch et al. (25). PL were isolated from total plasma lipids via solid-phase extraction using aminopropyl cartridges (ThermoFisher Scientific), and trans-methylated with boron trifluoride solution in methanol (Sigma-Aldrich) to FAMEs (26). FAMEs were analyzed by GC-LC (26).
Study outcomes
The primary a priori–defined outcome of this trial was glucose tolerance, and secondary outcomes were major determinants of glucose tolerance (19). This paper reports results on all exploratory endpoints related to CVD risk, other than high-sensitivity C-reactive protein, which was included in the primary paper. The exploratory endpoints in this study include the following: fasting serum lipid profile including triglycerides, HDL cholesterol, LDL cholesterol, total cholesterol, free fatty acids, and LDL-Rf; the cholesterol content in 38 plasma lipoprotein fractions; and blood pressure.
Statistical analyses
We aimed to randomly assign 72 participants, with the goal of analyzing at least 20 in each of the 3 intervention groups in the primary per-protocol analysis. Sample size was calculated based on the primary aim of the trial, glucose tolerance (19).
Statistical analyses were performed using SPSS (version 26; IBM Corporation). The level of significance was set to P < 0.05 for all analyses. We conducted both an intent-to-treat (ITT) and a per-protocol analysis. For the ITT analysis, we carried the baseline values forward for those time points where data were unavailable. For the per-protocol analysis, subjects were included if they completed the dietary intervention and all clinic visits, were compliant with the dietary regimen (defined as consuming at least 90% of the study dairy foods provided, and consuming ≤10 servings of nonstudy dairy foods during the intervention period), had no changes in medications that may impact the respective study endpoint, and remained free from illness that may impact the respective study endpoint.
Logarithmic transformations were performed on all outcome variables that were not normally distributed prior to analyses. An unadjusted repeated-measures ANOVA (RM-ANOVA) with time (clinic visit 1 vs. 2) as the within-subject variable and diet group (limited vs. low-fat versus full-fat) as the between-subjects variable, with primary emphasis on the time by diet group interaction, was model 1. Then, baseline factors that differed by study arm, defined as a P value <0.1, were included in the model as covariates, as appropriate. This was considered our primary result as it is thought to better reflect intervention effects (27). We also conducted sensitivity analyses adjusted for change in habitual physical activity. In addition, we conducted sensitivity analyses adjusted for our stratification variables, gender, and baseline HOMA-IR. For any outcome variable for which we found an overall intervention effect, we conducted additional secondary analyses adjusting for changes in body fat mass, body weight, and waist circumference to determine to which extent any difference observed between the groups may be attributable to a change in these variables. No sex-based or ethnicity/race-based analyses were conducted due to the limitation of the sample size. If the global RM-ANOVA indicated significant time × diet differences for an outcome variable, we conducted post hoc independent-sample t tests comparing the change in that variable in each of the 3 diet groups, or 3 RM-ANOVAs that included only 2 diet groups at a time for post hoc tests on adjusted models. In all post hoc analyses, we adjusted for multiple testing according to Bonferroni, multiplying the resulting P value from each test by 3 to account for 3 pairwise comparisons of 2 groups each in post hoc testing, maintaining a significance level cutoff of P < 0.05.
Results
Description of participants
The trial was conducted January 2016 through October 2018, when the recruitment goal was met. Figure 1 shows the flow of study recruitment and enrollment. Seventy-two adults were randomly assigned to 1 of the 3 diet groups: 24 each to the limited, low-fat, and full-fat dairy diets. All randomly assigned participants were included in the ITT analyses. Five subjects were excluded from the per-protocol analysis for changes in blood pressure, for a total of 67 participants. Three dropped out of the study prior to the final clinic visit, and 2 were excluded for noncompliance. An additional subject was excluded from the per-protocol analysis of serum lipids, for a total of 66 participants, due to a change in medication. Table 1 shows the baseline characteristics stratified by intervention groups for participants included in the per-protocol analyses for fasting serum lipids. There was a trend for a difference between diet groups at baseline for HDL cholesterol (P = 0.10); otherwise, the randomization was successful for all endpoints related to CVD risk. Per our statistical analysis plan, baseline HDL cholesterol was therefore included in adjusted analyses of lipid-related endpoints (model 2).
FIGURE 1.
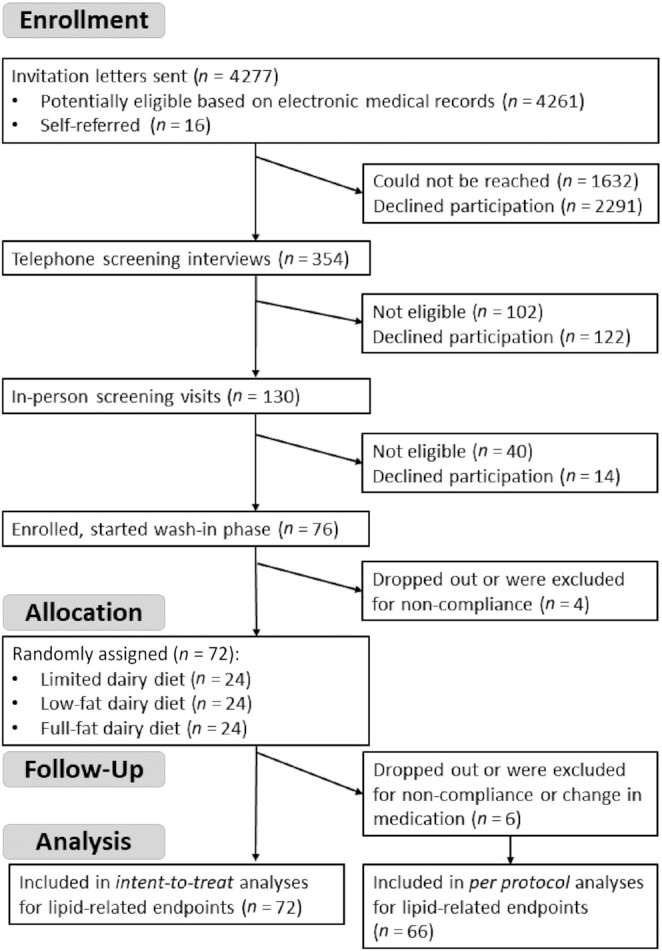
Flow diagram of study recruitment and enrollment.
TABLE 1.
Baseline characteristics of study participants included in the per-protocol analyses for fasting serum lipids1
| Variable | Limited dairy (n = 21) | Low-fat dairy (n = 24) | Full-fat dairy (n = 21) | P |
|---|---|---|---|---|
| Age, y | 56.0 (46, 69) | 64.0 (58, 71) | 65.0 (58, 68) | 0.25 |
| Male sex, % | 52.4% | 58.3% | 57.1% | 0.92 |
| White race, % | 71.4% | 82.6% | 71.4% | 0.61 |
| Body weight, kg | 100.7 ± 16.5 | 96.5 ± 25.7 | 94.8 ± 17.4 | 0.64 |
| Height, cm | 173.3 ± 9.2 | 171.6 ± 12.7 | 170.2 ± 6.3 | 0.61 |
| Fat mass, kg | 38.4 (32.1, 47.3) | 32.5 (23.6, 52.1) | 36.7 (27.4, 48.8) | 0.67 |
| Lean body mass, kg | 57.2 ± 10.3 | 55.5 ± 14.0 | 53.8 ± 8.8 | 0.63 |
| Visceral adiposity, (in3)3 | 143.7 (94.9, 207.3) | 103.9 (71.4, 202.1) | 123.5 (77.7, 176.6) | 0.40 |
| Diastolic blood pressure, mm Hg | 76.1 ± 9.5 | 80.9 ± 10.6 | 78.0 ± 7.7 | 0.23 |
| Systolic blood pressure, mm Hg | 124 (118, 135) | 123 (119, 138) | 126 (119, 136) | 0.83 |
| LDL cholesterol derived, mg/dL | 88.4 ± 32.5 | 93.8 ± 33.6 | 105.2 ± 37.0 | 0.28 |
| HDL cholesterol, mg/dL | 34.0 (29.5, 44.0) | 36.5 (29.5, 48.5) | 41.0 (37.0, 60.0) | 0.10 |
| Triglycerides, mg/dL | 142.0 (73.0, 184.5) | 149.5 (92.5, 204.0) | 122.0 (87.0, 191.5) | 0.50 |
| Total cholesterol, mg/dL | 153.4 ± 43.8 | 168.3 ± 37.2 | 180.0 ± 43.6 | 0.12 |
| Free fatty acids, mEq/L | 0.54 ± 0.19 | 0.59 ± 0.17 | 0.57 ± 0.16 | 0.61 |
| LDL relative flotation rate | 0.26 (0.24, 0.29) | 0.26 (0.24, 0.29) | 0.26 (0.25, 0.29) | 0.20 |
| CRP, mg/L | 1.3 (0.9, 2.9) | 0.9 (0.4, 2.1) | 1.5 (0.9, 3.0) | 0.50 |
| IL-6, pg/mL | 3.5 (2.3, 4.0) | 2.6 (1.8, 4.1) | 2.9 (1.6, 4.2) | 0.69 |
| Adiponectin, ng/mL | 5100 (3775, 7650) | 6425 (3900, 9300) | 5900 (3925, 9750) | 0.88 |
| Physical activity, MET-h/wk | 36.7 (21.5, 52.7) | 41.0 (25.7, 89.7) | 37.8 (19.6.0, 47.9) | 0.29 |
| Healthy Eating Index score | 72.1 ± 9.3 | 72.8 ± 9.7 | 72.2 ± 8.5 | 0.97 |
Values are means ± SDs for normally distributed variables, medians (25th, 75th percentile) for non–normally distributed variables, or percentages (for categorical variables); n = 66. P values are based on an ANOVA, except for gender and race, which were based on an independent-samples Kruskal-Wallis test. CRP, C-reactive protein; MET-h, metabolic equivalent of task hours.
Sample size for White race: limited, n = 21; low-fat, n = 23; full-fat, n = 21 (race was self-identified).
Sample size for visceral adiposity: limited, n = 20; low-fat, n = 22; full-fat n = 20.
Adherence to intervention, dietary intakes, and changes in adiposity
Based on the data on administered and returned study dairy foods, as well as participants’ daily logs, the low-fat dairy group consumed 98.2% ± 1.8% and the full-fat dairy 97.9% ± 2.8% (mean ± SD) of the dairy foods provided to them. During the limited-dairy intervention period, participants consumed an average of 74.1% ± 35.3% of the provided (nonmandatory) nonfat milk. Consumption of nonstudy dairy foods was 0.6 ± 1.0, 0.6 ± 0.9, and 1.3 ± 2.3 total servings over 12 wk during the limited, low-fat, and full-fat dairy diet intervention periods. High compliance was confirmed through the evaluation of dairy-fat biomarker concentrations, including C15:0, C17:0, and trans-C16:1n–7 (Supplemental Table 1). The percentage of C15:0 in the plasma phospholipid fraction changed differentially (P = 0.002 for the time × diet interaction in the overall RM-ANOVA), with an increase in the full-fat dairy group compared with the limited-dairy group (post hoc, adjusted P = 0.003), and a trend for an increase in the full-fat dairy group compared with the low-fat dairy group (post hoc, adjusted P = 0.075). A trend for a statistically significant differential change was seen for the plasma PL concentration of trans-C16:1n–7 (P = 0.09 for the time × diet interaction in the overall RM-ANOVA). No statistically significant differential change was seen for the plasma PL concentration of C17:0 (P = 0.14 for the time × diet interaction in the overall RM-ANOVA).
The dietary interventions led to changes in the participants’ diet, as measured by repeated unannounced 24-h dietary recalls. We previously reported dietary intake data for the 67 participants who were included in the per-protocol analyses for the primary and secondary endpoints (19). These 67 were included in our per-protocol analysis for blood pressure, and these data are identical or very similar for the 66 participants included in the per-protocol analysis for lipid-related endpoints (Supplemental Table 2). Specifically, the intake of SFAs (% of energy) increased in the full-fat dairy group compared with both the limited and the low-fat dairy groups (post hoc, adjusted P < 0.001), and the intake of calcium increased in both dairy groups compared with the limited-dairy diet (post hoc, adjusted P < 0.05). The intake of MUFAs decreased in the low-fat dairy diet compared with both the limited and full-fat dairy diets (post hoc, adjusted P < 0.05), but there was no effect on PUFA intake. The intake of total sugars (% of energy) increased in the low-fat dairy group as compared with the limited-dairy diet (post hoc, adjusted P = 0.006), but there was no diet effect on the intake of added sugars. Nutrient density–adjusted fiber intake (in g/1000 kcal) decreased in the full-fat dairy diet group as compared with the limited-dairy diet group (post hoc, adjusted P = 0.024), but there was no diet effect on absolute fiber intake (in g/d). The differences in the fat content of the administered dairy foods affected the macronutrient composition of the overall diet, with an increase in carbohydrate intake (% of total energy) in the low-fat dairy arm compared with the full-fat dairy arm (post hoc, adjusted P = 0.015), an increase in fat intake (% of energy) in the full-fat dairy arm compared with the low-fat dairy arm (post hoc, adjusted P < 0.001), and a trend for an increase in protein intake in the low-fat dairy arm as compared with the limited and full-fat dairy arms (post hoc, adjusted P = 0.087 and P = 0.060, respectively). Total energy intake increased in the full-fat dairy arm compared with both the limited and low-fat dairy arms (post hoc, adjusted P < 0.05 for both comparisons), with no difference between the latter 2. The 2015 Healthy Eating Index (28) increased in the low-fat dairy group compared with the full-fat dairy group (post hoc, adjusted P < 0.05), whereas the limited-dairy group did not differ from either the full-fat or low-fat dairy groups in post hoc testing.
As reported previously (19), body weight, waist circumference, and fat mass changed differentially in the 3 intervention groups. Both body weight and waist circumference were more strongly increased in participants consuming full-fat dairy foods and had an intermediate effect in participants consuming low-fat dairy foods (19). The increase in these outcome measures was associated with an increase in ad libitum energy intake observed in the dairy-consuming groups (19).
Fasting blood lipids
We observed no differential diet intervention effect on total cholesterol (per-protocol, model 2, P = 0.328), triglycerides (P = 0.446), LDL cholesterol (P = 0.975), HDL cholesterol (P = 0.788), or free fatty acids (P = 0.825) in fasting serum, or the LDL-Rf (P = 0.118) (Figure 2 and Supplemental Table 3). Similarly, there were no differential effects of the intervention diets on the cholesterol content in any of the 38 isolated plasma lipoprotein fractions (per-protocol, P > 0.1 for all variables) (Figure 3). Sensitivity analyses adjusting for either the change in physical activity or baseline stratification variables did not affect any of the models.
FIGURE 2.

Changes in LDL cholesterol (A), HDL cholesterol (B), LDL flotation rate (C), free fatty acids (D), triglycerides (E), and total cholesterol (F) in the limited-dairy diet (n = 21), low-fat dairy diet (n = 24), and full-fat dairy diet (n = 21) (per-protocol analysis, n = 66). Outcome variables are represented as the change variable calculated as the value at follow-up minus the value at baseline. Boxes represent 25th–75th percentiles, and whiskers 5th and 95th percentiles, with outliers represented by a solid dot. The medians are represented by horizontal bars across the boxes and the means are represented by crosses. The P values for the time by diet interactions from the overall repeated-measures ANOVA, adjusted for baseline HDL cholesterol (with the exception of change in HDL cholesterol), are displayed at the top of each boxplot. Rf, relative position of the major LDL peak in the gradient.
FIGURE 3.

Cholesterol content in 38 fractions in participants consuming the limited-dairy diet (n = 21) (A), the low-fat dairy diet (n = 24) (B), or the full-fat dairy diet (n = 21) (C). Upper panels show absolute concentrations from CRC visit #1 (baseline) and visit #2 (follow-up), based on the per-protocol cohort for lipid analyses (n = 66), and lower panels show changes in cholesterol content in each fraction during the interventions. Significant differences were assessed using a repeated-measures ANOVA, with a primary emphasis on the time by diet group interaction. No statistically significant differential changes between the intervention groups were observed for any of the 38 lipoprotein fractions. CRC 1: clinical research visit 1 (baseline); CRC 2: clinical research visit 2 (follow-up). CRC, clinical research center; IDL, intermediate-density lipoprotein.
Blood pressure
There was no effect of the dairy intervention on diastolic blood pressure. Yet, there was a significant difference between the diet interventions for systolic blood pressure (per-protocol, P = 0.048) (Table 2). However, after adjustment for multiple testing, no 2 intervention groups were significantly different from one another, although there was a trend for a decrease in systolic blood pressure in the low-fat dairy group as compared with the limited-dairy group (P = 0.063). Furthermore, a sensitivity analysis adjusting for change in fat mass attenuated the effect of diet on systolic blood pressure to a trend (per-protocol, P = 0.098) (Table 2). A sensitivity analysis adjusting for change in physical activity did not affect the results. We also conducted extensive sensitivity analyses adjusting for changes in dietary variables that were differentially changed by the intervention diets. In addition, we conducted sensitivity analyses adjusting for the stratification variables, which slightly attenuated the results (P = 0.050). The intervention effects on systolic blood pressure remained significant after adjustment for changes in added sugar, total fat, SFAs, and MUFAs; the change in fiber intake (in g/1000 kcal); and the change in the 2015 Healthy Eating Index. Adjusting for the change in total calories, % of energy from protein, % energy from carbohydrates, or MUFAs attenuated the results (P < 0.075 for all adjusted models).
TABLE 2.
Effect of dairy consumption on blood pressure (per-protocol analysis) among the limited (n = 22), low-fat (n = 24), and full-fat (n = 21) dairy groups1
| Repeated-measures ANOVA (time × diet intervention)2 | |||||
|---|---|---|---|---|---|
| Baseline | Follow-up | Change | Model 1 | Model 2 | |
| Systolic blood pressure, mm Hg | 0.048 | 0.098 | |||
| Limited dairy | 124 (119, 137) | 131 (120, 137) | 2.5 ± 8.2 | ||
| Low-fat dairy | 123 (119, 138) | 125 (116, 131) | −1.6 ± 8.6 | ||
| Full-fat dairy | 126 (119, 136) | 121 (110, 134) | −5.4 ± 16.1 | ||
| Diastolic blood pressure, mm Hg | 0.451 | ||||
| Limited dairy | 76.8 ± 9.9 | 77.2 ± 8.9 | 0.5 ± 6.9 | ||
| Low-fat dairy | 80.9 ± 10.6 | 78.3 ± 8.9 | −2.6 ± 7.4 | ||
| Full-fat dairy | 78.0 ± 7.7 | 77.0 ± 10.1 | −0.9 ± 10.4 | ||
Values are mean ± SDs for normally distributed variables or medians (25th, 75th percentile) for non–normally distributed variables. Model 1: unadjusted analysis. Model 2: adjusting for change in fat mass.
P-values reflecting an overall comparison of the 3 dietary phases by repeated-measures ANOVA.
ITT analysis
The distribution of baseline characteristics was similar for the ITT analysis (n = 72) (Supplemental Table 4). The significant effect of diet on systolic blood pressure observed in the unadjusted per-protocol analysis became a trend in the ITT analysis (P = 0.080; data not shown). Otherwise, the ITT analysis yielded results consistent with the per-protocol analyses for all other endpoints (P > 0.05; data not shown).
Adverse events
No subject withdrew from the study due to adverse events. Of 5 adverse events reported during the trial, 2 were rated as unrelated to study procedures. Three adverse events were related to clinical study procedures and classified as mild–moderate in severity. Two of these adverse events were related to hypoglycemia during the oral-glucose-tolerance test conducted for the primary aim of this trial, not reported here. The third event was adverse side effects experienced during the MRI scan. None of the adverse events were related to the dietary interventions.
Discussion
In this 12-wk RCT in individuals with MetS, consuming 3.3 servings of full-fat dairy/d in the form of milk, yogurt, and cheese did not significantly affect the fasting lipid profile compared with consuming identical amounts of low-fat dairy or a diet limited in dairy. This included no significant difference in the cholesterol content of any of the 38 isolated plasma lipoprotein fractions, despite substantial differences between the 3 diets in the consumption of total fat and SFAs. There was also no intervention effect on diastolic blood pressure. There was a significant difference between the diet interventions for systolic blood pressure, with a trend for a decrease in the low-fat dairy diet compared with the limited-dairy diet in post hoc testing after adjustment for multiple testing. These findings are especially surprising given the higher ad libitum energy intake and increases in both waist circumference and weight in the full-fat dairy arm, as reported previously (19).
The results of this study challenge the hypothesis that consuming full-fat dairy products increases the risk of CVD through elevating total and LDL-cholesterol concentrations, as a result of their high SFA and cholesterol content (5). This hypothesis was driven by short-term feeding trials demonstrating that isolated dairy fat in the form of butter results in dyslipidemia as compared with unsaturated fatty acids (15). Potential explanations for this discrepancy include the fact that most (29–32) intervention studies used a higher overall dose of dairy fat than was consumed in the full-fat dairy arm of our study and most trials compared the impact of butter versus specific plant oils rich in unsaturated fatty acids. Still, our trial suggests that a high daily dose of dairy fat consumed as part of whole foods with a complex matrix does not affect the fasting serum lipid profile. Therefore, the results of this study align with the observational literature, which predominantly indicates that full-fat dairy foods are not associated with CVD (9, 10).
Our finding that diets rich in low-fat versus full-fat dairy did not differentially affect serum lipids aligns with 2 previous RCTs. Raziani et al. (33) randomly assigned individuals with MetS to a full-fat cheese, reduced-fat cheese, or a no-dairy carbohydrate control group. Similar to our data, there was no differential effect of the intervention diets on free fatty acids or LDL, HDL, or total cholesterol. Steinmetz et al. (34), in a randomized crossover study of 8 healthy men, found that whole milk did not differentially change triglycerides or HDL, LDL, or total cholesterol as compared with skim milk. In contrast to these studies, our trial included a larger variety and higher dose of dairy products, adding confidence that the null results in these prior trials were not due to the types or amounts of dairy studied.
In contrast to our study, 1 previous RCT found that full-fat as compared with low-fat dairy consumption unfavorably affected LDL cholesterol (35). In a randomized crossover study by Nestel et al. (35), 12 healthy overweight Australian adults followed 3 different isocaloric dairy diets: a low-fat dairy diet consisting of low-fat milk and yogurt, a full-fat fermented dairy diet consisting of cheese and yogurt, and a full-fat nonfermented dairy diet consisting of butter, cream, and ice cream. They found that both full-fat dairy diets resulted in higher LDL cholesterol as compared with the low-fat dairy diet, with no difference between the fermented and nonfermented full-fat dairy diets. There are a few potential explanations for why Nestel et al. observed an effect on LDL cholesterol while we did not. One possibility is that LDL-cholesterol concentrations were affected by other dietary modifications (i.e., changes in fiber intake) that resulted from incorporating full-fat dairy into the diet. In addition, the heterogeneity in the types of dairy foods provided in each intervention diet may have impacted LDL cholesterol differentially. In contrast to Nestel et al.’s study, our study compared diets with identical types of dairy foods that varied only in their fat content.
In contrast to our results, 2 previous studies found that full-fat as compared to low-fat dairy consumption increased HDL cholesterol (35, 36). In the study by Nestel et al. (35) described above, the authors found that HDL cholesterol increased during the nonfermented full-fat dairy diet as compared with the low-fat dairy diet. The other study, by Engel et al. (36), was a randomized crossover study in 18 healthy adults who included 0.5 L of whole milk or skimmed milk alongside an ad libitum diet. They found that HDL cholesterol increased during the whole-milk diet as compared with the skimmed-milk diet. One possible explanation for the differential impact on HDL cholesterol between these studies and ours is that both Engel et al. and Nestel et al. conducted their studies in healthy populations, whereas our study was conducted in individuals with MetS. In addition, given that Engel et al.’s study was conducted in Denmark and the study by Nestel et al. was conducted in Australia, it may be that differences in the fatty acid profile of full-fat dairy or the overall dietary patterns contributed to differential fasting lipid outcomes.
Blood pressure is another critical CVD risk factor investigated in our study. In alignment with 2 previous studies (33, 37), we found that full-fat dairy consumption did not differ from low-fat dairy consumption in its effects on diastolic or systolic blood pressure. Given that these studies used only cheese (26) or milk and yogurt (37) in their interventions, our study adds confidence that consuming a wider range of full-fat versus low-fat dairy foods does not differentially impact blood pressure.
There are a few potential explanations for the discrepancy between our findings and the historical view that dairy fat increases the risk of CVD. Dairy fat is complex and includes a diverse range of SFAs (38, 39). It is important to emphasize that the long-chain SFAs that have LDL-cholesterol–raising effects only make up 40–50% of the total fatty acids in dairy (40). The other short-, medium-, and branched-chain SFAs in dairy have substantially different physiological and metabolic effects (7). For example, butyric acid (C4:0), a short-chain fatty acid found in dairy, is a key end product of dietary fiber fermentation in the gut that is thought to have substantial beneficial physiological effects (41). In addition, branched-chain SFAs found in dairy, such as phytanic acid, have been indicated to increase hepatic fat oxidation (42). Given the heterogeneity in the health effects of various SFAs, an emerging view is that all SFAs should not be categorized together, and the health effects of SFA-rich foods are likely dependent on the composition of their SFAs. Dairy fat also includes a diverse range of MUFAs and PUFAs, such as oleic acid, ɑ-linolenic acid, and palmitoleic acid (42–44). The latter has been suggested to reduce de novo lipogenesis and stimulate fat oxidation in the liver, thereby reducing hepatic triglyceride content (44, 45). Therefore, it may be that any deleterious serum lipid effects of the long-chain SFAs found in full-fat dairy foods are attenuated by the beneficial health effects of the other fatty acids found in dairy. Second, consuming dairy fat not in isolation but as part of complex whole foods is likely to modify its fasting serum lipid profile–related effects (46). Specifically, the calcium, phosphorus, milk-fat globule membrane, and starter cultures found in dairy foods have been indicated to modify the blood lipid response through decreasing intestinal fat absorption, altering the gut microbiota, or by altering hepatic expression of genes involved in fatty acid synthesis and cholesterol metabolism (46–48).
Limitations of our study should be accounted for when interpreting the results. This study was conducted in individuals with MetS and included predominantly older White participants, impacting the generalizability of the results. Providing all dairy foods to participants allowed better control over encouraging and assessing compliance. However, the dairy foods provided do not necessarily mimic the dairy foods that would be selected by free-living individuals. Furthermore, it remains unclear whether intervention effects on the fasting serum lipid profile or blood pressure would have been observed if the intervention extended beyond 12 wk, especially given the increase in weight and waist circumference in the dairy-consuming groups (19). It is also possible that the effects of the dairy diets would have been slightly different if energy intake and body weight had been experimentally standardized. In addition, it is possible that interindividual differences in the pre-study habitual diet, which was not assessed or corrected for, could have introduced random variation and decreased our power to detect intervention effects. Furthermore, we cannot be certain whether or not the null results are due to a lack of statistical power, given that this is a secondary analysis and the study sample size calculation was based on the primary endpoint, glucose tolerance. However, given that not even a trend was observed for any endpoint (other than systolic blood pressure), it seems highly unlikely that a differential change of clinical relevance was missed. Similarly, the numerous endpoints included in this exploratory analysis raise the question that the statistically significant differential intervention effect on systolic blood pressure may have been due to a type I error. Our study also has many strengths, including that it largely addressed limitations of previous RCTs in this area by including a wider range of dairy foods and assessing intervention effects on a more comprehensive lipid panel.
In conclusion, our study indicates that consuming 3.3 servings of dairy/d in the form of milk, yogurt, and cheese, regardless of fat content, does not affect the fasting serum lipid profile or blood pressure compared with a diet virtually free of dairy in males and females with MetS. Even though future research should investigate whether similar outcomes are seen in healthy populations, our findings have important implications for public policy.
Supplementary Material
Acknowledgments
We are deeply indebted to the individuals who volunteered to participate in this trial. We also owe many thanks to the staff of the Fred Hutch Human Nutrition Lab, the Prevention Center, and the Nutrition Assessment Shared Resource, and the staff of the University of Washington Translational Research Unit.
The authors’ responsibilities were as follows—MK, KAS, DKH, JNK, GC, SH, and KMU: designed the research; MK, KAS, JK, DKH, MSB, JNK, and IF: conducted the research; MK, KAS, and MM: analyzed data; KMU: served as the physician of record; JK: completed laboratory procedures for the plasma fatty acid analysis; MK and KAS: wrote the manuscript; MK: has primary responsibility for final content; and all authors: read and approved the final manuscript. This dissertation project of KAS has been funded by an international consortium of dairy organizations, including National Dairy Council, Dairy Farmers of Canada, Dutch Dairy Association (Nederlandse Zuivel Organisatie), Dairy Australia, and the French Dairy Interbranch Organization (CNIEL). MK is a member of the AJCN editorial board and has received honoraria and reimbursements for travel as well as a research grant for this project from several dairy organizations, including National Dairy Council, Dairy Farmers of Canada, Dutch Dairy Association (Nederlandse Zuivel Organisatie), Dairy Australia, and the French Dairy Interbranch Organization (CNIEL). JK has received honoraria and reimbursements for travel as well as research grants from the Vermont Dairy Promotion Council and National Dairy Council. The other authors report no conflicts of interest.
Notes
Supported by contract number 2395 by National Dairy Council, Dairy Farmers of Canada, Dutch Dairy Association (Nederlandse Zuivel Organisatie), Dairy Australia, and the French Dairy Interbranch Organization (CNIEL); NIH grant P30 DK017047 (University of Washington Diabetes Research Center); NIH grant P30 CA015704 (Fred Hutchinson Cancer Research Center Cancer Center Support Grant). KAS was supported in part by grant T32 CA094880 from the NIH. MSB was supported in part by grants R25CA094880, T32DK007247, and T32HL007028 from the NIH. KMU is supported by the Department of Veterans Affairs. This study was initiated by the principal investigator (MK). The dairy-related funding organizations suggested changes to details of the study design prior to the conduct of the study, some of which were implemented. Otherwise, the funding organizations had no impact on the design or conduct of the trial or the analysis and interpretation of study data.
Supplemental Tables 1–4 are available from the “Supplementary data” link in the online posting of the article and from the same link in the online table of contents at https://academic.oup.com/ajcn/.
Abbreviations used: CVD, cardiovascular disease; Fred Hutch, Fred Hutchinson Cancer Research Center; ITT, intent-to-treat; MetS, metabolic syndrome; PL, phospholipids; RCT, randomized controlled trial; Rf, relative flotation rate; RM-ANOVA, repeated-measures ANOVA; UW, University of Washington.
Contributor Information
Kelsey A Schmidt, Division of Public Health Sciences, Fred Hutchinson Cancer Research Center, Seattle, WA, USA; Nutritional Sciences Program, School of Public Health, University of Washington, Seattle, WA, USA.
Gail Cromer, Division of Public Health Sciences, Fred Hutchinson Cancer Research Center, Seattle, WA, USA.
Maggie S Burhans, Division of Public Health Sciences, Fred Hutchinson Cancer Research Center, Seattle, WA, USA; Department of Epidemiology, University of Washington, Seattle, WA, USA.
Jessica N Kuzma, Division of Public Health Sciences, Fred Hutchinson Cancer Research Center, Seattle, WA, USA.
Derek K Hagman, Division of Public Health Sciences, Fred Hutchinson Cancer Research Center, Seattle, WA, USA.
Imashi Fernando, Division of Public Health Sciences, Fred Hutchinson Cancer Research Center, Seattle, WA, USA; Nutritional Sciences Program, School of Public Health, University of Washington, Seattle, WA, USA.
Merideth Murray, Division of Public Health Sciences, Fred Hutchinson Cancer Research Center, Seattle, WA, USA; Nutritional Sciences Program, School of Public Health, University of Washington, Seattle, WA, USA.
Kristina M Utzschneider, VA Puget Sound Health Care System, Seattle, WA, USA; Department of Medicine, University of Washington, Seattle, WA, USA.
Sarah Holte, Division of Public Health Sciences, Fred Hutchinson Cancer Research Center, Seattle, WA, USA.
Jana Kraft, College of Agriculture and Life Sciences, University of Vermont, Burlington, VT, USA.
Mario Kratz, Division of Public Health Sciences, Fred Hutchinson Cancer Research Center, Seattle, WA, USA; Nutritional Sciences Program, School of Public Health, University of Washington, Seattle, WA, USA; Department of Epidemiology, University of Washington, Seattle, WA, USA; Department of Medicine, University of Washington, Seattle, WA, USA.
Data Availability
An anonymized dataset including all data described in the manuscript, code book, and analytic code will be made available upon request to the Principal Investigator (MK).
References
- 1. US Department of Health and Human Services; US Department of Agriculture. 2015–2020 Dietary guidelines for Americans [Internet]. 2015. Available from: https://health.gov/dietaryguidelines/2015/guidelines/. [Google Scholar]
- 2. Nutrition Science Team and Public Health England . The Eatwell guide. London: Public Health England; 2018.; [Google Scholar]
- 3. National Health and Medical Research Council . Eat for health: Australian Dietary Guidelines. Canberra (Australia): Commonwealth of Australia; 2013. [Google Scholar]
- 4. Vorster HH, Badham J, Venter CS. An introduction to the revised food-based dietary guidelines for South Africa. S Afr J Clin Nutr. 2013;26(3):S1–S164. [Google Scholar]
- 5. Ludwig DS, Willett WC. Three daily servings of reduced-fat milk: an evidence-based recommendation?. JAMA Pediatr. 2013;167(9):788–9. [DOI] [PubMed] [Google Scholar]
- 6. Siri-Tarino PW, Sun Q, Hu FB, Krauss RM. Saturated fatty acids and risk of coronary heart disease: modulation by replacement nutrients. Curr Atheroscler Rep. 2010;12(6):384–90. [DOI] [PMC free article] [PubMed] [Google Scholar]
- 7. Calder PC. Functional roles of fatty acids and their effects on human health. J Parenter Enter Nutr. 2015;39(1 Suppl):18S–32S. [DOI] [PubMed] [Google Scholar]
- 8. Astrup A, Bertram HC, Bonjour JP, de Groot LC, de Oliveira Otto MC, Feeney EL, Garg ML, Givens I, Kok FJ, Krauss RMet al. WHO draft guidelines on dietary saturated and trans fatty acids: time for a new approach?. BMJ. 2019;366:l4137. [DOI] [PubMed] [Google Scholar]
- 9. Bechthold A, Boeing H, Schwedhelm C, Hoffmann G, Knuppel S, Iqbal K, Henauw SD, Michels N, Devleesschauwer B, Schlesinger Set al. Food groups and risk of coronary heart disease, stroke and heart failure: a systematic review and dose-response meta-analysis of prospective studies. Crit Rev Food Sci Nutr. 2019;59(7):1071–90. [DOI] [PubMed] [Google Scholar]
- 10. Guo J, Astrup A, Lovegrove JA, Gijsbers L, Givens DI, Soedamah-Muthu SS. Milk and dairy consumption and risk of cardiovascular diseases and all-cause mortality: dose-response meta-analysis of prospective cohort studies. Eur J Epidemiol. 2017;32(4):269–87. [DOI] [PMC free article] [PubMed] [Google Scholar]
- 11. de Oliveira Otto MC, Mozaffarian D, Kromhout D, Bertoni AG, Sibley CT, Jacobs DR Jr, Nettleton JA. Dietary intake of saturated fat by food source and incident cardiovascular disease: the Multi-Ethnic Study of Atherosclerosis. Am J Clin Nutr. 2012;96(2):397–404. [DOI] [PMC free article] [PubMed] [Google Scholar]
- 12. Pimpin L, Wu JH, Haskelberg H, Del Gobbo L, Mozaffarian D. Is butter back? A systematic review and meta-analysis of butter consumption and risk of cardiovascular disease, diabetes, and total mortality. PLoS One. 2016;11(6):e0158118. [DOI] [PMC free article] [PubMed] [Google Scholar]
- 13. Liang J, Zhou Q, Kwame Amakye W, Su Y, Zhang Z. Biomarkers of dairy fat intake and risk of cardiovascular disease: a systematic review and meta analysis of prospective studies. Crit Rev Food Sci Nutr. 2018;58(7):1122–30. [DOI] [PubMed] [Google Scholar]
- 14. Riserus U, Marklund M. Milk fat biomarkers and cardiometabolic disease. Curr Opin Lipidol. 2017;28(1):46–51. [DOI] [PMC free article] [PubMed] [Google Scholar]
- 15. Schwingshackl L, Bogensberger B, Bencic A, Knuppel S, Boeing H, Hoffmann G. Effects of oils and solid fats on blood lipids: a systematic review and network meta-analysis. J Lipid Res. 2018;59(9):1771–82. [DOI] [PMC free article] [PubMed] [Google Scholar]
- 16. de Goede J, Geleijnse JM, Ding EL, Soedamah-Muthu SS. Effect of cheese consumption on blood lipids: a systematic review and meta-analysis of randomized controlled trials. Nutr Rev. 2015;73(5):259–75. [DOI] [PubMed] [Google Scholar]
- 17. Hjerpsted J, Tholstrup T. Cheese and cardiovascular disease risk: a review of the evidence and discussion of possible mechanisms. Crit Rev Food Sci Nutr. 2016;56(8):1389–403. [DOI] [PubMed] [Google Scholar]
- 18. Benatar JR, Sidhu K, Stewart RA. Effects of high and low fat dairy food on cardio-metabolic risk factors: a meta-analysis of randomized studies. PLoS One. 2013;8(10):e76480. [DOI] [PMC free article] [PubMed] [Google Scholar]
- 19. Schmidt KA, Cromer G, Burhans MS, Kuzma JN, Hagman DK, Fernando I, Murray M, Utzschneider KM, Holte S, Kraft Jet al. The impact of diets rich in low-fat or full-fat dairy on glucose tolerance and its determinants: a randomized controlled trial.Am J Clin Nutr. 2020;113:(3):534–47. [DOI] [PMC free article] [PubMed] [Google Scholar]
- 20. Alberti KG, Eckel RH, Grundy SM, Zimmet PZ, Cleeman JI, Donato KA, Fruchart J, James WP, Loria CM, Smith SC Jret al. Harmonizing the metabolic syndrome: a joint interim statement of the International Diabetes Federation Task Force on Epidemiology and Prevention; National Heart, Lung, and Blood Institute; American Heart Association; World Heart Federation; International Atherosclerosis Society; and International Association for the Study of Obesity. Circulation. 2009;120(16):1640–5. [DOI] [PubMed] [Google Scholar]
- 21. Giorgini P, Weder AB, Jackson EA, Brook RD. A review of blood pressure measurement protocols among hypertension trials: implications for “evidence-based” clinical practice. J Am Soc Hypertens. 2014;8(9):670–6. [DOI] [PubMed] [Google Scholar]
- 22. Kratz M, Weigle DS, Breen PA, Meeuws KE, Burden VR, Callahan HS, Matthys CC, Purnell JQ. Exchanging carbohydrate or protein for fat improves lipid-related cardiovascular risk profile in overweight men and women when consumed ad libitum. J Investig Med. 2010;58(5):711–9. [DOI] [PMC free article] [PubMed] [Google Scholar]
- 23. Wolk A, Vessby B, Ljung H, Barrefors P. Evaluation of a biological marker of dairy fat intake. Am J Clin Nutr. 1998;68(2):291–5. [DOI] [PubMed] [Google Scholar]
- 24. Sun Q, Ma J, Campos H, Hu FB. Plasma and erythrocyte biomarkers of dairy fat intake and risk of ischemic heart disease. Am J Clin Nutr. 2007;86(4):929–37. [DOI] [PubMed] [Google Scholar]
- 25. Folch J, Lees M, Sloane Stanley GH. A simple method for the isolation and purification of total lipides from animal tissues. J Biol Chem. 1957;226(1):497–509. [PubMed] [Google Scholar]
- 26. Bainbridge ML, Lock AL, Kraft J. Lipid-encapsulated echium oil (Echium plantagineum) increases the content of stearidonic acid in plasma lipid fractions and milk fat of dairy cows. J Agric Food Chem. 2015;63(19):4827–35. [DOI] [PubMed] [Google Scholar]
- 27. de Souza RJ, Eisen RB, Perera S, Bantoto B, Bawor M, Dennis BB, Samaan Z, Thabane L. Best (but oft-forgotten) practices: sensitivity analyses in randomized controlled trials. Am J Clin Nutr. 2016;103(1):5–17. [DOI] [PubMed] [Google Scholar]
- 28. Krebs-Smith SM, Pannucci TE, Subar AF, Kirkpatrick SI, Lerman JL, Tooze JA, Wilson MM, Reedy J. Update of the Healthy Eating Index: HEI-2015. J Acad Nutr Diet. 2018;118(9):1591–602. [DOI] [PMC free article] [PubMed] [Google Scholar]
- 29. Khaw KT, Sharp SJ, Finikarides L, Afzal I, Lentjes M, Luben R, Forouhi NG. Randomised trial of coconut oil, olive oil or butter on blood lipids and other cardiovascular risk factors in healthy men and women. BMJ Open. 2018;8(3):e020167. [DOI] [PMC free article] [PubMed] [Google Scholar]
- 30. Kris-Etherton PM, Derr J, Mitchell DC, Mustad VA, Russell ME, McDonnell ET, Salabsky D, Pearson TA. The role of fatty acid saturation on plasma lipids, lipoproteins, and apolipoproteins: I. Effects of whole food diets high in cocoa butter, olive oil, soybean oil, dairy butter, and milk chocolate on the plasma lipids of young men. Metabolism. 1993;42(1):121–9. [DOI] [PubMed] [Google Scholar]
- 31. Brassard D, Tessier-Grenier M, Allaire J, Rajendiran E, She Y, Ramprasath V, Gigleux I, Talbot D, Levy E, Tremblay Aet al. Comparison of the impact of SFAs from cheese and butter on cardiometabolic risk factors: a randomized controlled trial. Am J Clin Nutr. 2017;105(4):800–9. [DOI] [PubMed] [Google Scholar]
- 32. Wardlaw GM, Snook JT. Effect of diets high in butter, corn oil, or high-oleic acid sunflower oil on serum lipids and apolipoproteins in men. Am J Clin Nutr. 1990;51(5):815–21. [DOI] [PubMed] [Google Scholar]
- 33. Raziani F, Tholstrup T, Kristensen MD, Svanegaard ML, Ritz C, Astrup A, Raben A. High intake of regular-fat cheese compared with reduced-fat cheese does not affect LDL cholesterol or risk markers of the metabolic syndrome: a randomized controlled trial. Am J Clin Nutr. 2016;104(4):973–81. [DOI] [PubMed] [Google Scholar]
- 34. Steinmetz KA, Childs MT, Stimson C, Kushi LH, McGovern PG, Potter JD, Yamanaka WK. Effect of consumption of whole milk and skim milk on blood lipid profiles in healthy men. Am J Clin Nutr. 1994;59(3):612–8. [DOI] [PubMed] [Google Scholar]
- 35. Nestel PJ, Mellett N, Pally S, Wong G, Barlow CK, Croft K, Mori TA, Meikle PJ. Effects of low-fat or full-fat fermented and non-fermented dairy foods on selected cardiovascular biomarkers in overweight adults. Br J Nutr. 2013;110(12):2242–9. [DOI] [PubMed] [Google Scholar]
- 36. Engel S, Elhauge M, Tholstrup T. Effect of whole milk compared with skimmed milk on fasting blood lipids in healthy adults: a 3-week randomized crossover study. Eur J Clin Nutr. 2018;72(2):249–54. [DOI] [PubMed] [Google Scholar]
- 37. Alonso A, Zozaya C, Vazquez Z, Alfredo Martinez J, Martinez-Gonzalez MA. The effect of low-fat versus whole-fat dairy product intake on blood pressure and weight in young normotensive adults. J Hum Nutr Diet. 2009;22(4):336–42. [DOI] [PubMed] [Google Scholar]
- 38. Sommerfeld M. Trans unsaturated fatty acids in natural products and processed foods. Prog Lipid Res. 1983;22(3):221–33. [DOI] [PubMed] [Google Scholar]
- 39. Rutkowska J, Adamska A, Bialek M. Fatty acid profile of the milk of cows reared in the mountain region of Poland. J Dairy Res. 2012;79(4):469–76. [DOI] [PubMed] [Google Scholar]
- 40. Kratz M, Baars T, Guyenet S. The relationship between high-fat dairy consumption and obesity, cardiovascular, and metabolic disease. Eur J Nutr. 2013;52(1):1–24. [DOI] [PubMed] [Google Scholar]
- 41. McNabney SM, Henagan TM. Short chain fatty acids in the colon and peripheral tissues: a focus on butyrate, colon cancer, obesity and insulin resistance. Nutrients. 2017;9(12):1348. [DOI] [PMC free article] [PubMed] [Google Scholar]
- 42. Hellgren LI. Phytanic acid—an overlooked bioactive fatty acid in dairy fat?. Ann NY Acad Sci. 2010;1190(1):42–9. [DOI] [PubMed] [Google Scholar]
- 43. Endo H, Niioka M, Kobayashi N, Tanaka M, Watanabe T. Butyrate-producing probiotics reduce nonalcoholic fatty liver disease progression in rats: new insight into the probiotics for the gut-liver axis. PLoS One. 2013;8(5):e63388. [DOI] [PMC free article] [PubMed] [Google Scholar]
- 44. Cao H, Gerhold K, Mayers JR, Wiest MM, Watkins SM, Hotamisligil GS. Identification of a lipokine, a lipid hormone linking adipose tissue to systemic metabolism. Cell. 2008;134(6):933–44. [DOI] [PMC free article] [PubMed] [Google Scholar]
- 45. Maeda K, Cao H, Kono K, Gorgun CZ, Furuhashi M, Uysal KT, Cao Q, Atsumi G, Malone H, Krishnan Bet al. Adipocyte/macrophage fatty acid binding proteins control integrated metabolic responses in obesity and diabetes. Cell Metab. 2005;1(2):107–19. [DOI] [PubMed] [Google Scholar]
- 46. Thorning TK, Bertram HC, Bonjour JP, de Groot L, Dupont D, Feeney E, Ipsen R, Lecerf JM, Macie A, McKinley MCet al. Whole dairy matrix or single nutrients in assessment of health effects: current evidence and knowledge gaps. Am J Clin Nutr. 2017;105(5):1033–45. [DOI] [PubMed] [Google Scholar]
- 47. Rosqvist F, Smedman A, Lindmark-Mansson H, Paulsson M, Petrus P, Straniero S, Rudling M, Dahlman I, Risérus U. Potential role of milk fat globule membrane in modulating plasma lipoproteins, gene expression, and cholesterol metabolism in humans: a randomized study. Am J Clin Nutr. 2015;102(1):20–30. [DOI] [PubMed] [Google Scholar]
- 48. Vors C, Joumard-Cubizolles L, Lecomte M, Combe E, Ouchchane L, Drai J, Raynal K, Joffre F, Meiller L, Le Barz Met al. Milk polar lipids reduce lipid cardiovascular risk factors in overweight postmenopausal women: towards a gut sphingomyelin-cholesterol interplay. Gut. 2020;69(3):487–501. [DOI] [PMC free article] [PubMed] [Google Scholar]
Associated Data
This section collects any data citations, data availability statements, or supplementary materials included in this article.
Supplementary Materials
Data Availability Statement
An anonymized dataset including all data described in the manuscript, code book, and analytic code will be made available upon request to the Principal Investigator (MK).