

ABSTRACT
Background
Reports on the adequacy of vitamin D status of pregnant women are not available in Canada.
Objectives
The objectives of this study were to examine vitamin D status across pregnancy and identify the correlates of vitamin D status of pregnant women in Canada.
Methods
Pregnant women (≥18 years) from 6 provinces (2008–2011) participating in a longitudinal cohort were studied. Sociodemographic data, obstetrical histories, and dietary and supplemental vitamin D intakes were surveyed. Plasma 25-hydroxyvitamin D (25OHD) was measured using an immunoassay standardized to LC-MS/MS from samples collected during the first (n = 1905) and third trimesters (n = 1649) and at delivery (n = 1543). The proportion of women with ≥40 nmol/L of plasma 25OHD (adequate status) was estimated at each time point, and factors related to achieving this cut point were identified using repeated-measures logistic regression. Differences in 25OHD concentrations across trimesters and at delivery were tested a using repeated-measures ANOVA with a post hoc Tukey's test.
Results
In the first trimester, 93.4% (95% CI: 92.3%–94.5%) of participants had 25OHD ≥40 nmol/L. The mean plasma 25OHD concentration increased from the first to the third trimester and then declined by delivery (69.8 ± 0.5 nmol/L, 78.6 ± 0.7 nmol/L, and 75.7 ± 0.7 nmol/L, respectively; P < 0.0001). A lack of multivitamin use early in pregnancy reduced the odds of achieving 25OHD ≥40 nmol/L (ORadj = 0.33; 95% CI: 0.25–0.42) across all time points. Factors associated with not using a prenatal multivitamin included multiparity (ORadj = 2.08; 95% CI: 1.42–3.02) and a below-median income (ORadj = 1.39; 95% CI: 1.02–1.89).
Conclusions
The results from this cohort demonstrate the importance of early multivitamin supplement use to achieve an adequate vitamin D status in pregnant women.
Keywords: vitamin D, 25-hydroxyvitamin D, multivitamin, dietary intake, pregnancy
Introduction
Representative data on vitamin D status of pregnant women in Canada are unavailable because national surveillance studies have, to date, not systematically sampled pregnant women. In North America, the recommended intake of vitamin D from food and/or supplemental sources is the same for females of reproductive age as it is for those who are pregnant (1). The Estimated Average Requirement (EAR) of 400 IU/day of vitamin D corresponds to serum 25-hydroxyvitamin D (25OHD) concentrations of 40 nmol/L or above as the population health recommendation for adequate vitamin D status. As a goal for individual intake, 600 IU/day of vitamin D is the RDA in support of serum 25OHD concentrations ≥50 nmol/L.
In the National Health and Nutrition Examination Survey of 2001–2006 (2), serum 25OHD concentrations in the first trimester of pregnancy did not differ from concentrations in nonpregnant females, with 46% of women having serum 25OHD <50 nmol/L. The mean serum 25OHD concentration increased across trimesters, yet 18% of women still had 25OHD <50 nmol/L in the third trimester despite a high rate of vitamin D supplement use (86%). Based on the Canadian Health Measures Survey (2007–2011) and standardized 25OHD assays, 18.1% to 21.3% of females of reproductive age (19–50 years) have plasma concentrations of 25OHD <40 nmol/L, and 36.1% to 39.9% have concentrations <50 nmol/L (3). The latter rate is similar to many (4–10), but not all pregnancy cohort studies conducted in Canada, including a multi-site study with <2% of participants having concentrations of 25OHD <50 nmol/L (11). To the best of our knowledge, no pregnancy study in Canada has reported on the recommended population cut point of serum 25OHD ≥40 nmol/L (1). In addition, the majority of reports predate the launch of the Vitamin D Standardization Certification Program (VDSCP) (12, 13). The VDSCP aims to improve the accuracy and comparability of 25OHD measurements across assays and laboratories around the world. Thus, it has not been possible to identify with confidence the most relevant modifiable and nonmodifiable correlates of the vitamin D status of a pregnant woman.
In Canada, national dietary guidance recommends that all women who could become or are pregnant take a daily multivitamin containing 400 µg (0.4 mg) of folic acid (14). The evidence base to inform public health policy and practice guidelines on whether to recommend that all pregnant women receive a daily multivitamin to support vitamin D status requires additional research. Using data from the Maternal-Infant Research on Environmental Chemicals (MIREC) cohort, we previously reported early second trimester intakes of vitamin D from food and supplements (15). The objectives of the present report were to describe the vitamin D status of women in the MIREC cohort across pregnancy and to identify the modifiable correlates of vitamin D status.
Methods
Participants
The MIREC longitudinal cohort was designed with the major aim of studying the potential role of environmental chemicals on the health of pregnant women (16), and has been described in detail previously (17). The additional objectives regarding vitamin D were planned a priori. Briefly, 2001 participants in this convenience sample were recruited from 11 centers in 6 Canadian provinces from 2008 to 2011. Eligibility criteria of the mothers included: pregnancies with a gestational age (GA) between 6 and 14 weeks, being ≥18 years of age, and having the ability to communicate in English or French in order to provide informed consent and complete surveys. Exclusion criteria were known fetal or chromosomal anomalies in the current pregnancy and serious medical complications. Based on the availability of plasma samples to measure 25OHD, the present report includes 1905 participants who completed the first trimester visit, 1649 who completed the third trimester visit, and 1543 with samples collected at delivery (Figure 1). The socio-demographic and pregnancy characteristics were not different for participants with plasma 25OHD available compared to those without (Table 1).
FIGURE 1.

Participant flow diagram. Abbreviation: GA, gestational age.
TABLE 1.
Maternal characteristics in the first trimester according to vitamin D status assessment
| Variable | Assessed, n = 1905 | Not assessed, n = 78 | P value |
|---|---|---|---|
| Gestational age at visit 1, weeks | 11.5 ± 0.04 | 11.5 ± 0.21 | 0.43 |
| Age, years | 32.2 ± 0.1 | 32.6 ± 0.6 | 0.88 |
| Self-reported as white, n (%) | 1647 (86.5) | 65 (83.3) | 0.43 |
| Canadian born, n (%) | 1551 (81.4) | 61 (78.2) | 0.48 |
| Education, n (%) | 0.27 | ||
| High school or less | 174 (9.1) | 3 (3.8) | |
| College/undergraduate degree | 1243 (65.2) | 53 (67.9) | |
| Graduate degree | 488 (25.6) | 22 (28.2) | |
| Household income, n (%) | |||
| ≤70,000 CAD | 555 (29.1) | 23 (29.5) | 0.34 |
| >70,000 CAD | 1258 (66.1) | 54 (69.2) | |
| Not reported/known | 92 (4.8) | 1 (1.3) | |
| Married/long-term partner, n (%) | 1812 (95.1) | 77 (98.7) | 0.14 |
| Pre-pregnancy BMI, kg/m2 | 24.9 ± 0.4 | 24.8 ± 0.5 | 0.71 |
| Alcohol consumption, n (%) | |||
| None | 1378 (72.3) | 49 (62.8) | 0.0083 |
| Any | 291 (15.3) | 10 (12.8) | |
| Not disclosed/known | 236 (12.4) | 19 (24.4) | |
| Smoking, n (%) | |||
| Never | 1156 (60.7) | 47 (60.3) | 0.17 |
| Former/quit during pregnancy | 633 (33.3) | 30 (38.5) | |
| Current | 115 (6.0) | 1 (1.3) | |
| General health status, n (%) | |||
| Healthy | 1449 (76.1) | 60 (76.9) | 0.83 |
| Chronic condition, any1 | 442 (23.2) | 17 (21.8) | |
| Not disclosed/known | 14 (0.7) | 1 (1.3) | |
| Preeclampsia, n (%) | 56 (2.9) | 3 (3.9) | 0.21 |
| Gestational diabetes, n (%) | 50 (2.8) | 2 (2.7) | 0.74 |
| Parity | |||
| 0 | 837 (43.9) | 39 (50.0) | 0.24 |
| 1 | 768 (40.3) | 32 (41.0) | |
| 2+ | 300 (15.8) | 7 (8.0) | |
| Singleton pregnancy, n (%) | 1860 (97.6) | 74 (94.9) | 0.12 |
| Multivitamin first trimester,2n (%) | 1661 (87.2) | 71 (91.0) | 0.32 |
| Season at recruitment, n (%) | |||
| Winter | 457 (24.0) | 15 (19.2) | 0.35 |
| Spring | 441 (23.1) | 16 (20.5) | |
| Summer | 447 (23.5) | 25 (32.1) | |
| Fall | 560 (29.4) | 22 (28.2) | |
| Fetal outcome, n (%) | |||
| Unsuccessful pregnancy3 | 48 (2.5) | 4 (5.1) | 0.20 |
| Loss of follow-up | 21 (1.1) | 2 (2.6) | |
| Preterm <37 weeks | 136 (7.1) | 7 (9.0) | |
| Term ≥37 weeks | 1700 (89.2) | 65 (83.3) | |
| Size for GA at birth,4n (%) | n = 1784 | n = 68 | 0.73 |
| SGA | 104 (5.8) | 4 (5.9) | |
| AGA | 1450 (81.3) | 53 (77.7) | |
| LGA | 230 (12.9) | 11 (16.2) | |
Data are mean ± SEM or n (%). Differences between continuous variables were tested using a mixed-model ANOVA with center modeled as a random effect; differences in proportions were tested using chi-square or Fisher's exact tests. Abbreviations: AGA, appropriate for gestational age; CAD, Canadian dollars; GA, gestational age: LGA, large for gestational age; SGA, small for gestational age.
Any self-reported health condition (allergies, anemia, arthritis, asthma, cardiac disorders, depression/mental health disorders, diabetes, gastrointestinal disorders, glucose intolerance, gynecological disorders, migraine/headaches, multiple sclerosis, nervous system disorders, osteopenia/osteoporosis, renal conditions, seizures, skin conditions, or thyroid disorders).
Supplement use surveyed at the first trimester visit; data reflect use during the 3 months prior to the visit.
Spontaneous abortion, therapeutic abortion, hydatidiform, ectopic pregnancy, or stillborn.
Weight for gestational age, singleton live births: SGA ≤10.0 and LGA ≥90.0 percentiles [Kramer et al (27)].
This study was conducted according to the guidelines laid down in the Declaration of Helsinki. All procedures involving human participants were approved by the Research Ethics Board at Health Canada (REB# 2006–027H), the Research Ethics Committee at the coordinating center at Sainte-Justine University Hospital in Montreal (REB# 2462), and the academic and hospital ethics committees at each recruiting site.
Participant characteristics
Participants attended study visits in each trimester and at delivery. Demographic data on maternal age, parity, education level, family income, and country of birth were collected from the first trimester questionnaire. Country of birth is a factor related to vitamin D status in pregnancy (18, 19). These data were collected to help inform actions and to help reduce health inequalities (20). Participants were categorized into women born in Canada compared with all other countries, and the countries of origin were further categorized according low-/middle- and high-income countries (21). Maternal weight and height were measured at recruitment and weight was measured at each study visit thereafter. The total weight gain over pregnancy was estimated as the difference between weights measured either at delivery or the last prenatal visit and the self-reported pre-pregnancy weight. The appropriateness of weight gain according to the pre-pregnancy BMI was compared to the Institute of Medicine Guidelines (22, 23) and interpreted according to the GA at delivery. Smoking history over the past 3 months was collected at each visit (ever, presently, frequency, and second-hand exposure), as was alcohol consumption (no or yes, and frequency).
Pregnancy complications, GA at delivery, and infant size at birth were recorded from the medical record to describe the cohort in general and to reflect the maternal vitamin D status over varying durations of pregnancy, and were not considered as exclusion criteria since these would have occurred after recruitment. Pregnancy outcomes were defined in accordance with clinical practice guidelines: preeclampsia (24, 25), gestational diabetes mellitus (26), and preterm birth <37 weeks GA. Birth weight was categorized using the sex-specific Canadian reference charts for birth weight for GA (27); small for GA (SGA, birth weight ≤10th percentile for GA), appropriate for GA (AGA), or large for GA (birth weight ≥90th percentile for GA).
Dietary and supplemental intake of vitamin D
Participants completed a nutrient supplement questionnaire in the first and second trimesters. The first survey was conducted at the recruitment visit and reflected the use of multivitamin supplements in the past 3 months (i.e., before the end of the first trimester). These data were categorized into yes or no categories, as information on the dose could not be verified. Participants were given a survey to complete at home in the second trimester to reflect the past 30 days, including frequency of use, and this was used to examine usual supplemental intakes. The drug identification number on the bottle (Drug Identification Number, Natural Health Product Number, or Homeopathic Medicine Number) and Health Canada's Drug Product Database, Natural Health Product Database, and/or the detailed ingredients list from the product monograph were used to identify multivitamin use and to generate the dosage of supplemental vitamin D. Based on the frequency of use, total vitamin D intake from all supplemental sources was calculated and categorized according to intakes that met the EAR (≥400 IU/d) or not (<400 IU/d), with an additional category for cases where information was not available (i.e., supplement name incomplete, Natural Health Product Number incorrect).
As previously reported (15), during the second trimester visit a 1-month semi-quantitative FFQ was administered. The FFQ consisted of 46 food items and was validated against two 24-hour dietary recalls in a subgroup (n = 115). The frequencies of consuming milk and fortified plant-based beverages (soy or rice) were combined, with data categorized into <2 servings/d or ≥2 servings/d, in which 1 serving was 250 ml. Because in Canada margarine is fortified with vitamin D, margarine intake was categorized into 0, 1–6 and ≥7 servings per week, with an average serving size of a teaspoon. Consumption of fish of any species was categorized as <2 and ≥2 servings per week, with an average serving size of 75 g. Fish species were explored as no servings of fish, consuming fish that contain <100 IU/75 g serving or ≥100 IU/75 g serving, according to the Canadian Nutrient File (28).
Factors related to endogenous synthesis of vitamin D
Because vitamin D can be endogenously synthesized upon exposure to solar ultraviolet beta (UVB) radiation, women were asked to self-report their race as white or nonwhite, as well as to report the natural skin color of the inside of their upper arm (light: white, fair; medium: olive, light brown, medium brown; or dark: dark brown, black) as a proxy for melanin content. As a proxy for UVB exposure, the vitamin D synthesizing period (April 1 through October 31) for Canada (29) was tested. Alternative patterns in response to UVB were explored, including 4 seasons and the month of sampling. The latitude of recruiting centers <45°N included Vancouver, Toronto, Hamilton, Kingston, and Halifax and the latitude of centers ≥45°N included Edmonton, Winnipeg, Sudbury, Ottawa, and Montreal. The latitude of residence (range, 42.9°N to 53.8°N) was based on the first 3 characters of the postal code and used to categorize participants into groups of <45°N and ≥45°N.
Assessment of vitamin D status
Plasma samples collected during the first and third trimester visits and at delivery (17) were used to measure 25OHD and categorize participants as having concentrations <30, <40, <50, and 50–125 nmol/L; we also categorized plasma 25OHD >125 nmol/L to explore concentrations at which there may be concern for adverse effects (1). Two methods were used to measure maternal plasma 25OHD, and results were standardized according to standard reference materials (12, 13). Initially, plasma 25OHD (first trimester: n = 1188; third trimester: n = 762; and delivery: n = 656) was measured using Total 25-hydroxyvitamin D immunoassay kits and the LIAISON autoanalyzer platform (Diasorin Inc.), as previously described (3). Quality control for the LIAISON included Bio-Rad external control samples with a CV% of <10%. Subsequently, the remaining samples were measured using LC-MS/MS. In brief, internal standards [25-hydroxyvitamin D3-(23,24,25,26,27–13C5); 25-hydroxyvitamin D2-(13C3); 3-epi-25-hydroxyvitamin D3-(23,24,25,26,27–13C5); CertiMass Reference Standards, IsoSciences] were added to 150 µl of plasma. Next, zinc sulfate (150 µL of 0.2 M) was mixed in, followed by methanol (600 µL) to denature and precipitate proteins, followed by centrifugation at 2000 RCF for 5 min at 20°C. Extraction of vitamin D metabolites from the supernatant was performed using solid phase extraction (Waters Oasis HLB µElution 96-well plate). Supernatant (600 µL) was added to the solid phase extraction plate, then washed with 5% and 60% methanol (200 µL each), followed by elution and collection with 95:5 methanol:isopropanol (80 µL) and water (50 µL). Were isocratically separated 25OHD3, 25OHD2, and the C-3 epimers on a Waters Acquity HSS PFP UPLC column (1.8 µm, 2.1 × 100 mm) using 68:32 methanol:water. The MS/MS ion transitions were interpreted against a 5-point calibration curve and concentrations calculated based on the response of the internal standards. The LC-MS/MS method is certified through the VDSCP as being traceable to the internationally recognized reference measurement procedures (www.cdc.gc/labstandards/vdscp.html). Through the VDSCP, the overall method bias (accuracy) was 3.1% and the precision was 5.7%. The laboratory has also maintained an annual certification of proficiency in the Vitamin D External Quality Assessment Scheme since 2005 and through the College of American Pathologists since 2012. Due to the use of the 2 different techniques for the analysis of total 25OHD, the original immunoassay results were standardized to the LC-MS/MS method. A subset of samples (n = 115) previously analyzed by the immunoassay were reanalyzed by the LC-MS/MS procedure. Following the procedures outlined by Tian et al. (30) and by utilizing Deming regression analyses, a calibration equation was populated using the original immunoassay results and the LC-MS/MS reanalysis results of the 115 samples selected (standardized y = 5.36 + 0.96; original immunoassay), as described previously (3).
Statistical analyses
Mean (SEM; 95% CI) plasma 25OHD concentrations were computed for each trimester. Proportions within each vitamin D status category (≥40 nmol/L and ≥50 nmol/L) were estimated (%, 95% CI), and differences in proportions at each visit were tested using chi-square analyses (or Fisher's exact test for cells with low counts). Differences in plasma 25OHD concentrations across pregnancy were tested using a mixed-model ANOVA with fixed effects of time of sampling and maternal characteristic, time of sampling (trimesters 1 and 3 and delivery) as a repeated measure, participant as the subject, and recruiting center as a random effect to account for clustering. Interactions between the time of sampling and maternal characteristics were also tested. A different model was fit for each characteristic of interest. Maternal characteristics reflected categories of physiological relevance to pregnancy (age, pre-pregnancy BMI, pregnancy weight gain, food sources of vitamin D, supplemental vitamin D, smoking, parity, pregnancy outcomes), socio-demographics (income, education, marital status, country of birth), and factors related to endogenous synthesis of vitamin D (time of sampling, white/nonwhite race, skin color, and latitude of residence). Where appropriate, post hoc testing was conducted using Tukey's tests and a Tukey-Kramer adjustment for multiple comparisons. The concentration of plasma 25OHD did not vary as a function of singleton compared with multiple pregnancies, general health status, or development of pregnancy complications, nor did it vary as a function of preterm or term birth and infant weight for GA at birth. Thus, the data were analyzed with all pregnancy outcomes combined.
Subsequently, a generalized linear mixed model was used to calculate the odds of having plasma 25OHD ≥40 nmol/L and ≥50 nmol/L according to various maternal characteristics to enable comparison with other studies (8, 11), as well as maternal and environmental factors of not using a multivitamin early in pregnancy while accounting for sociodemographic covariates (age, income, education). A separate model was generated for each characteristic of interest while accounting for time of sampling (first and third trimester and delivery) and interactions; repeated measures were modeled based on the time of sampling and participant. Recruiting center was modeled as a random effect. Models for supplemental intakes ≥400 IU, and FFQ data were generated using data from the third trimester and delivery, and models for not using prenatal vitamins were generated only for the first trimester. All data were analyzed using SAS version 9.4 (SAS Institute Inc.). A probability of <0.05 was accepted as significant. Data are means ± SEMs or 95% CIs unless otherwise reported.
Results
Distribution of vitamin D status
This pregnancy cohort (Table 1) was relatively healthy and of high socioeconomic status, with the majority of pregnancies resulting in healthy singleton AGA infants at term (3514 ± 11 g). Vitamin D status met or exceeded the population cut point of 40 nmol/L of plasma 25OHD in 93.4% (95% CI: 92.3%–94.5%) of participants at the first trimester visit (11.5 ± 0.04 weeks GA; n = 1905), 93.9% (95% CI: 92.7%–95.0%) at the third trimester visit (33.1 ± 0.04 weeks GA; n = 1649), and 91.4% (95% CI: 90.0%–92.8%) at delivery (39.3 ± 0.04 weeks GA; n = 1543). Similarly, 84.5% (95% CI: 82.9%–86.1%), 86.6% (95% CI: 85.0%–88.2%) and 83.9% (95% CI: 82.1%–85.8%) met the 50 nmol/L cut point in the first trimester, in the third trimester, and at delivery, respectively. Very few (<5%) had plasma 25OHD concentrations <30 nmol/L or >125 nmol/L at any time point (Supplemental Table 1).
Vitamin D status according to maternal characteristics
The mean plasma 25OHD concentration increased from the first to third trimester, followed by a small decline at delivery (Table 2). The plasma 25OHD concentration was highest in women ≥30 years of age, with advanced education, above the median income, married or living with a partner, and using a multivitamin in the first trimester; no interactions were observed over time for these variables. The plasma 25OHD concentration was lowest in those with a pre-pregnancy BMI in the obese category, with no interaction with time of sampling. Pregnancy weight gain was not associated with the plasma 25OHD concentration (data not shown). An interaction between time and parity was observed in the plasma 25OHD concentration, where multiparous women had lower concentrations in the third trimester. Mothers who had never smoked or who had quit smoking (first trimester/before pregnancy) had higher plasma 25OHD concentrations compared to current smokers.
TABLE 2.
Plasma 25-hydroxyvitamin D concentration according to time point and maternal socio-demographic and pregnancy characteristics
| Mixed model P values | |||||||||
|---|---|---|---|---|---|---|---|---|---|
| Variable | n | Trimester 1 11.5 ± 0.04 weeks GA | n | Trimester 3 33.1 ± 0.04 weeks GA | n | Delivery 39.3 ± 0.04 weeks GA | Overall mean | Variable | Interaction with time |
| Time, visit | 1905 | 69.8 ± 0.51 | 1649 | 78.6 ± 0.71 | 1543 | 75.7 ± 0.71 | — | <0.0001 | |
| Age, years | — | — | — | — | — | — | — | <0.0034 | 0.39 |
| <30 | 577 | 66.9 ± 0.9 | 504 | 76.0 ± 1.2 | 467 | 74.1 ± 1.2 | 72.0 ± 0.61 | ||
| 30–34 | 677 | 70.9 ± 0.8 | 586 | 80.1 ± 1.1 | 557 | 76.6 ± 1.1 | 75.6 ± 0.6 | ||
| ≥35 | 651 | 71.2 ± 0.8 | 559 | 79.3 ± 1.1 | 519 | 76.1 ± 1.1 | 75.3 ± 0.6 | ||
| Education | — | — | — | — | — | — | — | <0.0001 | 0.67 |
| ≤High school | 174 | 61.3 ± 1.7 | 139 | 69.2 ± 2.2 | 131 | 69.8 ± 2.2 | 66.3 ± 1.21 | ||
| College/bachelors | 1243 | 70.2 ± 0.6 | 1072 | 79.0 ± 0.8 | 1014 | 75.4 ± 0.8 | 74.6 ± 0.4 | ||
| Graduate degree | 488 | 71.7 ± 0.9 | 438 | 80.4 ± 1.4 | 398 | 78.3 ± 1.4 | 76.6 ± 0.7 | ||
| Household income | — | — | — | — | — | — | — | <0.0001 | 0.22 |
| ≤70,000 CAD | 555 | 65.1 ± 0.9 | 475 | 75.0 ± 1.2 | 455 | 72.8 ± 1.2 | 70.6 ± 0.6 | ||
| >70,000 CAD | 1258 | 72.2 ± 0.6 | 1104 | 80.7 ± 0.8 | 1022 | 77.5 ± 0.8 | 76.6 ± 0.41 | ||
| Not reported/known | 92 | 64.4 ± 2.5 | 70 | 69.1 ± 2.6 | 66 | 68.1 ± 3.1 | 66.9 ± 1.6 | ||
| Marital status2 | — | — | — | — | — | — | — | 0.0003 | 0.84 |
| Married/partner | 1812 | 70.1 ± 0.5 | 1575 | 78.9 ± 0.7 | 1470 | 76.1 ± 0.7 | 74.8 ± 0.4 | ||
| Other | 93 | 62.6 ± 2.3 | 74 | 70.8 ± 3.0 | 73 | 66.9 ± 3.3 | 66.4 ± 1.61 | ||
| Pre-pregnancy BMI, kg/m2 | — | — | — | — | — | — | — | <0.0001 | 0.30 |
| Underweight (<18.5) | 51 | 71.7 ± 2.9 | 41 | 82.7 ± 3.1 | 39 | 82.3 ± 3.2 | 78.3 ± 1.8 | ||
| Healthy (18.5–24.9) | 1063 | 72.2 ± 0.6 | 937 | 80.7 ± 0.9 | 864 | 77.7 ± 0.9 | 76.7 ± 0.5 | ||
| Overweight (25.0–29.9) | 386 | 68.9 ± 1.0 | 323 | 76.6 ± 1.4 | 313 | 75.5 ± 1.5 | 73.4 ± 0.8 | ||
| Obese (≥30.0) | 265 | 62.2 ± 1.3 | 228 | 73.1 ± 1.6 | 215 | 69.8 ± 1.7 | 68.0 ± 0.94 | ||
| Not known/available | 140 | 67.1 ± 1.7 | 120 | 75.6 ± 2.8 | 112 | 70.1 ± 2.8 | 70.8 ± 1.45 | ||
| Parity | — | — | — | — | — | — | — | 0.0324 | 0.0007 |
| 0 | 837 | 69.7 ± 0.7 | 740 | 80.8 ± 1.0 | 689 | 77.2 ± 1.05 | 75.6 ± 0.5 | ||
| 1 | 768 | 70.3 ± 0.7 | 656 | 77.4 ± 1.0 | 616 | 74.4 ± 1.06 | 73.8 ± 0.5 | ||
| 2+ | 300 | 68.7 ± 1.3 | 253 | 74.9 ± 1.77 | 238 | 74.5 ± 1.78 | 72.4 ± 0.9 | ||
| Smoking3 | — | — | — | — | — | — | — | <0.0111 | 0.28 |
| Never | 1156 | 70.1 ± 0.6 | 1021 | 79.0 ± 0.8 | 956 | 76.2 ± 0.9 | 74.9 ± 0.4 | ||
| Former/quit in pregnancy | 634 | 70.7 ± 0.8 | 545 | 78.9 ± 1.1 | 499 | 75.3 ± 1.2 | 74.7 ± 0.6 | ||
| Current | 115 | 61.6 ± 1.8 | 83 | 71.2 ± 2.7 | 88 | 72.0 ± 2.9 | 67.6 ± 1.41 | ||
| Multivitamin first trimester3 | — | — | — | — | — | — | — | <0.0001 | 0.30 |
| Yes | 1661 | 71.1 ± 0.5 | 1445 | 79.8 ± 0.7 | 1347 | 76.7 ± 0.7 | 75.6 ± 0.41 | ||
| No | 244 | 60.6 ± 1.5 | 204 | 69.5 ± 1.9 | 196 | 68.6 ± 2.1 | 65.9 ± 1.1 | ||
Data are n, mean ± SEM (nmol/L). Each model included the respective maternal characteristic as a fixed effect and time as a fixed repeated measure; recruitment center was a random effect. Differences among groups were tested using Tukey post hoc tests, with Tukey-Kramer adjustment for multiple comparisons. Abbreviations: CAD, Canadian dollars; GA, gestational age.
Main effects P < 0.05 compared with other group(s) for each variable (time, or maternal characteristic).
Marital status combined for married or with the same partner for over a year. Any other status includes single, divorced, separated, and other.
Supplement use and smoking history over previous 3 months were surveyed at the first trimester visit.
Interaction effect P < 0.05: different from underweight, healthy, and overweight.
Interaction effect P < 0.05: different from healthy.
Interaction effect P < 0.05: all pairwise differences within row.
Parity 2+ group lower than primiparous group.
Values increase from trimester 1 to 3, then stabilize.
Sociodemographic, physiological, and environmental factors relevant to endogenous synthesis of vitamin D (Table 3) that were associated with a higher plasma 25OHD concentration, without interaction over time of sampling, included self-reporting race as white and being born in Canada. Among those born elsewhere, 60.7% were from low-/middle-income countries and 39.3% were from high-income countries. Plasma 25OHD was lowest in the months of November through March and peaked in summer (Supplemental Table 2). Data were subsequently tested across pregnancy based on blood sampling during the vitamin D synthesizing period of April through October; plasma 25OHD was, on average, higher compared to November through March (Table 3). Factors that interacted with the time of sampling included the self-reported skin color and the latitude of residence. Higher plasma 25OHD concentrations were observed in those with either light or medium skin during the first and third trimesters, but only for those with light skin at delivery compared to those with dark skin. Living below 45°N was associated with a reduction in the plasma 25OHD concentration between the third trimester and delivery, while concentrations for those living at or above 45°N did not change significantly.
TABLE 3.
Plasma 25-hydroxyvitamin D concentration according to time and maternal characteristics related to endogenous synthesis of vitamin D
| Mixed model P values | |||||||||
|---|---|---|---|---|---|---|---|---|---|
| Variable | n | Trimester 1 11.5 ± 0.04 weeks GA | n | Trimester 3 33.1 ± 0.04 weeks GA | n | Delivery 39.3 ± 0.04 weeks GA | Overall mean | Variable | Interaction with time |
| Time (visit) | 1905 | 69.8 ± 0.51 | 1649 | 78.6 ± 0.71 | 1543 | 75.7 ± 0.71 | — | <0.0001 | |
| Self-reported | — | — | — | — | — | — | — | <0.0001 | 0.21 |
| White | 1647 | 71.7 ± 0.5 | 1426 | 80.4 ± 0.7 | 1350 | 77.7 ± 0.7 | 76.3 ± 0.41 | ||
| Nonwhite | 258 | 57.8 ± 1.2 | 223 | 66.9 ± 1.7 | 193 | 61.8 ± 1.8 | 61.9 ± 0.9 | ||
| Skin color2 | — | — | — | — | — | — | — | <0.0001 | 0.03 |
| Light | 1452 | 70.8 ± 0.5 | 1262 | 80.2 ± 0.7 | 1184 | 77.7 ± 0.83,4 | 76.0 ± 0.4 | ||
| Medium | 406 | 68.0 ± 1.1 | 347 | 74.7 ± 1.43 | 323 | 70.1 ± 1.45 | 70.8 ± 0.7 | ||
| Dark | 47 | 52.4 ± 3.13 | 40 | 59.0 ± 3.93 | 36 | 59.9 ± 4.8 | 56.7 ± 2.31 | ||
| Country of birth | — | — | — | — | — | — | — | <0.0001 | 0.18 |
| Canada | 1551 | 71.0 ± 0.5 | 1335 | 80.0 ± 0.7 | 1264 | 77.5 ± 0.7 | 75.9 ± 0.81 | ||
| Elsewhere | 354 | 64.4 ± 1.1 | 314 | 72.4 ± 1.6 | 279 | 67.7 ± 1.6 | 68.0 ± 0.4 | ||
| Time of year6 | — | — | — | — | — | — | — | <0.0001 | 0.13 |
| November 1 to March 31 | 867 | 67.4 ± 0.7 | 647 | 74.7 ± 1.0 | 601 | 71.9 ± 1.1 | 70.9 ± 0.51 | ||
| April 1 to October 31 | 1038 | 71.8 ± 0.6 | 1002 | 81.1 ± 0.8 | 942 | 78.1 ± 0.8 | 76.9 ± 0.4 | ||
| Latitude, n (%)7 | — | — | — | — | — | — | — | 0.41 | 0.0032 |
| <45°N | 1080 | 71.3 ± 0.6 | 946 | 79.2 ± 0.9 | 912 | 75.3 ± 0.94 | 75.1 ± 0.4 | ||
| ≥45°N | 825 | 67.8 ± 0.8 | 703 | 77.7 ± 1.0 | 631 | 76.3 ± 1.18 | 73.5 ± 0.5 | ||
Data are n, mean ± SEM (nmol/L). Each model included the respective maternal characteristic as a fixed effect and time as a fixed repeated measure; recruitment center was a random effect. Differences among groups were tested using Tukey post hoc tests, with Tukey-Kramer adjustment for multiple comparisons. Abbreviation: GA, gestational age.
Main effect P < 0.05 compared with other group(s) for each variable (time or maternal characteristic).
2Skin color was self-reported as natural color of inside of inner upper arm: light (white, fair); medium (olive, light/medium brown); dark (dark brown, black).
3Interaction P < 0.05 compared with other groups(s) within time point.
All pair-wise differences within row.
Values increase from trimester 1 to 3, delivery is not different from trimester 1.
April 1 through October 31 represents the period when solar ultraviolet beta radiation is sufficient for endogenous (dermal) synthesis of vitamin D.
Latitude of recruiting centers <45°N included Vancouver, Toronto, Hamilton, Kingston and Halifax; and ≥45°N included Edmonton, Winnipeg, Sudbury, Ottawa and Montreal.
Values increase from trimester 1 to 3, then stabilize.
In the second trimester (Table 4), the number of supplements recorded per participant containing vitamin D ranged from 0 to 4, with a median of 1 (10th quantile, 0; 90th quantile, 2). The median total supplemental vitamin D intake after accounting for dose and frequency of intake was 400 IU (IQR, 200–400 IU); only 4 participants exceeded the Tolerable Upper Intake Level of 4000 IU/d. Those who took a supplement containing ≥400 IU/d of vitamin D—that is, those with above median intakes—had higher plasma 25OHD concentrations in the third trimester and at delivery. In a subgroup analysis using available data for supplemental intake dosages, participants with dosages <400, 400–799, and ≥800 IU/d were compared, showing incremental intakes were associated with incrementally higher mean plasma 25OHD (Supplemental Table 3). The proportions of participants with ≥800 IU/d of total supplemental vitamin D with plasma 25OHD >125 nmol/L were 13.7% (95% CI: 8.5%–18.9%) in trimester 3 and 9.5% (95% CI: 4.9%–14.1%) at delivery; no participants had 25OHD <40 nmol/L in trimester 3 and 3 had 25OHD <40 nmol/L at delivery (33.2, 36.1, and 39.1 nmol/L). Based on the FFQ, consuming 2 or more servings of milk/plant-based beverages daily or consuming any type of fish 2 or more times weekly was also associated with a higher plasma 25OHD concentration. An analysis of specific fish species according to vitamin D content did not improve these results (data not shown). Margarine use did not relate to vitamin D status (P = 0.29). None of these lifestyle variables interacted with time.
TABLE 4.
Plasma 25-hydroxyvitamin D concentration according to time and dietary characteristics across pregnancy
| Mixed model P values | |||||||
|---|---|---|---|---|---|---|---|
| Variable1 | n | Trimester 3 33.1 ± 0.04 weeks GA | n | Delivery 39.3 ± 0.04weeks GA | Overall mean | Variable | Interaction with time |
| Time, visit | 1649 | 78.6 ± 0.72 | 1543 | 75.7 ± 0.72 | — | <0.0001 | |
| Total supplemental vitamin D | — | — | — | — | — | <0.0001 | 0.74 |
| <400 IU/d | 550 | 72.7 ± 1.1 | 509 | 70.3 ± 1.2 | 71.6 ± 0.8 | ||
| ≥400 IU/d | 922 | 82.8 ± 0.8 | 857 | 79.9 ± 0.8 | 81.4 ± 0.62 | ||
| No survey | 177 | 74.4 ± 2.0 | 177 | 71.9 ± 2.0 | 72.7 ± 1.5 | ||
| Milk/plant-based beverages | — | — | — | — | — | <0.0020 | 0.58 |
| <2 servings/d | 952 | 77.0 ± 0.9 | 893 | 73.8 ± 0.9 | 75.4 ± 0.63 | ||
| ≥2 servings/d | 682 | 80.7 ± 1.0 | 625 | 78.1 ± 1.0 | 79.5 ± 0.7 | ||
| No survey | 15 | 82.3 ± 5.4 | 25 | 79.8 ± 5.4 | 80.7 ± 4.0 | ||
| Fish | — | — | — | — | — | 0.0007 | 0.94 |
| <2 servings/wk | 1318 | 77.7 ± 0.7 | 1222 | 74.8 ± 0.8 | 76.3 ± 0.53 | ||
| ≥2 servings/wk | 315 | 81.9 ± 1.4 | 295 | 79.1 ± 1.5 | 80.6 ± 1.0 | ||
| No survey/no answer | 16 | 80.6 ± 5.4 | 26 | 79.2 ± 5.2 | 79.7 ± 3.8 | ||
Data are n, mean ± SEM (nmol/L). Each model included the respective maternal characteristic as a fixed effect and time as a fixed repeated measure; recruitment center was a random effect. Differences among groups were tested using Tukey post hoc tests, with Tukey-Kramer adjustment for multiple comparisons. Abbreviation: GA, gestational age.
Food and supplement use surveyed in the second trimester; data reflect past 30 days intake, including compliance.
Main effect P < 0.05 compared with other group(s) for each variable overall.
Main effect P < 0.05 compared with ≥2 servings group.
Sensitivity analyses were used to explore whether plasma 25OHD concentrations were modified by supplement use in the first trimester, as well as self-reported race as white/nonwhite (P = 0.0008), pre-pregnancy BMI (P = 0.27), and parity (P = 0.47), while accounting for maternal age, education, and income; supplement users still had higher plasma 25OHD concentrations (P < 0.0001) in all models. The only interaction showed that the difference in plasma 25OHD concentrations from not using a supplement was more pronounced in the nonwhite group compared to the other groups (Figure 2). The benefit of using supplements did not interact (P = 0.65) with the UVB exposure period of April through October (Supplemental Figure 1) or with skin color (P = 0.34); likewise, UVB exposure period did not interact with skin color (P = 0.66).
FIGURE 2.
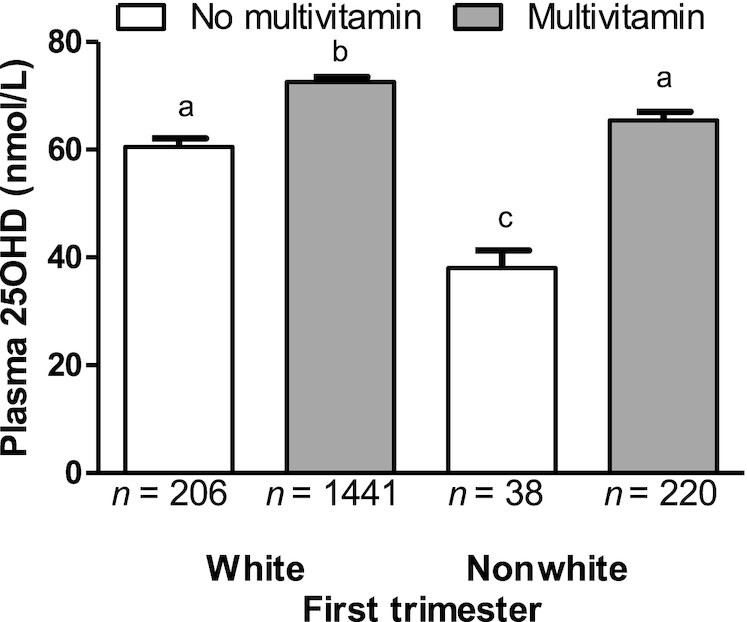
Plasma 25OHD concentration according to prenatal multivitamin supplement use in the first trimester and self-reported race as white or nonwhite. Data are mean ± SEM, n = 1905. Data were compared using a mixed-model ANOVA with supplement use and self-reported race (as white or nonwhite) modeled as fixed effects, and with their interaction. Recruitment center was included as a random effect. P < 0.0008 for fixed effects; P = 0.0049 for interaction; and in post hoc Tukey tests with Tukey-Kramer adjustment for multiple comparisons, P values were <0.0001 for a compared with b, a compared with c, b compared with c. Abbreviation: 25OHD, 25-hydroxyvitamin D.
ORs for achieving adequate vitamin D status
Of the maternal physiological and sociodemographic characteristics (Table 5), those that were associated with lower odds of achieving at least 40 nmol/L of plasma 25OHD throughout pregnancy included a younger maternal age, having no postsecondary education, being below median income, self-reporting race as nonwhite, having dark skin, not being born in Canada, not being married/having no partner, being multiparous (1, or ≥2), having a BMI ≥30 kg/m2, assessment during the UVB void period of November through March, or no use of multivitamins early in pregnancy. These factors remained significant even after adjustment for maternal age, education, income, and the recruiting center, and did not interact with time. Other factors that were associated with lower odds of achieving 40 nmol/L of plasma 25OHD during pregnancy included consuming <400 IU of vitamin D from all supplemental sources and <2 servings of milk/plant-based beverages/d as surveyed in the second trimester. These factors remained significant in models adjusted for covariates and did not interact with time. The same factors were identified if the 50 nmol/L of plasma 25OHD cut point was used (Supplemental Table 4). Smoking history and latitude of residence were not associated with either vitamin D status category (data not shown).
TABLE 5.
ORs for 25-hydroxyvitamin D concentration ≥40 nmol/L according to maternal characteristics
| Categories | Unadjusted | Adjusted1 |
|---|---|---|
| Age, years | ||
| <30 | 0.58 (0.45–0.77) | 0.71 (0.53–0.94) |
| 30–34 | REF | REF |
| ≥35 | 0.85 (0.64–1.13) | 0.84 (0.63–1.11) |
| Education | ||
| ≤High school | 0.51 (0.37–0.71) | 0.62 (0.44–0.88) |
| College/bachelors | REF | REF |
| Graduate degree | 1.19 (0.90–1.56) | 1.12 (0.85–1.47) |
| Household income | ||
| ≤70,000 CAD | 0.62 (0.49–0.79) | 0.73 (0.56–0.93) |
| >70,000 CAD | REF | REF |
| Not reported/known | 0.57 (0.35–0.91) | 0.66 (0.41–1.07) |
| Self-reported | ||
| White | REF | REF |
| Nonwhite | 0.29 (0.22–0.37) | 0.32 (0.24–0.41) |
| Skin color2 | ||
| Light | REF | REF |
| Medium | 0.77 (0.59–1.00) | 0.81 (0.62–1.06) |
| Dark | 0.23 (0.15–0.37) | 0.29 (0.18–0.47) |
| Country of birth | ||
| Canada | REF | REF |
| Elsewhere | 0.57 (0.44–0.73) | 0.57 (0.44–0.74) |
| Marital status3 | ||
| Married/partner | REF | REF |
| Other | 0.47 (0.32–0.70) | 0.63 (0.42–0.95) |
| Parity | ||
| 0 | REF | REF |
| 1 | 0.75 (0.59–0.96) | 0.71 (0.55–0.91) |
| 2+ | 0.53 (0.40–0.71) | 0.52 (0.38–0.70) |
| Pre-pregnancy BMI, kg/m2 | ||
| Underweight (<18.5) | 1.63 (0.63–4.20) | 1.82 (0.71–4.71) |
| Healthy (18.5–24.9) | REF | REF |
| Overweight (25.0–29.9) | 0.77 (0.58–1.02) | 0.79 (0.59–1.05) |
| Obese (≥30.0) | 0.49 (0.37–0.66) | 0.53 (0.40–0.71) |
| Not known/available | 0.71 (0.47–1.08) | 0.82 (0.54–1.25) |
| Time of year4 | ||
| November 1 to March 31 | 0.49 (0.39–0.60) | 0.47 (0.38–0.59) |
| April 1 to October 31 | REF | REF |
| Multivitamin use first trimester5 | ||
| Yes | REF | REF |
| No | 0.31 (0.24–0.39) | 0.33 (0.25–0.42) |
| Total supplemental vitamin D6 | ||
| <400 IU/d | 0.29 (0.21–0.40) | 0.30 (0.22–0.40) |
| ≥400 IU/d | REF | REF |
| No survey | 0.32 (0.21–0.50) | 0.34 (0.22–0.52) |
| Milk/plant-based beverages6 | ||
| <2 servings/d | 0.51 (0.38–0.69) | 0.51 (0.38–0.69) |
| ≥2 servings/d | REF | REF |
Data are ORs (95% CIs) calculated using separate models for each characteristic of interest using a generalized linear mixed model with recruiting center modeled as a random effect. Abbreviation: CAD, Canadian dollars.
ORs (95% CIs) are adjusted for maternal age (years), education category, income (median); education and income were not included in the model when these were the dependent variables.
Skin color was self-reported as the natural color of inside of the inner upper arm: light (white, fair); medium (olive, light/medium brown); or dark (dark brown, black).
Marital status combined for married or with stable partner for over a year; all other marital status categories were combined: single, divorced, separated, and other.
April 1 to October 31 represents the period when solar ultraviolet beta radiation is sufficient for endogenous synthesis of vitamin D.
Multivitamin supplement use was surveyed at the first trimester visit; data reflect use during the 3 months prior to the visit.
Food and supplement use were surveyed in the second trimester; data reflect past 30-day intake including compliance.
The most prominent modifiable factor associated with lower odds of meeting the vitamin D status cut point of ≥40 nmol/L of plasma 25OHD was lack of use of a multivitamin during the first trimester (Supplemental Table 5). Therefore, we conducted further analyses and identified being below the median income and multiparity as factors associated with not taking a multivitamin supplement in the first trimester (Table 6). Self-reported race as white/nonwhite, country of birth, skin color, and pre-pregnancy BMI did not emerge as significant factors for not taking a multivitamin supplement early in pregnancy (data not shown).
TABLE 6.
Factors related to increased odds of not taking a supplement in the first trimester of pregnancy
| Variable | Unadjusted | Adjusted |
|---|---|---|
| Education | ||
| ≤High school | 1.52 (1.00–2.29) | 1.38 (0.88–2.15)1 |
| College/bachelors | REF | REF |
| Graduate degree | 0.88 (0.63–1.22) | 0.92 (0.65, 1.28) |
| Household income | ||
| ≤70,000 CAD | 1.45 (1.10–1.94) | 1.39 (1.02–1.89)2 |
| >70,000 CAD | REF | REF |
| Not reported/known | 1.71 (0.97–3.02) | 1.63 (0.92–2.91) |
| Parity | ||
| 0 | REF | REF |
| 1 | 1.33 (0.98–1.81) | 1.37 (1.01–1.87)3 |
| 2+ | 2.09 (1.46–3.00) | 2.08 (1.42–3.02) |
Data are ORs (95% CIs) calculated using separate models for each characteristic of interest using a generalized linear mixed model with recruiting center modeled as a random effect. Abbreviations: CAD, Canadian dollars.
ORs (95% CIs) are adjusted for maternal age (years) and income.
ORs (95% CIs) are adjusted for maternal age (years) and education.
ORs (95% CIs) are adjusted for maternal age (years), education, and income.
Discussion
In this multisite, longitudinal pregnancy cohort, we identified factors for achieving the cut point of 40 nmol/L of plasma 25OHD, used to evaluate adequacy of the vitamin D status for population health policy in Canada (1). The vitamin D status was ≥40 nmol/L of plasma 25OHD in the majority (>90%) of women in the MIREC cohort, with <5% at risk of vitamin D deficiency (<30 nmol/L). Use of a multivitamin in the first trimester was the most protective modifiable factor associated with adequate vitamin D status. In Canada, national dietary guidance recommends the use of a multivitamin during pregnancy (14). Compliance to this recommendation is consistently high based on national surveys (31) and pregnancy cohorts (8, 9, 11, 32). In agreement with other North American cohorts, nonmodifiable factors associated with a higher vitamin D status included a self-reported white identity, maternal birth in a high-income country, and living with a partner (2, 4, 7, 8, 10, 11, 33).
Reports on vitamin D status are less consistent than those on multivitamin use, possibly due to some that predate the VDSCP (12, 13). Our study had lower proportions of plasma 25OHD <40 nmol/L and <50 nmol/L compared to 2 Canadian pregnancy cohorts published earlier (8, 9); however, the immunoassay was not standardized and, as such, may have underestimated plasma 25OHD concentrations by as much as 10 nmol/L (34). Our findings agree with those of recent studies (10, 11) that reported 2% to 7% of participants had 25OHD <50 nmol/L based on LC-MS/MS. National data suggest that the use of multivitamin supplements reduces the prevalence of an inadequate vitamin D status (6.4%, compared with 15.6% with 25OHD <40 nmol/L) (35) to similar rates as those observed in our study.
Vitamin D status is a composite of intakes and environmental factors. In pregnancy cohorts (7, 15, 32, 36), vitamin D intake from food is, on average, below the EAR. Supplemental intake of vitamin D (400 IU/d) provides almost twice as much vitamin D as food sources (∼240 IU/d) (15) and is the most prominent determinant of vitamin D status in pregnancy (32, 37). In the present report, those that took <400 IU/d of total supplemental vitamin D had lower odds of achieving 25OHD ≥40 nmol/L. Similarly, the odds of meeting this population health target were lower in those who consumed <2 servings of milk/fortified plant-based beverages daily and were lower during the months when UVB is insufficient to elicit endogenous synthesis of vitamin D (29, 32). Melanin in the skin absorbs UVB rays, which can reduce endogenous synthesis of vitamin D (38). As a proxy for melanin, we surveyed skin color. Darker skin was associated with a lower vitamin D status and lower odds of achieving 40 nmol/L of plasma 25OHD, but the sample size was too limited to test for interactions with multivitamin use. Nonetheless, the benefits of multivitamin use did not interact with the UVB exposure period, and even though there was an interaction with self-reporting a white or nonwhite identity, use of a multivitamin was associated with higher vitamin D status in both groups. Since 5 months of pregnancy can overlap with the UVB-void period of November through March, actions to ensure total vitamin D intake meets the EAR throughout the year remain a priority. We and others (32), however, caution that taking multiple supplements containing vitamin D may increase the proportion with plasma 25OHD >125 nmol/L, which is considered the concentration at which the risk of adverse effects increases (1).
We explored both modifiable and nonmodifiable factors in explaining multivitamin use and vitamin D status in the present study to help guide policy and educational strategies. In the United States, sociodemographic factors associated with not taking a multivitamin include obesity and multiparity (39); obesity was not a risk factor after adjustment for multiparity. In our study, 87.2% took a multivitamin in the first trimester, whereas multiparous mothers with 2 or more children were 2 times less likely to take a multivitamin and 50% less likely to have plasma 25OHD ≥40 nmol/L. Plasma 25OHD concentrations were lower among younger women, those with increasing parity, those with a lower income, and those with less education, as well as among those with a maternal country of birth outside of Canada. While many of these factors reduced the odds of achieving 40 nmol/L of plasma 25OHD across pregnancy, parity was significantly associated with supplement use after adjustment for age, income, and education. In addition, a pre-pregnancy BMI ≥30 kg/m2 was associated with a lower plasma 25OHD concentration and lower odds of having ≥40 nmol/L plasma 25OHD compared to a BMI in the recommended range, yet BMI did not interact with multivitamin use or emerge as a factor for adhering to supplement use. Very recent studies show that women with an elevated BMI ≥30 kg/m2 who are adhering to multivitamin supplement use achieve an adequate vitamin D status (32, 37). As such, adherence to multivitamin use appears to be an important modifiable factor that is effective in supporting vitamin D status of pregnant women across the range of sociodemographic characteristics in our cohort.
Several explanations could account for increasing parity as a risk factor for lower adherence to multivitamin use. For example, in a mental health model, if a woman already feels healthy and less vulnerable, she would be less likely to use a supplement (40). In a qualitative study, pregnant women received less dietary and supplement information with increasing parity (41); 1 mother stated, “I think they kind of assumed that I knew it from before.” Research also suggests that family/general physicians compared to obstetricians/gynecologists are less likely to recommend multivitamin supplements (42). Given that 94.9% of prenatal visits in Canada begin on average at 7.5 weeks of gestation (31), reinforcing the importance of a multivitamin supplementation for all pregnancies would be preferential over targeting specific subgroups.
As noted, the 40 nmol/L of plasma 25OHD cut point is for population health assessments, whereas the 50 nmol/L is for assessments of individuals and is mainly supported by studies on bone health (1). The committee that set the EAR and RDA acknowledged that there were not sufficient data for other outcomes, including pregnancy (1). Since that time, ≥50 nmol/L of circulating 25OHD in pregnancy is reported to reduce the risks of preeclampsia (43), gestational diabetes mellitus (44), having an infant with a SGA (45), and preterm birth (46). Of relevance to the interpretation of plasma 25OHD in pregnancy, small declines in plasma 25OHD from the third trimester to delivery are expected (47, 48), in accordance with declines in vitamin D binding protein (49) and albumin (49, 50), the main transport proteins in blood (51). Regardless of which vitamin D status cut point is used or the trimester of pregnancy, the same sociodemographic correlates and protective factors emerged.
This study has important limitations, including the nonrandom convenience sample and, accordingly, the lack of weighted data to produce estimates for specific population subgroups. The response rate was 39%, and those who participated tended to smoke less, be older, and have more education compared to national data (17). The plasma 25OHD concentration is subject to diurnal and circadian rhythms (52). The time of day of plasma collection was not standardized within and among participants. Few participants had plasma 25OHD <40 nmol/L, and although the large sample size enabled us to explore correlates of achieving 40 nmol/L, the sample was too limited to seek multiple interaction terms (e.g., skin tone, BMI). Future larger studies would benefit from an objective assessment of skin tone and assessment of newborn vitamin D status.
In conclusion, the majority of pregnant women in the MIREC cohort had an adequate vitamin D status, with few participants having vitamin D deficiency, which we ascribe to high adherence to multivitamin supplement use early in pregnancy. Factors associated with not taking a multivitamin included multiparity and a lower income. Public health policies should continue to recommend that all women who could become pregnant or who are pregnant take a daily multivitamin supplement. Whether a recommendation pertaining to vitamin D content of the supplement would be beneficial to specific population groups requires further research.
Acknowledgments
We thank the Maternal-Infant Research on Environmental Chemicals (MIREC) Study Group and the MIREC Study staff for their dedication. The cooperation of MIREC participants in providing data and biospecimens is gratefully acknowledged, as is the cooperation of the staff at each recruitment site who diligently recruited and followed the participants throughout their pregnancy. The selection of the samples for standardization of the vitamin D immunoassay results was performed by Lu Tian (Department of Biomedical Data Science, Stanford University, Palo Alto, CA). Branka Jovic (Environmental Health Science and Research Bureau, Healthy Environments and Consumer Safety Branch, Health Canada, Ottawa, Ontario) conducted a duplicate analysis and confirmed the vitamin D dosage data from all supplements.
Author disclosure: The authors report no conflicts of interest.
The authors’ responsibilities were as follows—TEA, WDF, HAW, MF, PvD, MH, ST, GS, and LD: designed the research (cohort conception and design); PvD, MH, ST, GS, LD, KS: conducted research (hands-on conduct of the experiments and data collection); HAW, TML: analyzed data or performed the statistical analysis; HAW, SPJB, KS, MF, TML, MJ, A-SM, LD, BPL, and TEA: wrote the paper (only authors who made a major contribution); HAW: had primary responsibility for the final content; and all authors: contributed to the development of the overall research plan and/or study oversight and read and approved the manuscript.
Notes
The Maternal-Infant Research on Environmental Chemicals (MIREC) Research Platform is supported by the Chemicals Management Plan of Health Canada, the Canadian Institutes for Health Research (grant # MOP–81285) and the Ontario Ministry of the Environment.
Supplemental Tables 1–5 and Supplemental Figure 1 are available from the “Supplementary data” link in the online posting of the article at https://academic.oup.com/ajcn/.
Abbreviations used: AGA, appropriate for gestational age; EAR, Estimated Average Requirement; GA, gestational age; MIREC, Maternal-Infant Research on Environmental Chemicals; SGA, small for gestational age; UVB, ultraviolet beta; VDSCP, Vitamin D Standardization Certification Program; 25OHD, 25-hydroxyvitamin D.
Contributor Information
Hope A Weiler, Nutrition Research Division, Bureau of Nutritional Sciences, Health Products and Food Branch, Health Canada, Ottawa, Ontario, Canada.
Stephen P J Brooks, Nutrition Research Division, Bureau of Nutritional Sciences, Health Products and Food Branch, Health Canada, Ottawa, Ontario, Canada.
Kurtis Sarafin, Nutrition Research Division, Bureau of Nutritional Sciences, Health Products and Food Branch, Health Canada, Ottawa, Ontario, Canada.
Mandy Fisher, Environmental Health Science and Research Bureau, Healthy Environments and Consumer Safety Branch, Health Canada, Ottawa, Ontario, Canada.
Isabelle Massarelli, Bureau of Food Surveillance and Science Integration, Health Products and Food Branch, Health Canada, Ottawa, Ontario, Canada.
The Minh Luong, Bureau of Food Surveillance and Science Integration, Health Products and Food Branch, Health Canada, Ottawa, Ontario, Canada.
Markey Johnson, Exposure Assessment Section, Air Health Science Division, Health Canada, Ottawa, Ontario, Canada.
Anne-Sophie Morisset, École de nutrition, Université Laval, Québec City, Québec, Canada.
Linda Dodds, Department of Obstetrics & Gynecology, Dalhousie University, Halifax, Nova Scotia, Canada; Department of Pediatrics, Dalhousie University, Halifax, Nova Scotia, Canada.
Shayne Taback, Department of Obstetrics, Gynecology and Reproductive Sciences, University of Manitoba, Canada.
Michael Helewa, Department of Obstetrics, Gynecology and Reproductive Sciences, University of Manitoba, Canada.
Peter von Dadelszen, School of Life Course Sciences, King's College London, London, United Kingdom.
Graeme Smith, Department of Obstetrics and Gynaecology, School of Medicine, Faculty of Health Sciences, Queen's University, Kingston, Ontario, Canada.
Bruce P Lanphear, Faculty of Health Sciences, Simon Fraser University, Burnaby, British Columbia, Canada.
William D Fraser, Obstetrics and Gynecology, University of Sherbrooke, Centre de Recherche du Centre Hospitalier Universitaire de Sherbrooke (CRCHUS), Québec, Canada; Sainte-Justine University Hospital and Research Center, University of Montreal, Montreal, Québec, Canada.
Tye E Arbuckle, Environmental Health Science and Research Bureau, Healthy Environments and Consumer Safety Branch, Health Canada, Ottawa, Ontario, Canada.
Data Availability
Data described in the manuscript, codebook, and analytic code will be made available upon request pending [e.g., application and approval at www.mirec-Canada.ca].
References
- 1.Ross AC, Manson JE, Abrams SA, Aloia JF, Brannon PM, Clinton SK, Durazo-Arvizu RA, Gallagher JC, Gallo RL, Jones Get al. The 2011 report on Dietary Reference Intakes for calcium and vitamin D from the Institute of Medicine: what clinicians need to know. J Clin Endocrinol Metab. 2011;96(1):53–8. [DOI] [PMC free article] [PubMed] [Google Scholar]
- 2.Ginde AA, Sullivan AF, Mansbach JM, Camargo CA Jr. Vitamin D insufficiency in pregnant and nonpregnant women of childbearing age in the United States. Am J Obstet Gynecol. 2010;202(5):436.e1–8. [DOI] [PMC free article] [PubMed] [Google Scholar]
- 3.Sarafin K, Durazo-Arvizu R, Tian L, Phinney KW, Tai S, Camara JE, Merkel J, Green E, Sempos CT, Brooks SP. Standardizing 25-hydroxyvitamin D values from the Canadian Health Measures Survey. Am J Clin Nutr. 2015;102(5):1044–50. [DOI] [PMC free article] [PubMed] [Google Scholar]
- 4.Kramer CK, Ye C, Swaminathan B, Hanley AJ, Connelly PW, Sermer M, Zinman B, Retnakaran R. The persistence of maternal vitamin D deficiency and insufficiency during pregnancy and lactation irrespective of season and supplementation. Clin Endocrinol (Oxf). 2016;84(5):680–6. [DOI] [PubMed] [Google Scholar]
- 5.Lacroix M, Battista MC, Doyon M, Houde G, Menard J, Ardilouze JL, Hivert MF, Perron P. Lower vitamin D levels at first trimester are associated with higher risk of developing gestational diabetes mellitus. Acta Diabetol. 2014;51(4):609–16. [DOI] [PubMed] [Google Scholar]
- 6.Lehotay DC, Smith P, Krahn J, Etter M, Eichhorst J. Vitamin D levels and relative insufficiency in Saskatchewan. Clin Biochem. 2013;46(15):1489–92. [DOI] [PubMed] [Google Scholar]
- 7.Li W, Green TJ, Innis SM, Barr SI, Whiting SJ, Shand A, von Dadelszen P. Suboptimal vitamin D levels in pregnant women despite supplement use. Can J Public Health. 2011;102(4):308–12. [DOI] [PMC free article] [PubMed] [Google Scholar]
- 8.Woolcott CG, Giguere Y, Weiler HA, Spencer A, Forest JC, Armson BA, Dodds L. Determinants of vitamin D status in pregnant women and neonates. Can J Public Health. 2016;107(4-5):e410–e6. [DOI] [PMC free article] [PubMed] [Google Scholar]
- 9.Wei SQ, Audibert F, Hidiroglou N, Sarafin K, Julien P, Wu Y, Luo ZC, Fraser WD. Longitudinal vitamin D status in pregnancy and the risk of pre-eclampsia. BJOG. 2012;119(7):832–9. [DOI] [PubMed] [Google Scholar]
- 10.Perreault M, Moore CJ, Fusch G, Teo KK, Atkinson SA. Factors associated with serum 25-hydroxyvitamin D concentration in two cohorts of pregnant women in Southern Ontario, Canada. Nutrients. 2019;11(1):123, doi: 10.3390/nu11010123. [DOI] [PMC free article] [PubMed] [Google Scholar]
- 11.Aghajafari F, Field CJ, Kaplan BJ, Rabi DM, Maggiore JA, O'Beirne M, Hanley DA, Eliasziw M, Dewey D, Weinberg Aet al. The current recommended vitamin D intake guideline for diet and supplements during pregnancy is not adequate to achieve vitamin D sufficiency for most pregnant women. PLoS One. 2016;11(7):e0157262. [DOI] [PMC free article] [PubMed] [Google Scholar]
- 12.Phinney KW, Sempos CT, Tai SS, Camara JE, Wise SA, Eckfeldt JH, Hoofnagle AN, Carter GD, Jones J, Myers GLet al. Baseline assessment of 25-hydroxyvitamin D reference material and proficiency testing/external quality assurance material commutability: a Vitamin D Standardization Program study. J AOAC Int. 2017;100(5):1288–93. [DOI] [PubMed] [Google Scholar]
- 13.Cashman KD, Kiely M, Kinsella M, Durazo-Arvizu RA, Tian L, Zhang Y, Lucey A, Flynn A, Gibney MJ, Vesper HWet al. Evaluation of Vitamin D Standardization Program protocols for standardizing serum 25-hydroxyvitamin D data: a case study of the program's potential for national nutrition and health surveys. Am J Clin Nutr. 2013;97(6):1235–42. [DOI] [PMC free article] [PubMed] [Google Scholar]
- 14.Health Canada . Prenatal nutrition guidelines for health professionals, Minister of Health Canada. Ottawa (Canada); 2009. [Google Scholar]
- 15.Morisset AS, Weiler HA, Dubois L, Ashley-Martin J, Shapiro GD, Dodds L, Massarelli I, Vigneault M, Arbuckle TE, Fraser WD. Rankings of iron, vitamin D, and calcium intakes in relation to maternal characteristics of pregnant Canadian women. Appl Physiol Nutr Metab. 2016;41(7):749–57. [DOI] [PubMed] [Google Scholar]
- 16.Arbuckle TE, Liang CL, Morisset AS, Fisher M, Weiler H, Cirtiu CM, Legrand M, Davis K, Ettinger AS, Fraser WDet al. Maternal and fetal exposure to cadmium, lead, manganese and mercury: the MIREC study. Chemosphere. 2016;163:270–82. [DOI] [PubMed] [Google Scholar]
- 17.Arbuckle TE, Fraser WD, Fisher M, Davis K, Liang CL, Lupien N, Bastien S, Velez MP, von Dadelszen P, Hemmings DGet al. Cohort profile: the maternal-infant research on environmental chemicals research platform. Paediatr Perinat Epidemiol. 2013;27(4):415–25. [DOI] [PubMed] [Google Scholar]
- 18.Schneuer FJ, Roberts CL, Guilbert C, Simpson JM, Algert CS, Khambalia AZ, Tasevski V, Ashton AW, Morris JM, Nassar N. Effects of maternal serum 25-hydroxyvitamin D concentrations in the first trimester on subsequent pregnancy outcomes in an Australian population. Am J Clin Nutr. 2014;99(2):287–95. [DOI] [PubMed] [Google Scholar]
- 19.Krieger JP, Cabaset S, Canonica C, Christoffel L, Richard A, Schroder T, von Wattenwyl BL, Rohrmann S, Lotscher KQ. Prevalence and determinants of vitamin D deficiency in the third trimester of pregnancy: a multicentre study in Switzerland. Br J Nutr. 2018;119(3):299–309. [DOI] [PubMed] [Google Scholar]
- 20.Canadian Institute for Health Information . Proposed standards for race-based and indigenous identity data collection and health reporting in Canada. Ottawa (Canada); 2020. [Google Scholar]
- 21.World Bank . Country and lending groups. [Internet]. Washington (DC): The World Bank Group; 2014. [Accessed 2020 Sep 23]. Available from: http://data.worldbank.org/about/country-classifications/country-and-lending-groups [Google Scholar]
- 22.Dzakpasu S, Fahey J, Kirby RS, Tough SC, Chalmers B, Heaman MI, Bartholomew S, Biringer A, Darling EK, Lee LSet al. Contribution of prepregnancy body mass index and gestational weight gain to adverse neonatal outcomes: Population attributable fractions for Canada. BMC Pregnancy Childbirth. 2015;15:21. [DOI] [PMC free article] [PubMed] [Google Scholar]
- 23.IOM (Institute of Medicine) and NRC (National Research Council) , Weight gain during pregnancy: reexamining the guidelines. 2009. p. 241–62., The National Academies Press, Washington (DC). [PubMed] [Google Scholar]
- 24.Camara LR, Arbuckle TE, Trottier H, Fraser WD. Associations between maternal exposure to bisphenol A or triclosan and gestational hypertension and preeclampsia: the MIREC Study. Am J Perinatol. 2019;36(11):1127–35. [DOI] [PubMed] [Google Scholar]
- 25.Magee LA, Pels A, Helewa M, Rey E, von Dadelszen P; Canadian Hypertensive Disorders of Pregnancy Working Group . Diagnosis, evaluation, and management of the hypertensive disorders of pregnancy: executive summary. J Obstet Gynaecol Can. 2014;36(5):416–38. [DOI] [PubMed] [Google Scholar]
- 26.Shapiro GD, Dodds L, Arbuckle TE, Ashley-Martin J, Fraser W, Fisher M, Taback S, Keely E, Bouchard MF, Monnier Pet al. Exposure to phthalates, bisphenol A and metals in pregnancy and the association with impaired glucose tolerance and gestational diabetes mellitus: the MIREC study. Environ Int. 2015;83:63–71. [DOI] [PubMed] [Google Scholar]
- 27.Kramer MS, Platt RW, Wen SW, Joseph KS, Allen A, Abrahamowicz M, Blondel B, Breart G; Fetal/Infant Health Study Group of the Canadian Perinatal Surveillance System . A new and improved population-based Canadian reference for birth weight for gestational age. Pediatrics. 2001;108(2):e35. [DOI] [PubMed] [Google Scholar]
- 28.Health Canada . Canadian Nutrient File. [Internet]. 2015, Minister of Health, Ottawa, Canada, [Accessed May 6, 2020]. Available from: https://food-nutrition.canada.ca/cnf-fce/index-eng.jsp [Google Scholar]
- 29.Webb AR, DeCosta BR, Holick MF. Sunlight regulates the cutaneous production of vitamin D3 by causing its photodegradation. J Clin Endocrinol Metab. 1989;68(5):882–7. [DOI] [PubMed] [Google Scholar]
- 30.Tian L, Durazo-Arvizu RA, Myers G, Brooks S, Sarafin K, Sempos CT. The estimation of calibration equations for variables with heteroscedastic measurement errors. Statist Med. 2014;33:4420–36. [DOI] [PubMed] [Google Scholar]
- 31.Public Health Agency of Canada . What mothers say: the Canadian Maternity Experiences Survey, Her Majesty the Queen in Right of Canada. Ottawa (Canada); 2009. [Google Scholar]
- 32.Perreault M, Atkinson SA, Meyre D, Fusch G, Mottola MF, Team BS. Summer season and recommended vitamin D intake support adequate vitamin D status throughout pregnancy in healthy Canadian women and their newborns. J Nutr. 2020;150(4):739–46. [DOI] [PubMed] [Google Scholar]
- 33.Scholl TO, Chen X, Stein TP. Vitamin D, secondary hyperparathyroidism, and preeclampsia. Am J Clin Nutr. 2013;98(3):787–93. [DOI] [PMC free article] [PubMed] [Google Scholar]
- 34.Schottker B, Jansen EH, Haug U, Schomburg L, Kohrle J, Brenner H. Standardization of misleading immunoassay based 25-hydroxyvitamin D levels with liquid chromatography tandem-mass spectrometry in a large cohort study. PLoS One. 2012;7(11):e48774. [DOI] [PMC free article] [PubMed] [Google Scholar]
- 35.Whiting SJ, Langlois KA, Vatanparast H, Greene-Finestone LS. The vitamin D status of Canadians relative to the 2011 Dietary Reference Intakes: an examination in children and adults with and without supplement use. Am J Clin Nutr. 2011;94(1):128–35. [DOI] [PubMed] [Google Scholar]
- 36.Dubois L, Diasparra M, Bedard B, Colapinto CK, Fontaine-Bisson B, Tremblay RE, Fraser WD. Adequacy of nutritional intake during pregnancy in relation to prepregnancy BMI: results from the 3D cohort study. Br J Nutr. 2018;120(3):335–44. [DOI] [PubMed] [Google Scholar]
- 37.Savard C, Bielecki A, Plante A-S, Lemieux S, Gagnon C, Weiler H, Morisset A-S. Longitudinal assessment of vitamin D status across trimesters of pregnancy. J Nutr. 2021, Accessed April 8, 2021, doi: 10.1093/jn/nxab060, PMID: 33830266. [DOI] [PMC free article] [PubMed] [Google Scholar]
- 38.Mendes MM, Darling AL, Hart KH, Morse S, Murphy RJ, Lanham-New SA. Impact of high latitude, urban living and ethnicity on 25-hydroxyvitamin D status: a need for multidisciplinary action?. J Steroid Biochem Mol Biol. 2019;188:95–102. [DOI] [PubMed] [Google Scholar]
- 39.Masho SW, Bassyouni A, Cha S. Pre-pregnancy obesity and non-adherence to multivitamin use: findings from the National Pregnancy Risk Assessment Monitoring System (2009–2011). BMC Pregnancy Childbirth. 2016;16(1):210, doi: 10.1186/s12884-016-1002-0. [DOI] [PMC free article] [PubMed] [Google Scholar]
- 40.Fulford B, Macklon N, Boivin J. Mental models of pregnancy may explain low adherence to folic acid supplementation guidelines: a cross-sectional international survey. Eur J Obstet Gynecol Reprod Biol. 2014;176:99–103. [DOI] [PubMed] [Google Scholar]
- 41.Bouga M, Lean MEJ, Combet E. Iodine and pregnancy–a qualitative study focusing on dietary guidance and information. Nutrients. 2018;10(4), 408, doi: 10.3390/nu10040408). [DOI] [PMC free article] [PubMed] [Google Scholar]
- 42.Williams JL, Abelman SM, Fassett EM, Stone CE, Petrini JR, Damus K, Mulinare J. Health care provider knowledge and practices regarding folic acid, United States, 2002–2003. Matern Child Health J. 2006;10(S1):S67–72. [DOI] [PMC free article] [PubMed] [Google Scholar]
- 43.Hypponen E, Cavadino A, Williams D, Fraser A, Vereczkey A, Fraser WD, Banhidy F, Lawlor D, Czeizel AE. Vitamin D and pre-eclampsia: original data, systematic review and meta-analysis. Ann Nutr Metab. 2013;63(4):331–40. [DOI] [PubMed] [Google Scholar]
- 44.Hu L, Zhang Y, Wang X, You L, Xu P, Cui X, Zhu L, Ji C, Guo X, Wen J. Maternal vitamin D status and risk of gestational diabetes: a meta-analysis. Cell Physiol Biochem. 2018;45(1):291–300. [DOI] [PubMed] [Google Scholar]
- 45.Wei SQ, Qi HP, Luo ZC, Fraser WD. Maternal vitamin D status and adverse pregnancy outcomes: a systematic review and meta-analysis. J Matern Fetal Neonatal Med. 2013;26(9):889–99. [DOI] [PubMed] [Google Scholar]
- 46.Zhou SS, Tao YH, Huang K, Zhu BB, Tao FB. Vitamin D and risk of preterm birth: up-to-date meta-analysis of randomized controlled trials and observational studies. J Obstet Gynaecol Res. 2017;43(2):247–56. [DOI] [PubMed] [Google Scholar]
- 47.Best CM, Pressman EK, Queenan RA, Cooper E, O'Brien KO. Longitudinal changes in serum vitamin D binding protein and free 25-hydroxyvitamin D in a multiracial cohort of pregnant adolescents. J Steroid Biochem Mol Biol. 2019;186:79–88. [DOI] [PMC free article] [PubMed] [Google Scholar]
- 48.Fernandez-Alonso AM, Dionis-Sanchez EC, Chedraui P, Gonzalez-Salmeron MD, Perez-Lopez FR; Spanish Vitamin D and Women's Health Research Group. First-trimester maternal serum 25-hydroxyvitamin D(3) status and pregnancy outcome. Int J Gynaecol Obstet. 2012;116(1):6–9. [DOI] [PubMed] [Google Scholar]
- 49.Zhang JY, Lucey AJ, Horgan R, Kenny LC, Kiely M. Impact of pregnancy on vitamin D status: a longitudinal study. Br J Nutr. 2014;112(7):1081–7. [DOI] [PubMed] [Google Scholar]
- 50.Klajnbard A, Szecsi PB, Colov NP, Andersen MR, Jørgensen M, Bjørngaard B, Barfoed A, Haahr K, Stender S. Laboratory reference intervals during pregnancy, delivery and the early postpartum period. Clin Chem Lab Med. 2010;48(2):237–48. [DOI] [PubMed] [Google Scholar]
- 51.Tsuprykov O, Buse C, Skoblo R, Haq A, Hocher B. Reference intervals for measured and calculated free 25-hydroxyvitamin D in normal pregnancy. J Steroid Biochem Mol Biol. 2018;181:80–7. [DOI] [PubMed] [Google Scholar]
- 52.Jones KS, Redmond J, Fulford AJ, Jarjou L, Zhou B, Prentice A, Schoenmakers I. Diurnal rhythms of vitamin D binding protein and total and free vitamin D metabolites. J Steroid Biochem Mol Biol. 2017;172:130–5. [DOI] [PMC free article] [PubMed] [Google Scholar]
Associated Data
This section collects any data citations, data availability statements, or supplementary materials included in this article.
Data Availability Statement
Data described in the manuscript, codebook, and analytic code will be made available upon request pending [e.g., application and approval at www.mirec-Canada.ca].