

Obesity is the scourge of our era. The Centers for Disease Control regards obesity as the main contributing factor to the United States’ top two killers: cardiovascular disease and diabetes. Ferris et al. stated, “Past civilizations saw excess body fat as a symbol of wealth and prosperity as the general population struggled with food shortages and famine” (1). We now know that obesity affects poor and rich countries, with the former worse off because of fewer resources for clinical and economic costs of disease. The obesity epidemic is best analyzed as a meta-system, defined as a complex system made up of different interacting subsystem—such as the environmental subsystem (e.g., access to healthy foods, exercise locations), the physiologic subsystem (e.g., interaction between microbiome and metabolism), and social behavioral subsystem (e.g., peer-influenced diets) (Figure 1)—rather than a linear, single-factor cause-and-effect relationship (2,3). Fully characterizing these systems and their interactions is difficult with traditional research and data collection methods alone. The advent of Big Data opens new opportunities, and the key is combining it with new systems methods.
Figure 1.
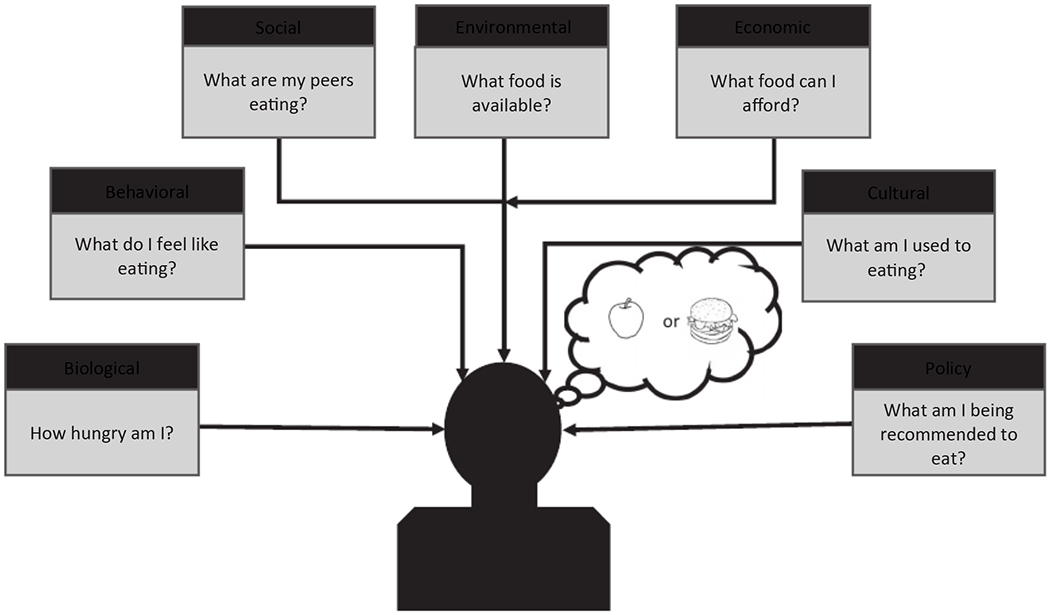
A systems view of the obesity problem is multidimensional and recursive
There are many definitions of Big Data, such as Gandomi and Haider’s, “high-volume, high-velocity and high-variety information assets that demand cost-effective, innovative forms of information processing for enhanced insight and decision making” (4). Others have subsequently added more “V’s” to the definition, including low veracity (may be inherently unreliable but not necessarily unusable), high variability (can flow at different rates from many sources), and low value to volume ratio (4). Although traditional health research data (e.g., questionnaires, interviews) is often collected with the intent to answer specific questions, evaluate hypotheses, or track established sets of measures, Big Data tends to be a by-product of activities (e.g., Twitter use) or events (e.g., online purchases) that require paring down and organization before they can be used for scientific purposes. To characterize people’s behavior, traditional research may systematically observe and record their decisions to understand specific characteristics among groups (e.g., researchers directly observed students to track their physical activity in school (5)). This approach limits the sample size, diversity, and range of behaviors assessed. By contrast, existing Big Data sources, such as the combination of Twitter feeds and WebMD searches, can demonstrate the connection between social conversations and emerging medical concerns for broad swathes of the population, thus providing insights into how social networks might drive health consumption behaviors.
Although Big Data is messier and potentially challenging to organize, it costs less to acquire and can provide novel insights on obesity. For example, food diaries may not accurately represent a person’s total diet because they only offer snapshots in time and people often do not remember exactly what they ate or how much (6). Large-sample consumer purchasing data can supplement questionnaires but does not reflect the intricate relationships hidden in the data (e.g., who consumes the food, when, and how much is wasted) if standard epidemiological analysis is applied. Without accounting for these intricacies, such techniques yield limited insights on cause-and-effect relationships because traditional data collection methods still lack an agreed upon and accurate framework for drawing causal connections (7). Complex system simulations are able to accommodate both types of data simultaneously, negating the choice between traditional and Big Data. The advantage of systems simulations is that they can accommodate multiscale data and can embed temporality (i.e., time lags) into the model, taking advantage of known causal relationships where available, while discovering new relationships where theory is silent.
Therefore, to utilize Big Data to inform obesity prevention and control, it will be important to apply both “top-down” and “bottom-up” systems methods. Top-down approaches are analogous to “hovering over” data and searching for patterns that give insight to systems structure and function. This includes traditional epidemiological statistical methods, such as multivariate regressions looking for correlations between variables and particular outcomes and using different methods of visualizing data (e.g., graphs, charts) to elucidate potential associations. Top-down approaches are helpful for discovery, identifying potential associations, or helping develop hypotheses. However, they cannot establish cause and effect and thus may overlook complexities. In bottom-up approaches, the goal is to rebuild the system. It is difficult to understand a system until you try to build it, determining the actual components and structures that comprise the system and attempting to represent the specific mechanisms of how they interact with each other. Top-down approaches start with data and then try to generate insights; conversely, bottom-up approaches start with conceptualization of the system and its components, structure, and mechanisms and then use data to populate, calibrate, and adjust this conceptualization. For example, a systems model uses mathematical algorithms to dynamically represent the components, relationships, and mechanistic processes of a system and serve as a “virtual laboratory.” Changes in one part of the system can be examined for first- and second-order effects on other parts of the system, helping policy makers determine which parts of the system are working well or failing and how policies and interventions might alter outcomes. For example, our previous modeling study showed that implementing sugar-sweetened beverage warning labels may reduce obesity prevalence under a variety of circumstances (8).
Systems approaches allow for the inclusion of all types of data, both traditional and Big Data, into a model. Multiscale models are particularly powerful because they can yield information about population level interventions in the absence of data that complies with standard statistical distribution assumptions. More importantly, machine learning allows for the discovery of relationships in Big Data when hypothesis-driven tests are not well formed. For example, although some genes are predictive of abdominal obesity in mice (9), interactions with environmental influences are just as, if not more, important in explaining obesity incidence in the population (10). Determining an intervention’s impact can be challenging without complex systems simulations.
Big Data holds the potential to improve obesity prevention and control. But unless obesity-related research takes a systems approach, Big Data may simply lead to continued misunderstandings of cause and effect. It is necessary to use both top-down and bottom-up approaches to determine the most effective types of multiscale and multicomponent interventions to combat the obesity epidemic.
Funding agencies:
This work was supported in part by US Agency for International Development (under Agreement AID-OAA-A-15-00064), the Eunice Kennedy Shriver National Institute of Child Health and Human Development (grants U54HD070725, U01HD086861 and 5R01HD086013-02), and the National Institute of General Medical Sciences via the Models of Infectious Disease Agent Study network (grant 1 R01 GM127512-01A1). The funders did not have any role in writing the manuscript or the decision to submit the manuscript for publication. The authors of this manuscript are responsible for its content, including data analysis. Statements in the manuscript do not necessarily represent the official views of or imply endorsement by the NIH or HHS.
Footnotes
Disclosure:
The authors declared no conflict of interest.
References
- 1.Ferris W, Crowther N. Once fat was fat and that was that: our changing perspectives on adipose tissue. Cardiovasc J Afr 2011;22:147–154. [DOI] [PMC free article] [PubMed] [Google Scholar]
- 2.Newell B, Proust K, Dyball R, McManus P. Seeing obesity as a systems problem. N S W Public Health Bull 2008;18:214–218. [DOI] [PubMed] [Google Scholar]
- 3.Lee BY, Bartsch SM, Mui Y, Haidari LA, Spiker ML, Gittelsohn J. A systems approach to obesity. Nutr Rev 2017;75:94–106. [DOI] [PMC free article] [PubMed] [Google Scholar]
- 4.Gandomi A, Haider M. Beyond the hype: big data concepts, methods, and analytics. Int J Inf Manage 2015;35:137–144. [Google Scholar]
- 5.McKenzie TL, Marshall SJ, Sallis JF, Conway TL. Leisure-time physical activity in school environments: an observational study using SOPLAY. Prev Med 2000;30:70–77. [DOI] [PubMed] [Google Scholar]
- 6.Schatzkin A, Kipnis V, Carroll RJ, et al. A comparison of a food frequency questionnaire with a 24-hour recall for use in an epidemiological cohort study: results from the biomarker-based Observing Protein and Energy Nutrition (OPEN) study. Int J Epidemiol 2003;32:1054–1062. [DOI] [PubMed] [Google Scholar]
- 7.Hernáan MA, Hsu J, Healy B. A second chance to get causal inference right: a classification of data science tasks. Chance 2019;32:42–49. [Google Scholar]
- 8.Lee BY, Ferguson MC, Hertenstein DL, et al. Simulating the impact of sugar-sweetened beverage warning labels in three cities. Am J Prev Med 2018;54:197–204. [DOI] [PMC free article] [PubMed] [Google Scholar]
- 9.Yang X, Deignan JL, Qi H, et al. Validation of candidate causal genes for obesity that affect shared metabolic pathways and networks. Nat Genet 2009;41:415–423. [DOI] [PMC free article] [PubMed] [Google Scholar]
- 10.Campion J, Milagro F, Martinez J. Individuality and epigenetics in obesity. Obes Rev 2009;10:383–392. [DOI] [PubMed] [Google Scholar]