

Abstract
The COVID-19 pandemic has disrupted the industrial supply chain globally. The automotive sector in India has also suffered and are trying surviving while reviewing and reinventing business models, structures and processes, to cope with this unprecedented crisis. This study is of an Indian auto OEM major as it focused upon training its downstream partners, to counter a situation of complete lock-down due to the pandemic. The authors attempt to develop a service excellence framework, based upon their unique engagement with 100 plus auto dealers. Critical success factors are identified based on the dynamics between the success factors using the Decision Making Trial and Evaluation Laboratory (DEMATEL) approach. Customer relationship management, service excellence and operations excellence at the dealership level were found to be the key ingredients for survival and success of both the channel partners and the OEM. Service quality benchmarking, People development and Process mapping, were found to be key enablers of excellence in times of crises, creating customer delight and efficient inventory management. Effective communication with staff and inventory management are critical to success, especially in tough times. Customer satisfaction, inventory turnover and revenue from new business are key metrics of success to be focused upon during such times. This is a possible future area for research in managing crises.
Keywords: Downstream innovation, Service excellence, Enablers, Metrics, DEMATEL approach, CRM, Operations excellence
Introduction
The automotive industry accounts for 7.1% of India’s GDP, provides employment to an estimated 35 million people, with a 4.3% share in Indian exports. In India it includes Indian and multinational companies and ranks as the world's largest tractor, two-wheeler and three-wheeler manufacturer; the second largest bus manufacturer; the third largest heavy truck manufacturer; and the fourth largest car manufacturer (Bajwa, 2020).
The COVID-19 pandemic severely affected (Deshmukh & Haleem, 2020) the manufacturing industry and automotive sector, in particular. Ancillary units, original equipment manufacturers (OEMs), and auto retail businesses were shut down between April and June 2020. The industry suffered a loss of 312.8 million USD per day and an estimated loss of 345,000 jobs (Press Trust of India, 2020). In the 2nd wave during April–May 2021, most major auto OEMs saw declining monthly sales. The top three passenger vehicle sellers saw sales decline between March and April 2021. Commercial vehicles (CVs) fared worse with sales declining from 74.2 to 49.5% for the top three Indian CV sellers. The largest domestic two-wheeler company reported a 37% drop in sales in the above period. Companies say that while demand for vehicles is decent, there are challenges ahead in supply chain, dealership activity and customer movement due to localized restrictions imposed by states in the 2nd wave. (Chaudhary, 2021). The aftermath of the current pandemic on the Indian auto sector is predicted to last till 2023.
Indian Auto OEMs conventionally employ selective distribution networks and auto retailers exclusively partner with individual OEMs, investing separately on OEM authorized service businesses to tap into the spares, service and accessories revenue streams alongside new vehicle sales. Retailers also channelize financial services viz. auto loans and insurance.
The current paper explores whether and how, innovations at the retail end of the automotive value-chain can be focused upon to revive the fortunes of the auto sector.
Downstream innovation within a value chain has emerged as an area of focus for companies as products/markets mature, commoditization increases, and technology access becomes democratized. Upstream innovations based on reinventing sourcing, production and logistics are increasingly getting commoditized or outsourced. It is the downstream activities aimed at shaping customers’ perception and reducing their costs and risks that are emerging as the main sources of competitive advantage (Dawar, 2013; Momaya, 2019).
The current study is based on an Indian two-wheeler major with a large domestic market share, which commissioned the authors to help identify, design and deliver training and development programs for their dealer-partners Pan-India. Three areas were identified for managing and enhancing downstream outcomes, namely—dealership sales management, service center operations and customer relationship management.
Background
Starting from March 2020, due to COVID-19 lock-downs, Indian automotive dealers struggled as customers were unable to access dealerships or service centers for months. The subject OEM, however, seized this opportunity to train its dealer-owners in various aspects of business required for the “new normal”, while revisiting important fundamentals from the “old normal”. A list of factors potentially impacting business sustenance and profitability post lock-down was created. Interventions in consultation with the OEM’s senior management and select dealer-owners, validated by extant literature on the selected aspects of managing growth, three areas of improvement were prioritized, aimed at growth through excellence in the downstream value chain at the retail level. These are customer relationship management (Shukla and Pattnaik, 2019; Wertz, 2019; Zander & Zander, 2005), service workshop/operations effectiveness (Bates et al., 2003) and sales management. In addition, as research indicates that product differentiation is no longer sufficient to drive long-term competitiveness in the automotive sector (Dietl et al., 2009), it was concluded that people excellence, coupled with robust systems and application of technology could bring in positive change in the downstream value chain. Which in turn, would help the subject OEM in customer acquisition, customer retention and customer development.
The Indian automobile industry was affected by COVID-19 at the following four levels:
Suppliers: the flow of components, spare parts and raw materials was constrained; the need to develop domestic suppliers (versus international supply chains) became imperative; and inventory blockages occurred as OEM orders dried up.
OEMs: export orders went on hold; decline in production (especially BSVI models) as supply chain and labour availability became major issues; layoffs happened; and major disruptions in managing downstream logistics as different states adopted varying protocols.
The consumer: discretionary spends and passenger vehicle demand went down with pandemic related employment uncertainties; customers adopted a wait and watch approach, while online modes of sales caused discomfort and banking institutions tightened loan disbursements.
Dealer-channel partners: footfalls fell sharply; severe liquidity crisis occurred; non-availability or reduced number of employees hampered operations; forced to go digital to meet customer needs.
Automobile OEMs responded by offering dealers extended credit terms; supporting supply chain partners for maintaining adequate component inventory; training dealer-partners and their staff in COVID-19 safety protocols; helping dealers to adopt digital platforms including social media for customer engagement; developing digital marketing collaterals enabling contactless and remote interactions. They also trained dealers in alternative sources of revenue (servicing, spares and accessories), and trained dealer owners and staff in operations excellence, service marketing, customer relationship management, sales management and digital marketing.
Objectives
The authors’ engagement with 100 plus dealer-partners of the automobile OEM through customized training-interventions in the areas of CRM, services marketing and service operations for the “new normal” generated insights which had the potential of designing an excellence framework. The stakeholders affected by the pandemic felt the need for a service excellence framework relevant during the pandemic journey based on a robust foundation highlighting key enablers and measures along with their interrelationship dynamics. This led to the following three research objectives:
Provide a dealership excellence framework relevant during COVID-19 and ahead,
Identify the key auto dealership level enablers and metrics for excellence, and
Analyze the inter-factor dynamics between the key enablers employing the DEMATEL approach and offer practical recommendations.
Literature Review
In the generic sense, Dawar (2013) and Momaya (2019) highlight the case for downstream innovation as a more productive area, for building competitive advantage and growth. A study of mature European auto OEMs highlighted the growing inefficacy of product-based innovation to drive competitive advantage (Dietl et al., 2009). They concluded that reorganizing production in the auto sector has already reached advanced levels, whereas distribution can still be improved.
Competitive advantage is conceptualized as an outcome of a firm pursuing a market based (Porter, 1980), resource based (Barney, 1991), dynamic capabilities based (Eisenhardt & Martin, 2000), and/or leveraging a relational advantage (Dyer & Singh, 1998) strategy. As firms mature in terms of their market knowledge/expertise and production efficiency/technological prowess—such insights are democratized and are adopted industry-wide, as best practices (Dietl et al., 2009). However, the relational view posits firm’s competitive advantages arising from leveraging relationship-specific assets, knowledge-sharing protocols/processes among partners, sharing complementary resources/capabilities, and effective governance mechanisms (Dyer & Singh, 1998). This is where the authors designed and delivered an initiative for the subject OEM, targeting the retail end for competitive advantage and growth.
A review of contemporary research helped identify factors influencing dealership success in the automotive sector, along with reviewing various tools used for analyses. A summary of the review is provided in Table 1.
Table 1.
Summary of factors that affect sales and service performance in automotive sector
| S. no. | Authors | Methodology | Factors identified | Key findings |
|---|---|---|---|---|
| 1 | James et al., (2020) | ISM and AHP in auto service quality | 9 auto garage challenges | New model proliferation, new technology and service quality are key drivers |
| 2 | James and James, (2020) | Graph theory—auto-garage service quality | 7 quality factors of auto service garage | Garage ambience, Support system, technician capability and repair reliability, |
| 3 | Strydom et al., (2020) | Conceptual model testing using SEM | Seven automotive service related measures | Service resources to enhance service quality, customer satisfaction and customer retention to improve profitability |
| 4 | Chatterjee et al., (2020) | Hypothesis testing using validation through survey | Factors study on adoption of AI integrated CRM system | Perceived usefulness; perceived ease of use; utilitarian attitude and hedonic attitude are the four characteristics that impact AI integrated CRM system |
| 5 | Hassan et al., (2019) | A survey of the 135 SMEs | Understanding benefits of social CRM (s-CRM) | Adoption of ICT has direct and indirect impacts on s-CRM performance. Perceived value of s-CRM was an influential factor for ICT adoption and customer information management |
| 6 | Raut et al., (2020) | TISM—automotive service sector | 10 Green human resource management factors | ‘Green culture, adoption of green strategy,’ coupled with ‘Green training and development’ are the two driving factors |
| 7 | Borchardt et al., (2018) | Case study—9 best branded car dealers | 5 processes for customer satisfaction and revenue | Leadership role with teams, rigor in establishment and procedure enforcement and culture of continuous improvement |
| 8 | Bolger et al., (2016) | Consulting experience | 3 blocks frame on dealer-ship service excellence | Explore (innovation, strategy, analytics), perform (experience), CRM (digital mgmt.) and assure (brand, warranty, auditing) |
| 9 | Singh and Saini, (2016) | Review of extant literature | CRM, customer experience management; customer loyalty, inter-relationships | The CRM efforts, customer acquisition, retention and experience, are having positive influence on attitudinal and behavioral loyalty |
| 10 | Izogo, (2015) | SERQUAL on auto repair, t-test | 5 factors in service quality in automotive repair | Order of improvement priority—tangibles, assurance, reliability, empathy and responsiveness |
| 11 | Bagodi and Mahanty, (2013) | System dynamics | Factors affecting 2-wheeler service sector growth | Drivers—service facility, reliability and charges. Measures—lost services, service quality and potential customers |
| 12 | Arndt et al., (2012) | Hypotheses testing on sales | Frontline employee sales and service performance factors | Cross functional training, joint rewards, cross functional teams, formalization social orientation and spatial proximity |
| 13 | Fraser et al., (2013) | 65 car dealers An anecdotal study | 4 TQM processes | Senior management commitment, customer focus and satisfaction, employee involvement and process management |
To understand the interrelationship dynamics between variables, two approaches have been commonly used—interpretive structural modeling (ISM) and Decision-making Trial and Evaluation Laboratory (DEMATEL). Literature highlights extensive application of these two tools in areas of logistics (Govindan et al., 2016), hospitality (Shieh et al., 2010), manufacturing (Ojha et al., 2014), waste management (Chauhan et al., 2018), sustainable end-of life of products (Sivakumar et al., 2018), Industry 4.0 (Rajput & Singh, 2019) etc.
Table 1 highlights factors shaping downstream automotive sales and service under normal business conditions. However, post-pandemic, new or modified factors are expected, which are currently not researched enough. The analysis tools mentioned in Table 1 have also highlighted the relevance of DEMATEL providing useful insights into the dynamics of interdependent complex factors. These two research gaps have motivated this study.
Methodology
The three key drivers linking research gaps, methodology and research objectives are:
availability of rich, first-hand raw information from a statistically large number of dealers,
absence of a well-defined service excellence framework relevant in the current pandemic disruption, and
absence of a structured and robust approach such as DEMATEL application in this domain
The data collection methodology devised for this research can be sub-divided into five phases as follows:
-
(i)
Phase 1: initial interaction with senior marketing and strategy executives of the OEM to discuss and isolate gaps in downstream value chain (February, 2020–April, 2020);
-
(ii)
Phase 2: interaction with functional executives to narrow down specific areas of need (March 2020–April 2020);
-
(iii)
Phase 3: interaction with select dealer-owners of the OEM Pan-India, consisting of established and new dealer-owners and OEM channel managers to pilot the interventions designed by the authors across three identified areas of excellence (April 2020)
-
(iv)
Phase 4: 7.5 h of group interactions in separate groups of 25–30 dealer-owners (April 2020, May, 2020, June 2020, Aug 2020, Sep 2020, Dec, 2020).
-
(v)
Phase 5: each of these group participants were contacted 2-month post-intervention to be evaluated individually, on the initiatives they implemented at their dealerships to yield a 12-factor inventory analyzed using DEMATEL method (June 2020, Jul 2020, Aug 2020, Nov 2020. Feb 2021).
Keeping the “lockdown” and “unlock” phases in perspective, the above interaction interventions with the OEM and its channel partners can be depicted in a time-line format, as shown in Fig. 1.
Fig. 1.

Timeline of pandemic related data gathering stages
Interaction with Dealers
Data were collected through a mixed-method qualitative technique, involving—(a) virtual extended focus group discussions; followed by (b) short-duration telephonic individual in-depth interviews of 15–20 min; and (c) virtual group discussions with each group of the original downstream dealer participants.
Step A: Extended focus group discussions: the authors conducted sessions with these groups over 6 months (April, May, July, August, September and December 2020). Each group had dealer-partners with industry experience ranging from 2 to 30 years, who were first and second generation dealers.
The authors worked in one area each. CRM and Operational Excellence areas had 25 participant-respondents across three groups each (150 in all), and Services Marketing had 105 participants across four groups, in all numbering 255 participants. The authors spent 7.5 h per group, totaling 75 h of interactions.
Step B: In-depth interviews: 2 months after each group discussion, 15–20 min in-depth interviews were conducted telephonically with individual participants. This lasted 7.5 h for each group, totaling 75 h in all.
Step C: Summative group discussions: group discussions were conducted to finalize and validate the findings with the respondents amounting to a 60-min session per group, totaling 10 h. This was conducted on the same day as the individual telephonic interviews or shortly thereafter.
This methodology is unique in many respects. First, it was spread over 6 months, from the very beginning of the COVID-19 induced lock-down to subsequent sessions being held during the various unlock phases. Second, this research involved collection of real-time downstream data and insights. Third, the semi-structured focus-group type discussions spread over 3-day periods, 2 h/day, was a unique format of data collection. Fourth, instead of a cross-sectional format, a longitudinal research methodology was adopted, capturing the evolving demands at the supply side of vehicles/spare parts. Fifth, the methodology adopted a limited ethnography technique as the researchers spent considerable time in discussing and sharing with the participants. Sixth, this technique involved approximately 85 h of data collection from 255 respondents from across the country. Finally, this may be the only and the largest business respondents study in the automotive sector to assess enablers of business excellence during COVID-19.
DEMATEL—The Enabler Analysis Tool
The two methods ISM and DEMATEL provide an easy understanding of the inter-relationship between variables. In ISM, the output depicts the driving and dependence power of each factor and DEMATEL uncovers the cause and effect relationship and its strength within the set of variables. Unlike in ISM, where the relationship between variables have a binary option (0 and 1) the DEMATEL approach uses a varied set of options (0, 1, 2, 3 or 4), bringing out the degree of cause and effect more prominently. Computational simplicity is another advantage with DEMATEL. Based on these reasons, the DEMATEL approach was adopted for this study.
The seven step DEMATEL approach used for understanding the inter-relationship interactions between variables is as follows:
Step 1: Identify the mutually dependent (n) factors.
Step 2: Create the direct relation matrix (n × n) of the factors.
Step 3: Score the relationships of factors in the direct relation matrix on a comparison scale based on the relevant influence. Assign a value of 0, 1, 2, 3 or 4 for a factor having nil, low, medium, high, and very high influence, respectively.
Step 4: Normalize the relationship matrix. Sum the entries of each cell for each row of the matrix. Pick the largest value amongst the summation of the rows. Divide each cell entry with the largest value to derive the normalized direct relation matrix (N).
Step 5: Develop total relation matrix (T) by the product of N and (I − N)−1, where I is the identity matrix.
Step 6: Compute the sum of the cells in each rows (D) and similarly for columns (R) of the matrix T for the factors. Compute (D − R) and (D+R) for analysis. The (D+R) value indicates degree of importance of the factor. Higher the value, higher is the relationship the factor has with the other factors. (D − R) indicates the nature of the relationship between factors. A positive (D − R) value indicates a cause factor, while a negative value indicates an effect factor.
Step 7: Construct the scatter plot using (D+R) and (D − R) values in the x-axis and y-axis, respectively, and analyze the causality.
Application of the Methodology
There are three phases in this analysis, namely—(i) identifying the enablers and metrics; (ii) finalizing the key enablers and metrics; and (iii) applying the analysis tool DEMATEL.
Identifying the Enablers and Metrics
CRM strategies are focused on creating a competitive advantage for business organizations largely by enabling—(i) customer acquisition; (ii) customer retention; and (iii) customer development. Conceptualizing what leads to realizing these three goals, helps identify the competitive advantage ‘enablers’.
From the perspective of the three CRM goals, the enablers are presented in Table 2.
Table 2.
CRM related goals, enablers and metrics of an automotive dealership
| Enablers | Metrics | |
|---|---|---|
| I. Customer acquisition | Increase in market size/coverage | Dealerships/stores added; additional sales staff hired; new channel added |
| Increased marketing expenditure | Customer awareness levels; trial induced; conversion rates | |
| Using more effective communication tools/media | Footfalls; queries received | |
| Sales promotion programs/campaigns | Redemption rate; pro-rata change in sales | |
| Word-of-mouth generated | Referral rate | |
| II. Customer retention | Creating customer delight | NPS; CLTV |
| Customer perceived value | Customer satisfaction scores; customer complaint scores; brand awareness | |
| Customer engagement | Loyalty program participation; customer satisfaction scores; brand community membership; participation in brand events; referral rate | |
| III. Customer development | Upselling | Sales margin change; sales revenue per salesperson |
| Cross selling | Accessory revenue; non-essential service revenue | |
| Redefining the business by leveraging adjacencies | Sales revenue from new business lines |
Aftersales service strategies in an automotive enterprise has the following goals—(I) defect-free service quality; (II) cost-effective available spare parts; and (III) customer delight with reference to technology and safety.
Quality for customer in their vehicle comes through technology, skilled aftersales mechanics and robust processes. Availability of original spares and cost effective service, improves customer loyalty. Customer comfort in terms of pick-up/delivery, health related safety measures in the pandemic, visible workshop processes, effective customer interactions and adherence to time schedules make a positive difference in customer perception of service excellence at the dealership (see Table 3).
Table 3.
After-sales service related goals, enablers and metrics of an automotive dealership
| Enablers | Metrics | |
|---|---|---|
| I. Defect-free service quality | Skilled and trained mechanics | DPMO—defects per million opportunities |
| Technology in critical service processes | Critical complaint levels | |
| Employee satisfaction and involvement culture | Retention of talented service employees | |
| II. Cost effective and available spare parts | Spares inventory management | Inventory turn ratio, deadstock levels |
| Lost time analysis in the servicing process | Manpower productivity levels | |
| Six S culture in the workshop | Customer satisfaction rating | |
| Value stream mapping process | Lead time reduction, inventory level and loss time analysis | |
| III. Customer delight | Customer understanding, engaging and delivery process | Customer satisfaction rating |
| Effective communication | Vehicles with zero defects | |
| Six-S culture | Customer loyalty level |
Services form an important element of the overall automotive “package” that a customer buys. Along with the physical product, customers buy a number of intangible services, especially after-sales service (Confente & Russo, 2015), car infotainment systems (Chang & Hsiao, 2011), etc. Though the automobile is a tangible-dominant market offering at its core, marketers must leverage the intangible elements for differentiation (Shostack, 1977). The SERVQUAL parameters include reliability, assurance, tangibles, empathy and responsiveness, as key determinants of consumer perception of service quality (Parasuraman et al., 1985). Bitner, (1997) identified people as an enabler of service quality and delivery efficiency as services are heavily people intensive. In the pandemic period, this people-dependence in service delivery has been curtailed in the interests of hygiene and safety. To reduce variability, Levitt (1981) suggested the industrialization of services. In the pandemic, this has accelerated with contactless operations. People development has elements of internal marketing, interactive marketing, employee training and empowerment (Heskett et al., 2008), as key enablers. The role of physical evidence (Bitner, 1992) within which the service is delivered became critical for a safe service experience for customers and employees in the pandemic period. These key enablers and metrics are given in Table 4.
Table 4.
Service marketing goals, enablers and metrics of an automotive dealership
| Enablers | Metrics | |
|---|---|---|
| I. Service quality (SERVQUAL) | Reliability | Errors measurement |
| Assurance | Trust | |
| Tangibles | Infrastructure sufficiency | |
| Empathy | Customization measurement | |
| Responsiveness | Extra mile event measurement | |
| II. People development | Internal marketing | Employee buy-in and engagement |
| Employee training | Employee productivity levels | |
| Employee empowerment processes | Employee satisfaction rating | |
| Interactive marketing | Customer Satisfaction rating | |
| III. Physical evidence | Servicescape design | Employee and customer comfort |
| Service process ease | Process bottlenecks and time taken | |
| Service touchpoint management | Customer delight level |
Finalizing the Key Enablers and Metrics
The authors conducted multiple interactions with the OEM executives and dealer-partners. Based upon these pre-intervention discussions, programs were designed to inculcate excellence in the three identified areas. These programs integrated insights from 33 specific Enablers as exhibited in Tables 2, 3 and 4. Based upon post-intervention engagement with the dealer-partners, the following 12 Enablers were shortlisted (Table 5) for further study. These are
Table 5.
Key enablers with brief description
| Enablers | Brief description |
|---|---|
| People development (PDEV) | Employee’s new-competency building for value-addition through process mapping, application of data analytics, and mobile application in customer-engagement |
| Six-S culture (SSCU) | Further to a sort, set-in-order, shine, standardize and sustain culture, making safety through sanitizing, social distancing and masking became critical |
| Effective communication (EFCO) | Internal marketing is critical for employee buy-in and high-level passion for delivering excellent service. With external marketing the firm creates expectations and offers promises to prospective/existing customers about the quality of service (Zeithaml & Bitner, 2000) |
| Interactive marketing (INMA) | The value delivery at the employee-customer interface. Persuasiveness of internal communications and firm-created expectation levels in external communications define success (Zeithaml & Bitner, 2000) |
| SERVQUAL benchmarking (SERB) | The five dimensions that determine service quality—reliability, assurance, tangibles, empathy and responsiveness (Parasuraman et al., 1985). Each had an enhanced level of demand-intensity in the pandemic |
| Creating customer delight (CCUD) | When value delivery is more than the customer’s expectations, CCUD is key for customer retention and maximizing customer lifetime value. During pandemic, it became important as innovative processes—home pickup and drop of vehicles, online sales portals etc.—were implemented |
| Process mapping (PROM) | A schematic flow mapping all activities in a business process (product pick-up, order-to-delivery etc.) for analysis aimed at eliminating waste and adding customer value |
| Physical evidence management (PHEM) | Application of physical cues such as layout design, equipment, air-quality, lighting, ambience, signage, etc., which makes intangible services, tangible. |
| Loss time analysis (LTA) | If the service-workshop processes having loss-causing wastes are not eliminated on time, it may demand expensive actions later. Tracking this helps build a leaner system |
| Inventory management (INVM) | Periodic analysis of spare-parts using relevant inventory tools and executing smart actions will improve inventory-turn velocity, which is a good health indicator |
| Up and cross selling (UPCS) | Upselling implies selling higher priced/margin products/services to an existing customer, enhancing sales margins. Cross selling enhances share of wallet through selling additional products/services to an existing customer. Both have been critical in the pandemic period |
| New business development (NBUD) | Customer acquisition is the lifeblood of commercial organizations. If new customers are not added consistently, it will lead to business-decline, as manifested during the pandemic |
‘What can be measured will be done’ is a common belief which growth-oriented business leaders value. Therefore, there is a strong need to identify a set of measures/metrics to track the impact progression of the enablers. Interacting with dealers and a set of experts the following measures were identified for application;
Employee satisfaction index (ESIN).
Customer satisfaction index (CSIN).
Net promoter score (NPSC).
Sales revenue per person (SRPP).
Referral rates (RRAI).
Inventory turn ratio (ITRA).
Manpower productivity in workshop (MPPW).
Revenue from new business (RFNB).
Defect/million opportunities (DPMO).
The enablers change the speed of various business performance dimensions in a measurable manner. Assessing the degree of business impact of the actions through the enablers can vary and are measurable using the metrics mentioned in the preceding paragraph. Figure 2 presents high business impact enablers–metrics relationship.
Fig. 2.
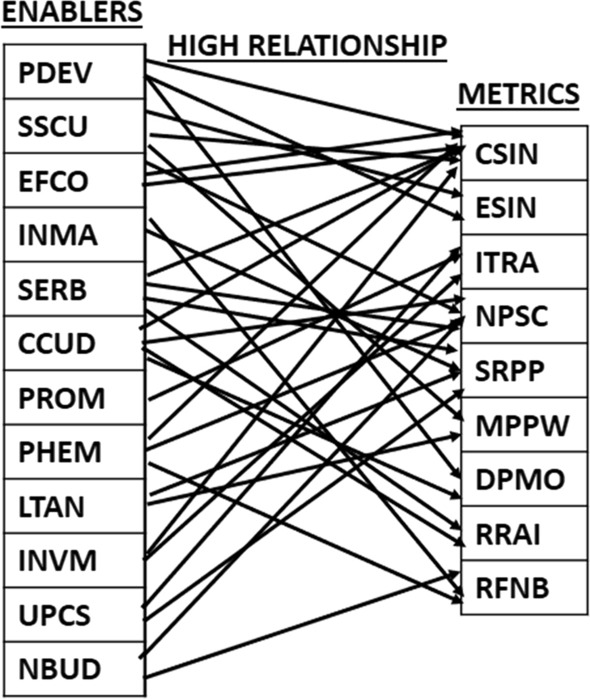
High business impact enabler—metric relationship diagram
Application of DEMATEL
Step 1: The 12 mutually dependent enablers (detailed in “Finalizing the key Enablers and metrics”) arrived at from the focus group of the stakeholders in the dealership excellence framework were PDEV, SSCU, EFCO, INMA, SERB, CCUD, PROM, PHEM, LTAN, INVM, UPCS and NBUD.
Steps 2 and 3: Based on the inputs from the stakeholders the direct relation matrix with the scores (0–4) was developed and is shown in Table 6.
Table 6.
Direct relationship matrix with score of the 12 key enablers
| Key enablers | ||||||||||||
|---|---|---|---|---|---|---|---|---|---|---|---|---|
| PDEV | SSCU | EFCO | INMA | SERB | CCUD | PROM | PHEM | LTAN | INVM | UPCS | NBUD | |
| PDEV | 0 | 2 | 3 | 4 | 4 | 3 | 3 | 2 | 2 | 3 | 1 | 1 |
| SSCU | 0 | 0 | 0 | 2 | 2 | 1 | 0 | 2 | 1 | 4 | 1 | 0 |
| EFCO | 4 | 2 | 0 | 4 | 3 | 3 | 0 | 0 | 2 | 1 | 3 | 3 |
| INMA | 4 | 2 | 4 | 0 | 4 | 3 | 0 | 2 | 1 | 3 | 3 | 1 |
| SERB | 4 | 2 | 3 | 4 | 0 | 0 | 1 | 4 | 2 | 3 | 0 | 0 |
| CCUD | 1 | 1 | 2 | 1 | 3 | 0 | 3 | 1 | 0 | 1 | 1 | 0 |
| PROM | 1 | 3 | 1 | 2 | 3 | 3 | 0 | 3 | 3 | 4 | 1 | 0 |
| PHEM | 2 | 2 | 0 | 2 | 4 | 1 | 0 | 0 | 3 | 4 | 3 | 3 |
| LTAN | 0 | 0 | 0 | 0 | 1 | 1 | 0 | 1 | 0 | 3 | 3 | 0 |
| INVM | 0 | 0 | 0 | 0 | 3 | 3 | 0 | 1 | 1 | 0 | 3 | 0 |
| UPCS | 0 | 0 | 4 | 4 | 3 | 4 | 0 | 1 | 0 | 1 | 0 | 3 |
| NBUD | 0 | 0 | 4 | 2 | 4 | 4 | 0 | 0 | 0 | 0 | 3 | 0 |
Step 4: The normalized direct relation matrix was developed and is shown in Table 7.
Table 7.
Normalized direct relation matrix of the 12 key enablers
| PDEV | SSCU | EFCO | INMA | SERB | CCUD | PROM | PHEM | LTAN | INVM | UPCS | NBUD | |
|---|---|---|---|---|---|---|---|---|---|---|---|---|
| PDEV | 0 | 0.0714 | 0.1071 | 0.1429 | 0.1429 | 0.1071 | 0.1071 | 0.0714 | 0.0714 | 0.1071 | 0.0357 | 0.0357 |
| SSCU | 0 | 0 | 0 | 0.0714 | 0.0714 | 0.0357 | 0 | 0.0714 | 0.0357 | 0.1429 | 0.0357 | 0 |
| EFCO | 0.1429 | 0.0714 | 0 | 0.1429 | 0.1071 | 0.1071 | 0 | 0 | 0.0714 | 0.0357 | 0.1071 | 0.1071 |
| INMA | 0.1429 | 0.0714 | 0.1429 | 0 | 0.1429 | 0.1071 | 0 | 0.0714 | 0.0357 | 0.1071 | 0.1071 | 0.0357 |
| SERB | 0.1429 | 0.0714 | 0.1071 | 0.1429 | 0 | 0 | 0.0357 | 0.1429 | 0.0714 | 0.1071 | 0 | 0 |
| CCUD | 0.0357 | 0.0357 | 0.0714 | 0.0357 | 0.1071 | 0 | 0.1071 | 0.0357 | 0 | 0.0357 | 0.0357 | 0 |
| PROM | 0.0357 | 0.1071 | 0.0357 | 0.0714 | 0.1071 | 0.1071 | 0 | 0.1071 | 0.1071 | 0.1429 | 0.0357 | 0 |
| PHEM | 0.0714 | 0.0714 | 0 | 0.0714 | 0.1429 | 0.0357 | 0 | 0 | 0.1071 | 0.1429 | 0.1071 | 0.1071 |
| LTAN | 0 | 0 | 0 | 0 | 0.0357 | 0.0357 | 0 | 0.0357 | 0 | 0.1071 | 0.1071 | 0 |
| INVM | 0 | 0 | 0 | 0 | 0.1071 | 0.1071 | 0 | 0.0357 | 0.0357 | 0 | 0.1071 | 0 |
| UPCS | 0 | 0 | 0.1429 | 0.1429 | 0.1071 | 0.1429 | 0 | 0.0357 | 0 | 0.0357 | 0 | 0.1071 |
| NBUD | 0 | 0 | 0.1429 | 0.0714 | 0.1429 | 0.1429 | 0 | 0 | 0 | 0 | 0.1071 | 0 |
Step 5: The total relation matrix was computed by the product of matrix N and (I–N) −1, as shown in Table 8.
Table 8.
Total direct relation matrix of the 12 key enablers
| PDEV | SSCU | EFCO | INMA | SERB | CCUD | PROM | PHEM | LTAN | IVNM | UPCS | NBUD | |
|---|---|---|---|---|---|---|---|---|---|---|---|---|
| PDEV | 0.207164 | 0.221695 | 0.324642 | 0.392791 | 0.469765 | 0.348612 | 0.183468 | 0.259858 | 0.225775 | 0.374093 | 0.254772 | 0.147063 |
| SSCU | 0.086103 | 0.059994 | 0.09485 | 0.173402 | 0.215482 | 0.141817 | 0.032116 | 0.151 | 0.101007 | 0.252586 | 0.135318 | 0.050107 |
| EFCO | 0.317307 | 0.201092 | 0.232402 | 0.382723 | 0.414186 | 0.337979 | 0.085002 | 0.172181 | 0.198428 | 0.27283 | 0.297831 | 0.207403 |
| INMA | 0.334244 | 0.214186 | 0.363137 | 0.274289 | 0.467586 | 0.349455 | 0.089953 | 0.249685 | 0.185549 | 0.358049 | 0.31249 | 0.156588 |
| SERB | 0.309965 | 0.200718 | 0.286812 | 0.357585 | 0.298104 | 0.219349 | 0.103073 | 0.293296 | 0.21003 | 0.343665 | 0.201067 | 0.107538 |
| CCUD | 0.150401 | 0.124622 | 0.189777 | 0.185369 | 0.284102 | 0.135715 | 0.147945 | 0.145283 | 0.093823 | 0.188804 | 0.148545 | 0.063807 |
| PROM | 0.183023 | 0.213601 | 0.196258 | 0.261142 | 0.360782 | 0.287133 | 0.063259 | 0.250756 | 0.223216 | 0.353128 | 0.209252 | 0.086177 |
| PHEM | 0.217685 | 0.175424 | 0.192689 | 0.277478 | 0.402532 | 0.239587 | 0.06337 | 0.150711 | 0.21658 | 0.343291 | 0.279031 | 0.191516 |
| LTAN | 0.051264 | 0.036417 | 0.069378 | 0.077595 | 0.134577 | 0.113218 | 0.022429 | 0.086776 | 0.04018 | 0.172969 | 0.167206 | 0.039248 |
| INVM | 0.077658 | 0.055057 | 0.09565 | 0.107618 | 0.227972 | 0.193337 | 0.037177 | 0.109473 | 0.089449 | 0.099389 | 0.178974 | 0.04777 |
| UPCS | 0.174791 | 0.117916 | 0.328784 | 0.343123 | 0.366497 | 0.331811 | 0.067368 | 0.170671 | 0.112085 | 0.22307 | 0.172066 | 0.197588 |
| NBUD | 0.153698 | 0.103137 | 0.305307 | 0.260023 | 0.357865 | 0.302376 | 0.061646 | 0.123372 | 0.097017 | 0.164518 | 0.240391 | 0.086462 |
Step 6: Based on the DEMATEL method the sum (D + R) and difference (D–R) of the columns (R) and rows (D) were computed for each enabler and are shown in Table 9.
Table 9.
Influence dispatching and receiving strengths of the 12 enablers
| Enablers | (D + R) | (D − R) |
|---|---|---|
| PDEV | 5.672997 | 1.146396 |
| SSCU | 3.217642 | − 0.23008 |
| EFCO | 5.79905 | 0.439676 |
| INMA | 6.44835 | 0.262073 |
| SERB | 6.930651 | − 1.06825 |
| CCUD | 4.85858 | − 1.1422 |
| PROM | 3.64453 | 1.730922 |
| PHEM | 4.912952 | 0.586833 |
| LTAN | 2.804393 | − 0.78188 |
| INVM | 4.465915 | − 1.82687 |
| UPCS | 5.202712 | 0.008826 |
| NBUD | 3.637081 | 0.874545 |
Step 7: Scatter diagram (Fig. 3) indicates the cause and effect groups and strength of each enabler.
Fig. 3.

Scatter diagram of (D + R) and (D − R) values of the 12 enablers
Analysis and discussion
The observations from the scatter diagram (Fig. 3) are
SERB, having the highest (D + R) score of 6.93 is the most important enabler. INMA is not very far behind SERB. Both need tracking as they have a very high relationship with other enablers in the group. PDEV and EFCO with almost similar (D + R) scores also have a dominant positive role in business growth and need to be focused on. The large scale online training and skills development of retail level personnel in the areas of digital marketing, social media out-reach to customers, alternative sources of revenue generation and spare-parts inventory control during the COVID-19 lockdown period validate the above findings. “Physical infrastructure, assurance management, and service reliability became critical during the pandemic and had a direct impact on customer satisfaction” according to many dealer-owners.
The (D − R) values indicate the type of relationship the criterion has with others. All the enablers with positive values (PROM, PDEV, NBUD, PHEM, EFCO, INMA and UPCS) fall under the cause (dispatcher) category, while the one with negative values (INVM, SERB, CCUD, SSCU and LTAN) fall under the effect (receiver) category. As the (D − R) is negative for five of the enablers, they are stronger receivers of the influence rather than dispatchers. INMA, SERB and CCUD are heavily influenced by the influence dispatching enablers—PROM, PDEV and NBUD.
PROM, PDEV and NBUD are high value cause enablers having a significant dispatching influence on the effect enablers. Therefore, it is important for dealerships to identify key processes, map them and eliminate “wasteful elements”. There is a clear need to train a critical mass of dealership personnel with new digital skills, new technology and interactive digital marketing skills. Some dealers opined, “We had never really put too much thought into people development and process mapping. Now we have understood that these have a direct impact as causes of customer perception of our services and consequently the acquisition of new customers”. “Digital skills that we had not focused on at all in pre-pandemic times became so important, suddenly.”
INVM of the effect group is a significant receiver of the influence from other enablers. INVM in the form of spare-parts and finished-goods inventory has received the maximum attention in the post lockdown period. The two enablers CCUD and SERB are not far behind in their impact on the effect group. “As the sales footfalls dropped during the pandemic we looked at additional/alternative sources of revenue. Inventory management became key to our survival,” according to the younger dealer owners. Though dealer’s pre-pandemic revenue sources continued, the focus shifted to post-pandemic realities.
Figure 2, reveals the top five metrics for dealership enterprise as—customer satisfaction index (CSIN), net promoter score (NPSC), sales revenue per person (SRPP), inventory turn ratio (ITRA) and revenue from new business (RFNB). They represent the three key stakeholders—customers, marketing managers (managing existing and new products) and the supply chain manager. “Many of us (dealers) were good at sales but rarely focused on critical business metrics before the pandemic other than customer satisfaction.”
Conclusions
The DEMATEL based analysis using data points from automotive dealerships during the pandemic has brought out some very useful and relevant insights. Service quality continues to be the dominating enabler in effect category, which is intuitively so valid. Two enablers: people development and process mapping created significant effects on customer delight and inventory management. This has been observed to be correct as in the pandemic-induced ‘new normal’ there is a requirement for employees in customer facing functions to quickly pick up new skills and recast business processes. Interactive marketing and Effective communication will continue playing a significant role for service excellence in this constrained physical engagement world of service provider and customer. The three metrics—customer satisfaction index, inventory turn ratio and revenue from new business, facilitate in monitoring the business through the application of the enablers
Research Implications
Structured approach in identifying and analyzing the key success factors in CRM, service marketing excellence and service operations excellence for automotive service dealers coupled with the application of DEMATEL approach formed a robust theoretical foundation to the research. Findings from the inter-factor dynamics provide useful insights for the survival and growth of the channel partners and the OEM through this pandemic disruption. Prioritization weights of the enablers provide the apt direction for focus in the pandemic journey.
Limitations of the Study and Future Scope for Work
This research has focussed on the automotive dealership, and therefore, the findings may not be as relevant for dealerships of other sectors. Multiple method comparative analysis of the data and stratification/analysis of the enablers from OEM and dealer-owners are recommended as future scope of study. The research methodology utilised can provide useful insights in the analysis of the challenges being faced currently in many other domains, such as healthcare sector.
Key Questions Reflecting Applicability in Real Life
What are the key enablers automotive OEMs and channel partners need to focus on for pandemic time survival and growth?
What are the critical elements of a service excellence framework for practicing managers to bear in mind in a pandemic-triggered manufacturing and marketing world?
Which enablers and metrics should managers focus on when attempting downstream innovation?
How do the inter-factor dynamics of a service excellence framework work in a post-pandemic world versus normal times?
Acknowledgements
We are grateful to the anonymous reviewers and JGBC Guest-editors for their constructive comments and feedback.
Biographies
Ravindra Ojha
, Professor—Operations at Great Lakes Institute of Management, Gurgaon and the Ex Managing Director of G.K.N. Driveline India has a rich corporate experience of 30 years in the automotive manufacturing sector and 8 years in academia. He is B Tech. (Mechanical) from N.I.T Warangal (Gold medalist) and M.Engg. (Industrial Engineering & Management) from the Asian Institute of Technology Bangkok and PhD from Northcap University. His areas of research interests are Cellular manufacturing systems, Technology audits, Manufacturing excellence, Lean systems and System Dynamics. He has more than 30 of national and international journal publications.
Jones Mathew
has 30 year corporate and academic experience in marketing and sales. He has published research in Brand Marketing, Sustainable Marketing, CSR and Services Marketing, Travel and Tourism and Need for Uniqueness. He has authored popular international case studies on Indian companies. He is on the advisory boards of academic journals, research development committees of universities, and enjoys research-based teaching in the classroom. Dr. Mathew is a Board Member of Shiksha Prayas, an NGO working in the area of education for the underprivileged. ORCID No: 0000–0002-1693-599X.
Umashankar Venkatesh
, Ph.D., is Professor of Marketing & Director-PGPM at the Great Lakes Institute of Management, Gurgaon. With a Ph.D. in Management (Consumer Behavior), he holds Postgraduate qualifications in Management as well as Agricultural Economics. His areas of interests are Consumer Behavior, International Marketing, Services Marketing, Rural Marketing, Strategic Marketing etc. Author of a book on services, he is published internationally and serves on the Editorial Board of various research journals. He has trained senior executives in organizations, such as Hero MotoCorp Ltd.; L&T; Lucas TVS; Carborundum Universal; KFC; Indian Oil Corporation; Punjab National Bank; Indian Overseas Bank etc.
Funding
They also declare that they have received no funding (financial or non-financial of any kind) for the research and the source of all data has been the authors themselves.
Declarations
Conflict of interest
The authors declare that there is no conflict of interest in this research work.
Contributor Information
Ravindra Ojha, Email: ravindra.o@greatlakes.edu.in.
Jones Mathew, Email: jones.m@greatlakes.edu.in.
Umashankar Venkatesh, Email: umashankar.v@greatlakes.edu.in.
References
- Arndt AD, Karande K, Harkins J. Does the performance of other functions in the frontline influence salesperson conflict. International Journal of Retail & Distribution Management. 2012;40(9):717–736. doi: 10.1108/09590551211255983. [DOI] [Google Scholar]
- Bagodi V, Mahanty B. Double loop learning in the Indian two-wheeler service sector. The Learning Organization. 2013;20(4/5):264–278. doi: 10.1108/TLO-04-2012-0029. [DOI] [Google Scholar]
- Bajwa, N. (2020). Running in the Top Gear. Retrieved from: https://www.investindia.gov.in/sector/automobile, Accessed 20 Dec 2020.
- Barney JB. Firm resources and sustained competitive advantage. Journal of Management. 1991;17(1):99–120. doi: 10.1177/014920639101700108. [DOI] [Google Scholar]
- Bates K, Bates H, Johnston R. Linking service to profit: The business case for service excellence. International Journal of Service Industry Management. 2003;14(2):173–183. doi: 10.1108/09564230310474147. [DOI] [Google Scholar]
- Bitner MJ. “Servicescapes: The impact of physical surroundings on customers and employees. Journal of Marketing. 1992;56(2):57–71. doi: 10.1177/002224299205600205. [DOI] [Google Scholar]
- Bitner MJ. Service marketing: Perspective on service excellence. Journal of Retailing. 1997;73(1):3–7. doi: 10.1016/S0022-4359(97)90011-7. [DOI] [Google Scholar]
- Bolger, D., Lomasney, M., Hasani, R., & Arkenau, B. (2016). Automotive dealer services driven by excellence focused on execution. In Global automotive consumer study. Deloitte Touche Tohmatsu Limited. www.deloitte.com/us/geny.
- Borchardt M, Souza M, Pereira GM, Viegas CV. Achieving better revenue and customers’ satisfaction with after-sales services, how do the best branded car dealerships get it? International Journal of Quality & Reliability Management. 2018;35(9):1686–1708. doi: 10.1108/IJQRM-01-2017-0016. [DOI] [Google Scholar]
- Chang T, Hsiao W. Consumers' automotive purchase decisions: The significance of vehicle-based infotainment systems. African Journal of Business Management. 2011;5(11):4152–4163. [Google Scholar]
- Chatterjee S, Nguyen B, Ghosh SK, Bhattacharjee KK, Chaudhuri S. Adoption of artificial intelligence integrated CRM system: An empirical study of Indian organizations. The Bottom Line. 2020;33(4):359–375. doi: 10.1108/BL-08-2020-0057. [DOI] [Google Scholar]
- Chaudhary, V. (2021). The second wave’s impact on auto sales: Major players see decline in monthly sales. Financial Express, 3 May 2021. Retrieved from: https://www.financialexpress.com/auto/industry/the-second-waves-impact-on-auto-sales-major-players-see-decline-in-monthly-sales/2244705/. Accessed 14 May 2021.
- Chauhan A, Singh A, Jharkharia S. An interpretive structural modeling (ISM) and decision-making trail and evaluation laboratory (DEMATEL) method approach for the analysis of barriers of waste recycling in India. Journal of the Air & Waste Management Association. 2018;68(2):100–110. doi: 10.1080/10962247.2016.1249441. [DOI] [PubMed] [Google Scholar]
- Confente I, Russo I. After-sales service as a driver for word-of-mouth and customer satisfaction: Insights from the automotive industry. International Journal of Management Cases. 2015;17(4):59–72. [Google Scholar]
- Dawar N. When marketing is strategy. Harvard Business Review. 2013;91(12):100–108. [Google Scholar]
- Deshmukh, S. G., & Haleem, A. (2020). Framework for manufacturing in post-COVID-19 world order: An Indian perspective. International Journal of Global Business and Competitiveness,15(1), 49–60. 10.1007/s42943-020-00009-1
- Dietl H, Royer S, Stratmann U. Value creation architectures and competitive advantage: Lessons from the European automobile industry. California Management Review. 2009;51(3):24–48. doi: 10.2307/41166492. [DOI] [Google Scholar]
- Dyer JH, Singh H. The relational view: Cooperative strategies and sources of inter-organizational competitive advantage. Academy of Management Review. 1998;23(4):660–679. doi: 10.2307/259056. [DOI] [Google Scholar]
- Eisenhardt KM, Martin JA. Dynamic capabilities: What are they? Strategic Management Journal. 2000;21(10/11):1105–1121. doi: 10.1002/1097-0266. [DOI] [Google Scholar]
- Fraser K, Tseng B, Hvolby K. TQM in new car dealerships: A study from the firms’ perspective. The TQM Journal. 2013;25(1):5–17. doi: 10.1108/17542731311286397. [DOI] [Google Scholar]
- Govindan K, Khodaverdi R, Vafadarnikjoo A. A grey DEMATEL approach to develop third-party logistics provider selection criteria. Industrial Management & Data Systems. 2016;116(4):690–722. doi: 10.1108/IMDS-05-2015-0180. [DOI] [Google Scholar]
- Hassan SH, Haniba NMM, Ahmad NH. Social customer relationship management (s-CRM) among small- and medium-sized enterprises (SMEs) in Malaysia. International Journal of Ethics and Systems. 2019;35(2):284–302. doi: 10.1108/IJOES-11-2017-0192. [DOI] [Google Scholar]
- Heskett JL, Jones TO, Loveman GW, Sasser W, Jr, Schlesinger E, Leonard A. Putting the service-profit chain to work. Harvard Business Review. 2008;86(7/8):118–129. [Google Scholar]
- Izogo EE. Customers’ service quality perception in automotive repair. African Journal of Economic and Management Studies. 2015;6(3):272–288. doi: 10.1108/AJEMS-02-2013-0024. [DOI] [Google Scholar]
- James AT, James J. Service quality evaluation of automobile garages using a structural approach. International Journal of Quality & Reliability Management. 2020 doi: 10.1108/IJQRM-03-2020-0066. [DOI] [Google Scholar]
- James AT, Kumar G, Bhalla M, Amar M, Jain P. Analysis of challenges for automobile service garages in India: A structural modeling approach. Journal of Advances in Management Research. 2020 doi: 10.1108/JAMR-04-2020-0059. [DOI] [Google Scholar]
- Levitt T. Marketing intangible products and product intangibles. Harvard Business Review. 1981;59(3):94–102. [Google Scholar]
- Momaya, K. S. (2019). The past and the future of competitiveness research: A review in an emerging context of innovation and EMNEs. International Journal of Business and Competitiveness,14(1), 1–10. 10.1007/s42943-019-00002-3.
- Ojha R, Vij AK, Vrat P. Manufacturing excellence and its critical factors—An interpretive structural methodology application. Journal of Advances in Management Research. 2014;11(3):312–332. doi: 10.1108/JAMR-06-2014-0032. [DOI] [Google Scholar]
- Parasuraman A, Zeithaml VA, Berry LL. A conceptual model of service quality and its implications for future research. Journal of Marketing. 1985;49(4):41–50. doi: 10.1177/002224298504900403. [DOI] [Google Scholar]
- Porter ME. Competitive strategy. The Free Press; 1980. [Google Scholar]
- Press Trust of India. (2020). Lockdown effect: Indian automotive industry suffered Rs. 2,300 crore loss daily, Financial Express, 15 Dec 2020. Retrieved from: https://www.financialexpress.com/auto/industry/lockdown-effect-indian-automotive-industry-suffered-rs-2300-crore-loss-daily-oems-shutdown-factories-production-facility-cars-bikes-scooters/2150591/. Accessed 16 Dec 2020.
- Rajput S, Singh SP. Identifying Industry 4.0 IoT enablers by integrated PCA-ISM-DEMATEL approach. Management Decision. 2019;57(8):1784–1817. doi: 10.1108/MD-04-2018-0378. [DOI] [Google Scholar]
- Raut RD, Gardas B, Luthra S, Narkhede B, Mangla SK. Analysing green human resource management indicators of automotive service sector. International Journal of Manpower. 2020;41(7):925–944. doi: 10.1108/IJM-09-2019-0435. [DOI] [Google Scholar]
- Shieh JI, Wu HH, Huang KK. A DEMATEL method in identifying key success factors of hospital service quality. Knowledge-Based Systems. 2010;23(3):277–282. doi: 10.1016/j.knosys.2010.01.013. [DOI] [Google Scholar]
- Shostack LG. Breaking free from product marketing. Journal of Marketing. 1977;41(2):73–80. doi: 10.2307/1250637. [DOI] [Google Scholar]
- Shukla MK, Pattnaik PN. Managing customer relations in a modern business environment: Towards an ecosystem-based sustainable CRM model. Journal of Relationship Marketing. 2019;18(1):17–33. doi: 10.1080/15332667.2018.1534057. [DOI] [Google Scholar]
- Singh J, Saini S. Importance of CEM in CRM-CL framework. Journal of Modelling in Management. 2016;11(1):91–115. doi: 10.1108/JM2-05-2014-0038. [DOI] [Google Scholar]
- Sivakumar K, Jeyapaul R, Vimal KEK, Ravi P. A DEMATEL approach for evaluating barriers for sustainable end-of-life practices. Journal of Manufacturing Technology Management. 2018;29(6):1065–1109. doi: 10.1108/JMTM-08-2017-0164. [DOI] [Google Scholar]
- Strydom G, Michael T, Ewing MT, Heggen C. Time lags, non-linearity and asymmetric effects in an extended service-profit chain. European Journal of Marketing. 2020;54(10):2343–2363. doi: 10.1108/EJM-12-2019-0906. [DOI] [Google Scholar]
- Wertz, J. (2019). How CRMs help businesses gain a competitive advantage, Forbes Magazine, Oct 30, 2019. Retrieved from: https://www.forbes.com/sites/jiawertz/2019/10/30/how-crms-help-businesses-gain-a-competitive-advantage/?sh=5f428af12ac2. Accessed Mar 26 2021.
- Zander I, Zander U. The inside track: On the important (but neglected) role of customers in the resource-based view of strategy and firm growth. Journal of Management Studies. 2005;42(8):1519–1548. doi: 10.1111/j.1467-6486.2005.00555.x. [DOI] [Google Scholar]
- Zeithaml VA, Bitner MJ. Services marketing: Integrating customer focus across the firm. McGraw-Hill; 2000. p. 16. [Google Scholar]