. 2021 Jul 6;300(3):681–689. doi: 10.1148/radiol.2021204441

Figure 1:

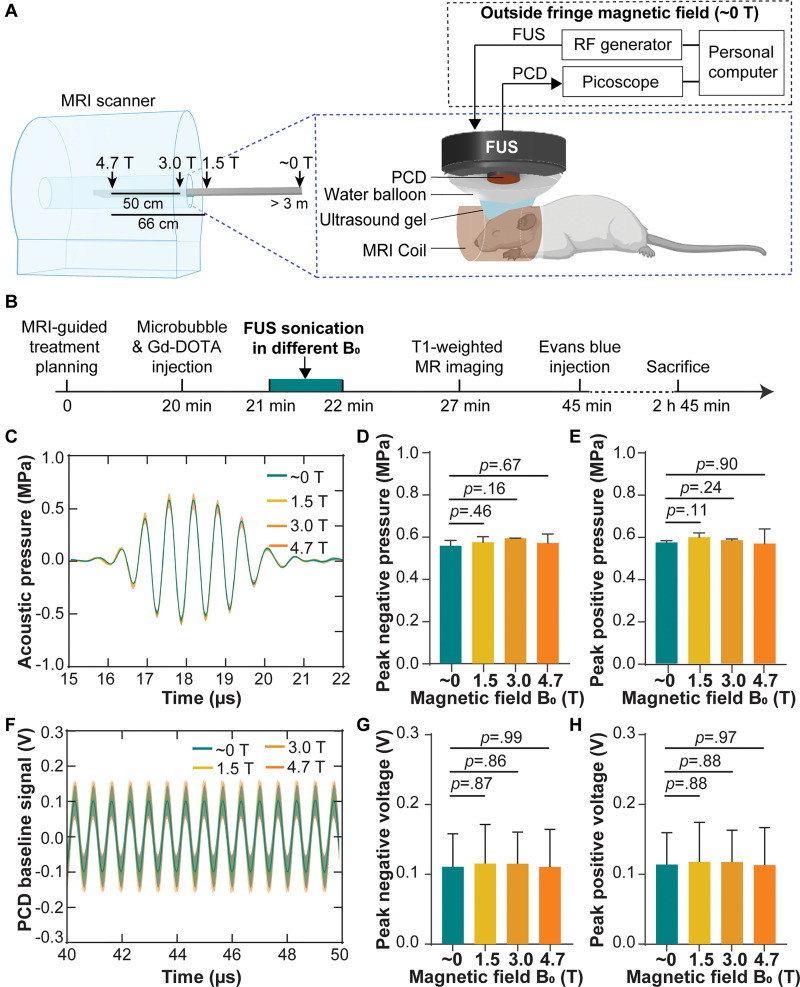
(A) Illustration of the experimental setup. Focused ultrasound (FUS) sonication was performed in different static magnetic fields (approximately 0, 1.5, 3.0, and 4.7 T) by positioning the mice at different distances from the isocenter of the MRI scanner. (B) Experimental timeline. (C) Acoustic pressure waveforms at the focus of the focused ultrasound transducer measured with an MRI-compatible fiber-optic hydrophone in different magnetic fields. Each solid line and shadow represents the mean ± standard deviation, respectively, of three repeated measurements in each magnetic field. Comparisons of (D) the peak negative pressure and (E) peak positive pressure in different magnetic fields. (F) Passive cavitation detection (PCD) baseline signals received when focused ultrasound was on but without microbubbles in different magnetic fields. The phase delays of the PCD baseline signals acquired from different mice in each magnetic field were calculated by means of cross correlation and compensated for calculating the mean (solid line) and standard deviation (shadow) of these signals. Comparisons of (G), the peak negative voltage and (H) peak positive voltage of the PCD baseline signals in different magnetic fields. Error bars indicate standard deviation. Gd-DOTA = gadoterate meglumine, RF = radiofrequency.

(A) Illustration of the experimental setup. Focused ultrasound (FUS) sonication was performed in different static magnetic fields (approximately 0, 1.5, 3.0, and 4.7 T) by positioning the mice at different distances from the isocenter of the MRI scanner. (B) Experimental timeline. (C) Acoustic pressure waveforms at the focus of the focused ultrasound transducer measured with an MRI-compatible fiber-optic hydrophone in different magnetic fields. Each solid line and shadow represents the mean ± standard deviation, respectively, of three repeated measurements in each magnetic field. Comparisons of (D) the peak negative pressure and (E) peak positive pressure in different magnetic fields. (F) Passive cavitation detection (PCD) baseline signals received when focused ultrasound was on but without microbubbles in different magnetic fields. The phase delays of the PCD baseline signals acquired from different mice in each magnetic field were calculated by means of cross correlation and compensated for calculating the mean (solid line) and standard deviation (shadow) of these signals. Comparisons of (G), the peak negative voltage and (H) peak positive voltage of the PCD baseline signals in different magnetic fields. Error bars indicate standard deviation. Gd-DOTA = gadoterate meglumine, RF = radiofrequency.