Abstract
The purpose of this Chapter is to present a detailed description of methods for performing bone Micro-Computed Tomography (microCT) scanning and analysis. MicroCT is an x-ray imaging method capable of visualizing bone at the micro-structural scale, that is, 1–100 μm resolution. MicroCT is the gold-standard method for assessment of 3D bone morphology in studies of small animals. As applied to the small bones of mice or rats, microCT can efficiently and accurately assess bone structure (e.g., cortical bone area [Ct. Ar]) and micro-structure (e.g., trabecular bone volume fraction [Tb.BV/TV]). The particular application described herein is for post mortem mouse femur specimens. The material presented should be generally applicable to many commercially available laboratory microCT systems, although some details are specific to the system used in our lab (Scanco mCT 40; SCANCO Medical AG, Bruttisellen, Switzerland).
Keywords: microCT, Bone imaging, Bone morphology, Mouse femur
1. Introduction
The purpose of this chapter is to present a detailed description of methods for performing bone micro-computed tomography (microCT) scanning and analysis. The particular application described below is for postmortem mouse femur specimens. First, we present a concise review of basic concepts and terminology. The material presented should be generally applicable to many commercially available laboratory microCT systems, although some details are specific to the system used in our lab (Scanco μCT 40; SCANCO Medical AG, Bruttisellen, Switzerland). For a comprehensive overview of microCT principles and guidelines for assessing and reporting bone microstructure, the reader is referred to Bouxsein et al. [1].
MicroCT is an X-ray imaging method capable of visualizing bone at the microstructural scale, that is, 1–100 μm resolution. It is similar to clinical CT, but achieves higher resolution by combining a smaller field-of-view, micro-focus X-ray source, and higher resolution detector. MicroCT is the gold-standard method for assessment of 3D bone morphology in studies of small animals. As applied to the small bones of mice or rats, microCT can efficiently and accurately assess bone structure (e.g., cortical bone area [Ct. Ar]) and microstructure (e.g., trabecular bone volume fraction [Tb.BV/TV]) [1–3].
In brief, when an X-ray source is focused on an object, the intensity of the X-rays is attenuated based on the thickness and atomic number density of the constituent material (Fig. 1). An X-ray detector array opposite the source measures the X-ray energy, and essentially converts the X-ray shadow of the object into a projection/image. Clinical CT (and in vivo microCT) works by acquiring multiple projections as the source and detector rotate around the object (e.g., patient, mouse), and reconstructing these projections into a 2D tomogram or CT slice (Fig. 2). By contrast, specimen microCT scanners rotate the object while the source and detector remain stationary. In either case, a set of 2D slices is stacked to form a 3D image, which is represented as an X-Y-Z array of voxels. A voxel (a.k.a., volume element) is the 3D version of a pixel; for Scanco microCT systems, voxels are “isotropic,” that is, of equal dimension in X, Y and Z directions. By convention, the Z-direction corresponds to the longitudinal axis, and the X–Y plane is the transverse plane of the CT slice.
Fig. 1.

Attenuation of X-ray energy through bone depends on thickness (t) and mineral density. The thicker and denser the object, the greater the attenuation (loss)
Fig. 2.
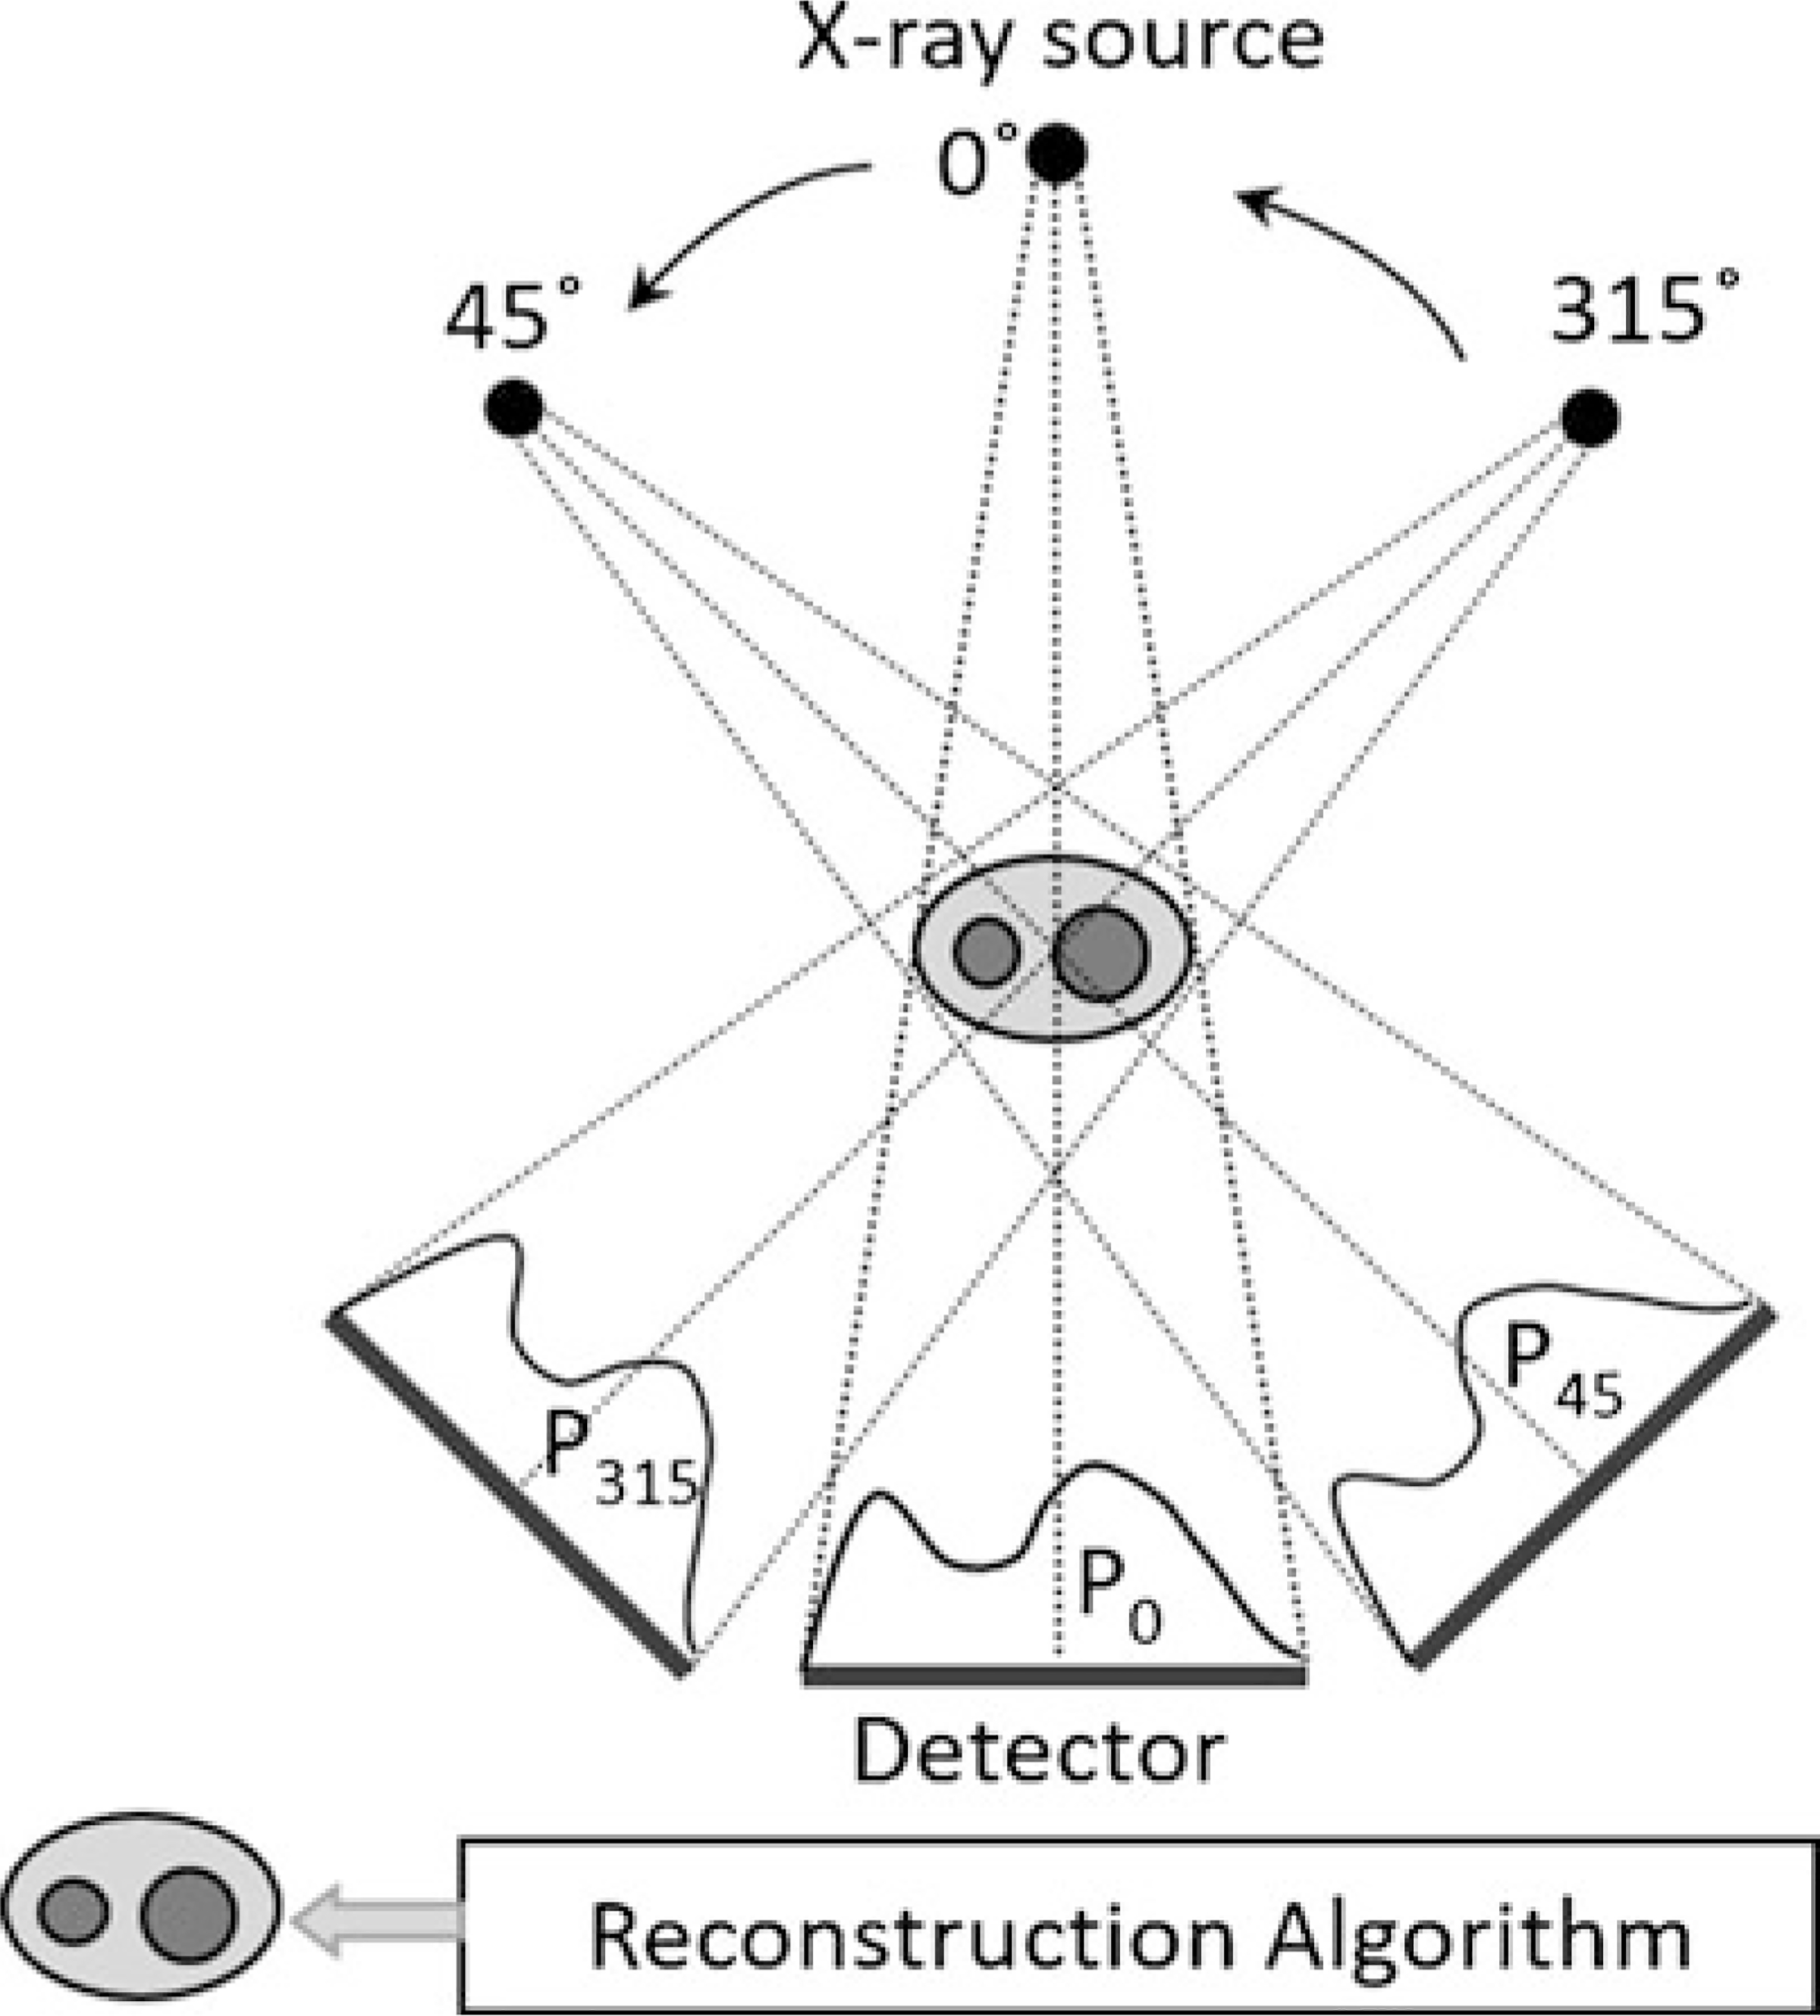
At each position, the detector acquires a projection (P) of the object (e.g., forearm). The CT reconstruction algorithm essentially averages the intensities of these multiple projections at each spot on the detector array, and generates a 2D tomogram (slice) which is like a density map. Note that for clinical CT and in vivo microCT, the source and detector rotate around the subject, as shown above. By contrast, for specimen microCT, multiple projections are acquired by rotating the object while the source and detector are fixed
Because bone mineral is relatively dense, it attenuates X-ray energy much more than marrow or soft tissue, and thus CT provides a clear contrast between bone and adjacent nonmineralized tissue (Fig. 3). Likewise, bone regions of lower density have less X-ray attenuation than regions of higher density, allowing for discrimination of variations in bone mineral density. The relative X-ray attenuation is expressed as a linear attenuation coefficient [1/cm], which may be converted to Hounsfield units (HU), or simply scaled per mille, that is, ranging from −1000 to +1000. The latter values are typically used to represent the data for display as a grayscale image, and for thresholding. For bone microCT, standard practice is that the linear attenuation is converted to mineral density based on a hydroxyapatite (HA) calibration phantom, as bone mineral is similar to hydroxyapatite. Thus, the units of bone mineral density (BMD) from microCT are [mg HA/cm3]. In summary, microCT attenuation values may be expressed per mille or as BMD [mg HA/cm3].
Fig. 3.
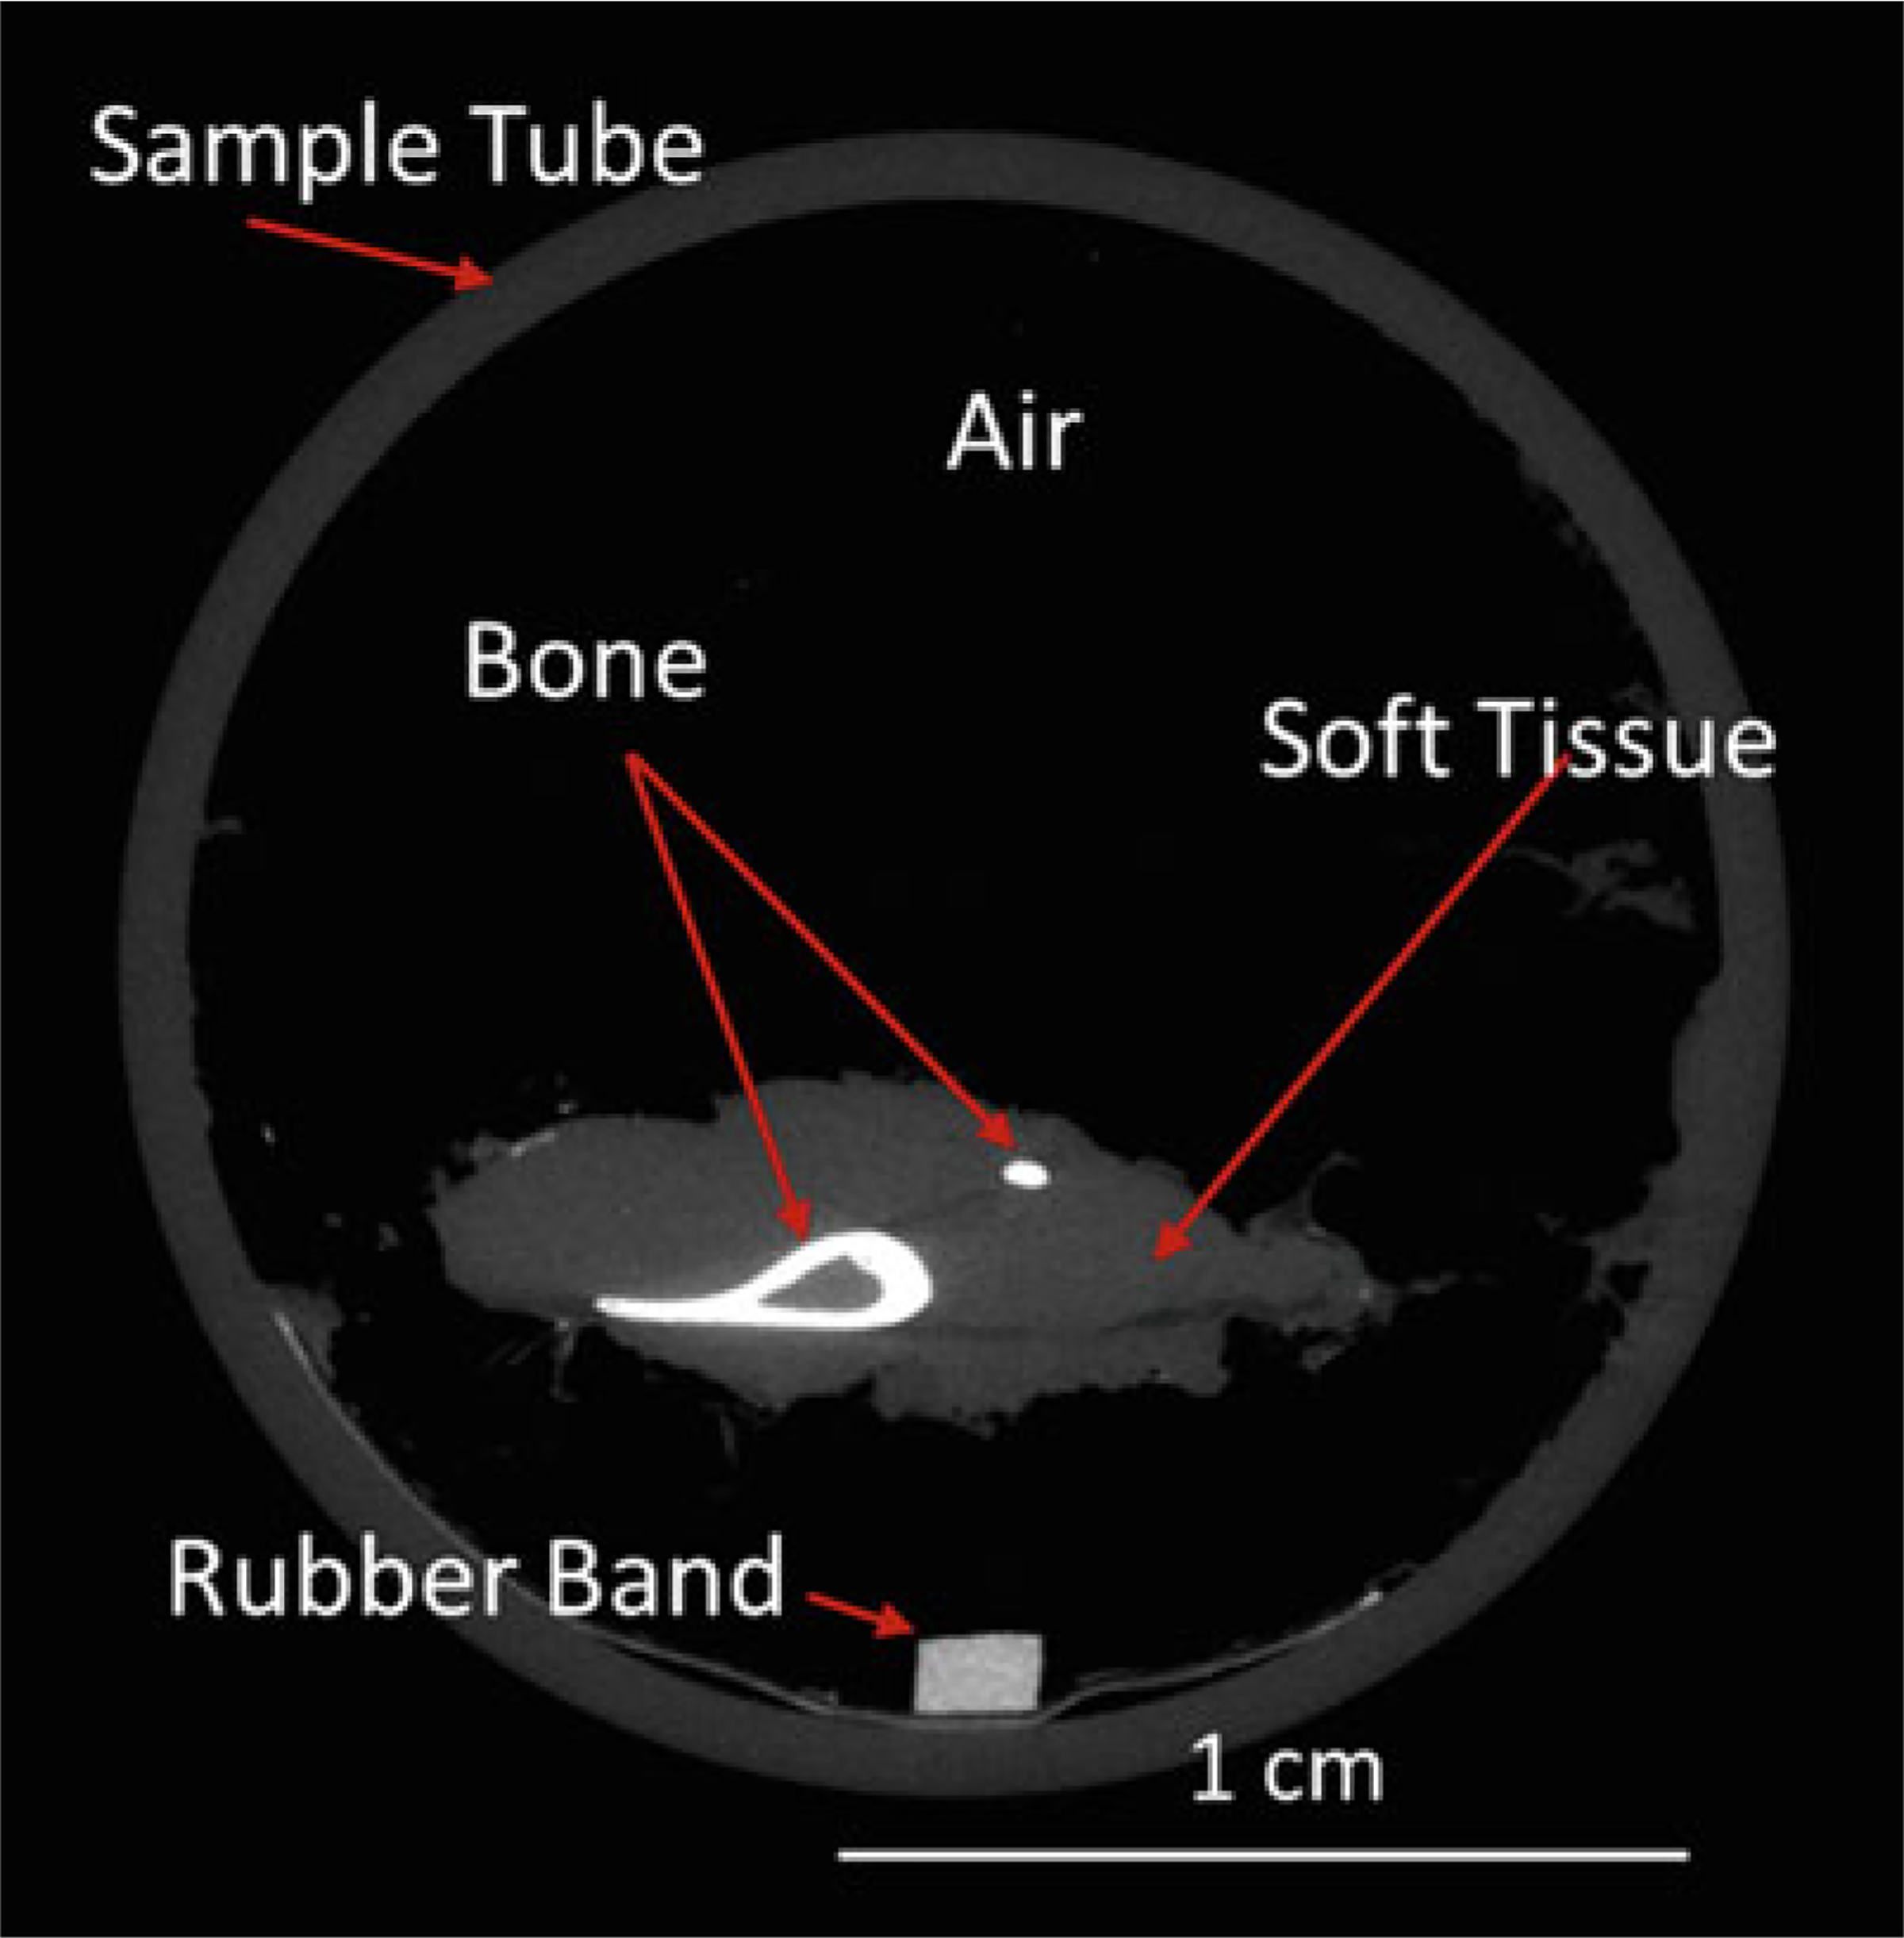
MicroCT slice through sample tube containing a mouse lower leg. This grayscale image illustrates the differing attenuations of mineralized bone (tibia and fibula) compared to surrounding nonmineralized soft tissue and air (background). (Brightness of this image was increased to more easily visualize the soft tissue.) By convention the higher attenuating material is shown as brighter (whiter), although this can be inverted or even reassigned to color. A rubber band was placed with the sample in the tube as a position landmark
There are many parameters that affect how a microCT scan is acquired and the quality of the resulting image. A critical parameter is the nominal voxel size, which is a measure of spatial resolution. The smaller the voxel size, the better the ability to accurately render microstructural features of bone such as trabecular thickness. Assuming isotropic (cubic) voxels, a single dimension is sufficient to describe voxel size. Estimated voxel size is computed as field-of-view [mm] divided by the matrix size [voxel number] used for image reconstruction (Fig. 4). The field-of-view is determined by geometry, namely, the focal distances from the X-ray source to the object, and the object to detector distance. In practice, for Scanco specimen microCT systems the user selects from specimen holders of varying diameters, and the field-of-view equates to the holder diameter. The matrix size is scanner dependent, and can range from 512 × 512 to 4096 × 4096 or higher, depending on the resolution of the X-ray detector. In general, to achieve the highest possible resolution (i.e., smallest voxel size) keep your specimen size as small as possible, that is, use the smallest holder possible. Higher resolution can also be achieved by using a larger matrix size. A common matrix size is 1024 × 1024, corresponding to “standard” resolution on the Scanco μCT 40 system. For example, if you select a field-of-view of 16.4 mm (i.e, 16.4 mm specimen holder), and a matrix size of 1024 × 1024, the nominal voxel size is 16.4/1024 = 0.016 mm, or 16 μm. For the same field-of-view, a matrix size of 2048 × 2048 (‘high’ resolution) gives a voxel size of 8 μm. Additional tube size and resolution combinations for Scanco systems are shown below (Table 1).
Fig. 4.
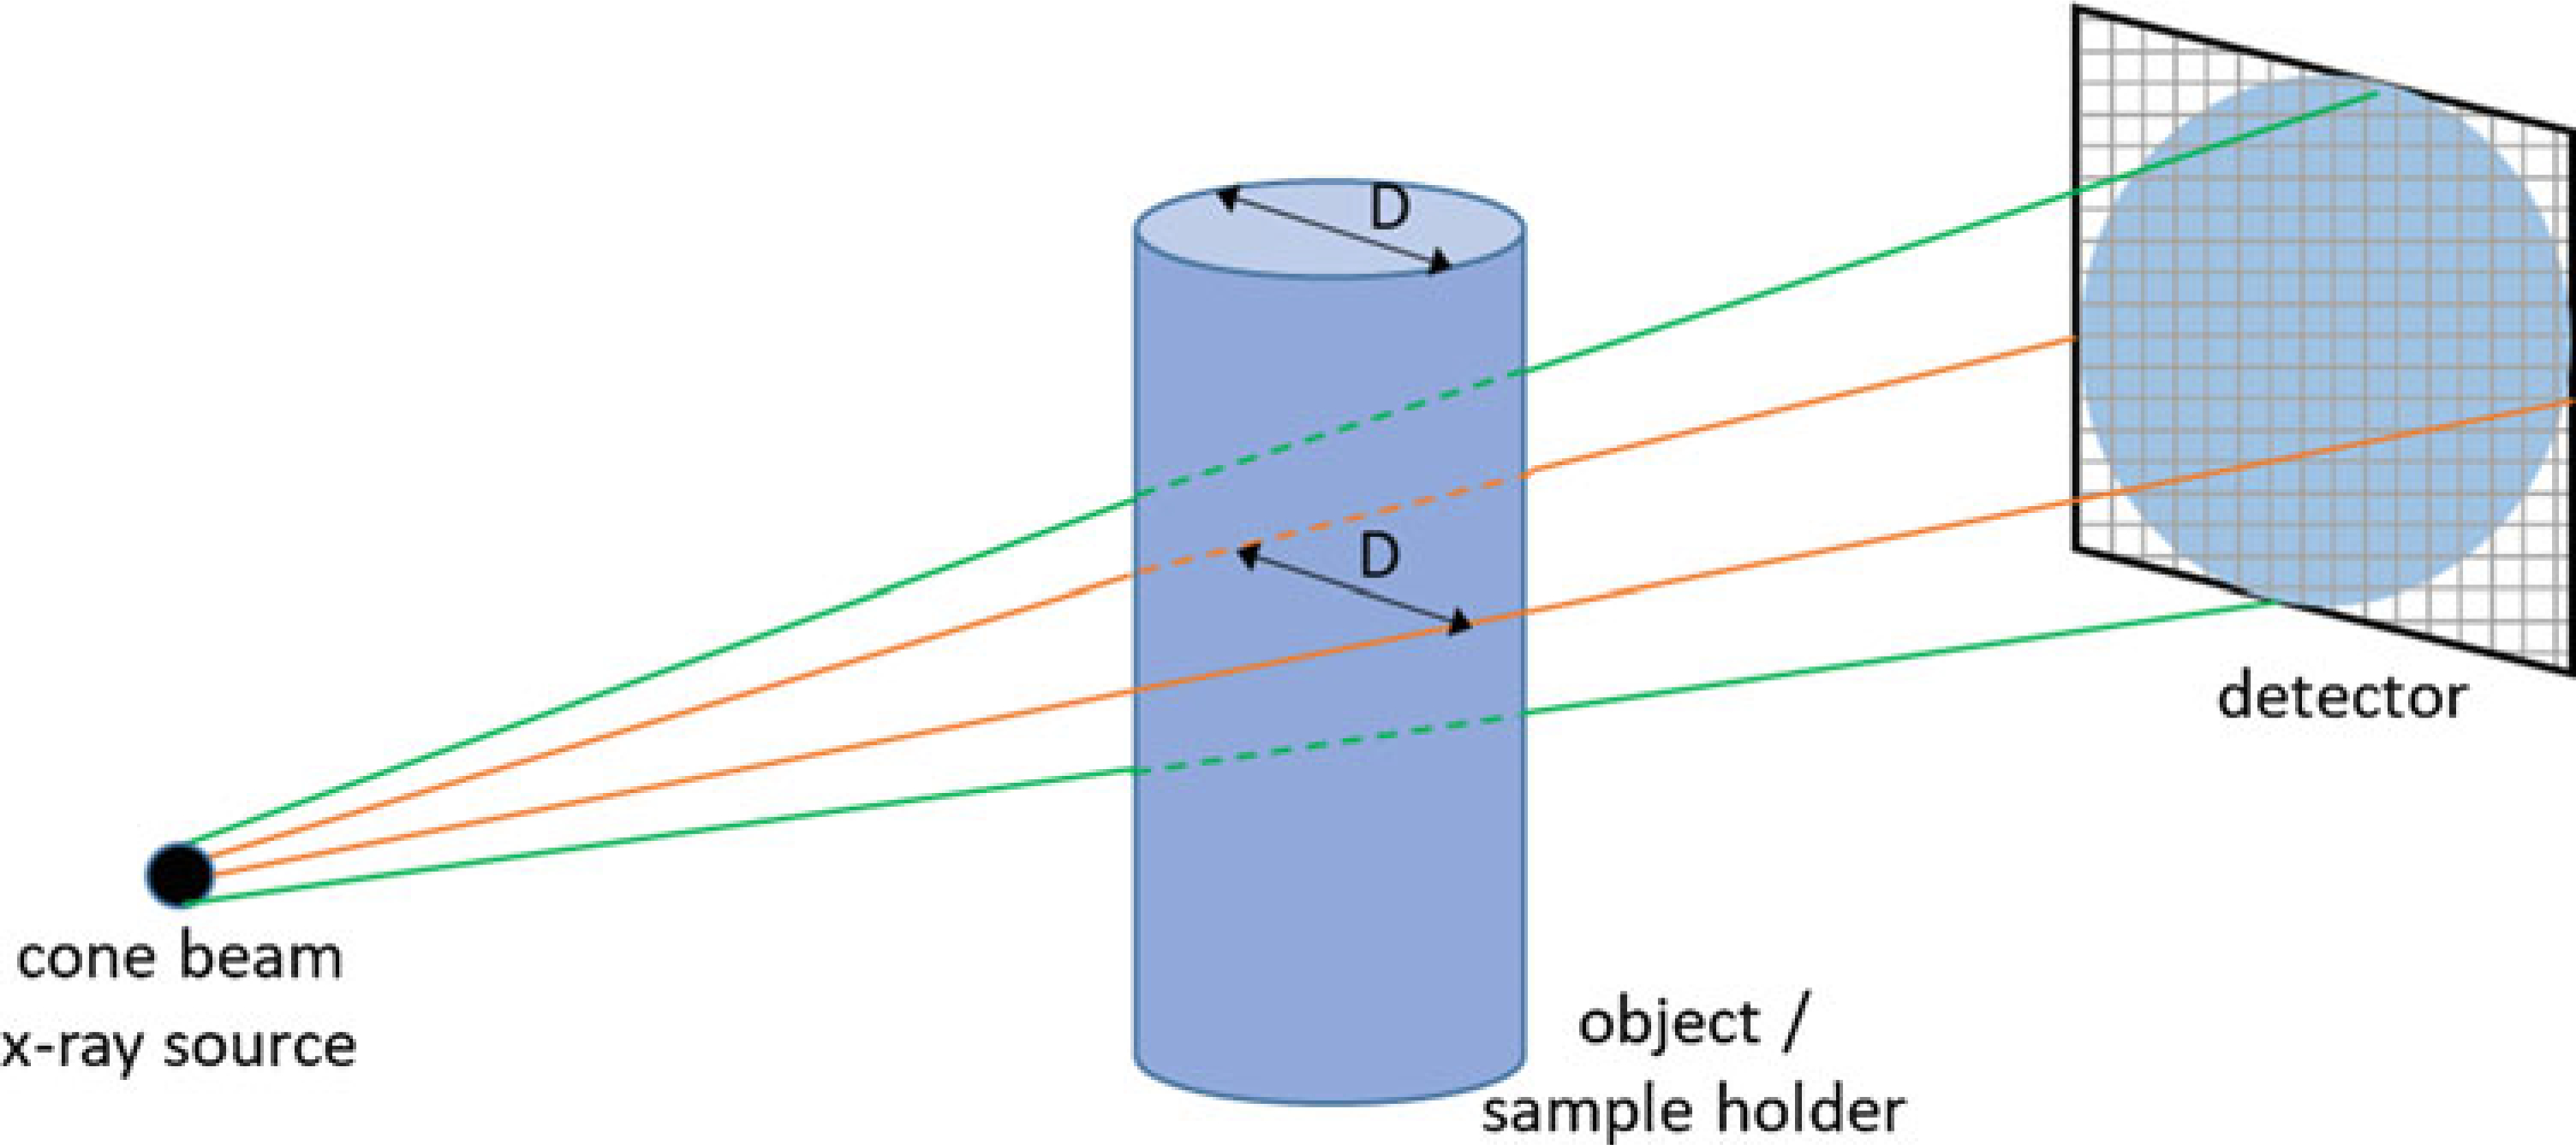
Schematic illustrating source–object–detector geometry. The field-of-view size is the diameter (“D”) of the sample holder (tube). The nominal voxel size is the field-of-view divided by the matrix size of the detector array. Thus, using the smallest sample holder that will contain your samples is recommended to give the best resolution, that is, smallest voxel size. Similarly, selecting a larger matrix size will improve resolution, although at the cost of larger file sizes and slower reconstruction times
Table 1.
Nominal voxel size for different combinations of sample holder tube size and resolution for Scanco μCT 40
| Nominal voxel size | Sample holder (tube) diameter | ||||||
|---|---|---|---|---|---|---|---|
| 12 mm | 16 mm | 20 mma | 25 mm | 30 mm | 35 mm | ||
| Resolution (matrix size) | Low (1024 × 1024) | 12 μm | 16 μm | 20 μm | 25 μm | 30 μm | 35 μm |
| Medium (1024 × 1024) | 12 μm | 16 μm | 20 μm | 25 μm | 30 μm | 35 μm | |
| Higha (2048 × 2048) | 6 μm | 8 μm | 10 μma | 12.5 μm | 15 μm | 17.5 μm | |
Denotes values used for protocol described in Subheading 3
A recent report illustrated the importance of voxel size for quantification of trabecular bone microstructure in mice [4]. Based on these results, a voxel size of 6–10 μm is recommended for accurate determination of key trabecular parameters, including bone volume fraction (BV/TV), number (Tb.N), thickness (Tb. Th), and separation (Tb.Sp). A voxel size of 15–20 μm is acceptable, but a voxel size larger than this is not recommended. These results make sense when considering that the thickness of a mouse trabecula is approximately 40 μm, and as a rule the ratio of feature size to voxel size should be at least 3 or 4:1. Most commercially available scanners are capable of ≤10 μm voxel size, typically as a “high resolution” option. The trade-offs for choosing the highest possible resolution are increased scan time, increased reconstruction time, and increased data file size. (As a rule, if voxel size is decreased by half, the file size increases fourfold.) Over the past decade as computing power has increased (especially with the use of graphical processing units (GPUs)), and disk storage costs have declined, the use of higher-resolution scanning has become more practical and common.
A number of parameter settings are selected by the user in the Control File. Two of these are essential to report in methods sections of papers [1], and are described briefly here. X-ray energy is a critical factor influencing attenuation. This is most commonly specified as the X-ray tube potential (peak voltage [kVp]); a higher kVp produces greater X-ray energy and results in less attenuation through mineral phantoms [5]. It is generally recommended that thicker, denser samples should be scanned at higher voltages (e.g., 70 kVp), yet, on the other hand, the contrast between marrow and bone may be better at lower voltage settings [1]. Another key parameter is integration time [ms], which is analogous to exposure time on a camera. A longer integration time allows more photons to reach the detector and generally improves the image quality, or signal-to-noise ratio (SNR) [1]. The trade-off with longer integration times is longer time for scan acquisition and higher radiation exposure of the sample. (For postmortem bone samples, radiation exposure is not a practical concern.) The other settings that influence SNR are tube current [μA] and frame averaging [number]; although not essential to report, a complete description of scan settings would include these settings as well (Table 2).
Table 2.
Key parameters for microCT scanning
| Parameter | Description | Units |
|---|---|---|
| Voxel size | Measure of nominal spatial resolution; smaller the value the better the resolution | μm |
| X-ray tube potential (peak voltage) | Measure of X-ray energy; higher voltage results in less attenuation through denser/thicker specimens | kVp |
| X-ray intensity (current) | Electrical current through X-ray tube; higher current produces more photons and better signal-to-noise | μA |
| Integration time | Duration of time for photons to hit detector for each projection; longer times give better signal-to-noise but increases scan time | ms |
| Frame averaging (average data) | Number of repeated measurements at each projection; higher number gives better signal-to-noise but increases scan time | n |
2. Materials
Scanco μCT 40 (Scanco Medical, Switzerland).
Calibration Phantom (Scanco Medical).
Sample holder (Scanco Medical).
Dissection equipment (scissors, forceps, etc.).
4% paraformaldehyde.
70% ethanol.
Phosphate buffered saline.
Parafilm®.
2 ml snap lock Eppendorf tube.
15 ml conical tube.
6 cm petri dish (60 × 15 mm).
2% agarose: Add 100 ml distilled water to 2 g agarose powder in a glass bottle. Stir to suspend agarose. Cover the bottle with a cap (do not close tightly) and heat in a microwave until all agarose is dissolved. Allow it to cool to approximately 38 °C before using (see Note 1).
3. Methods
The methods below are for microCT scanning and analysis of intact (whole) mouse femurs, using a specimen microCT scanner (see Note 2). An overview of these steps is shown in Fig. 5. MicroCT scanning is nondestructive, so it may be followed by other assays, typically either (1) histology (paraffin or plastic embedding) or (2) mechanical testing.
Fig. 5.
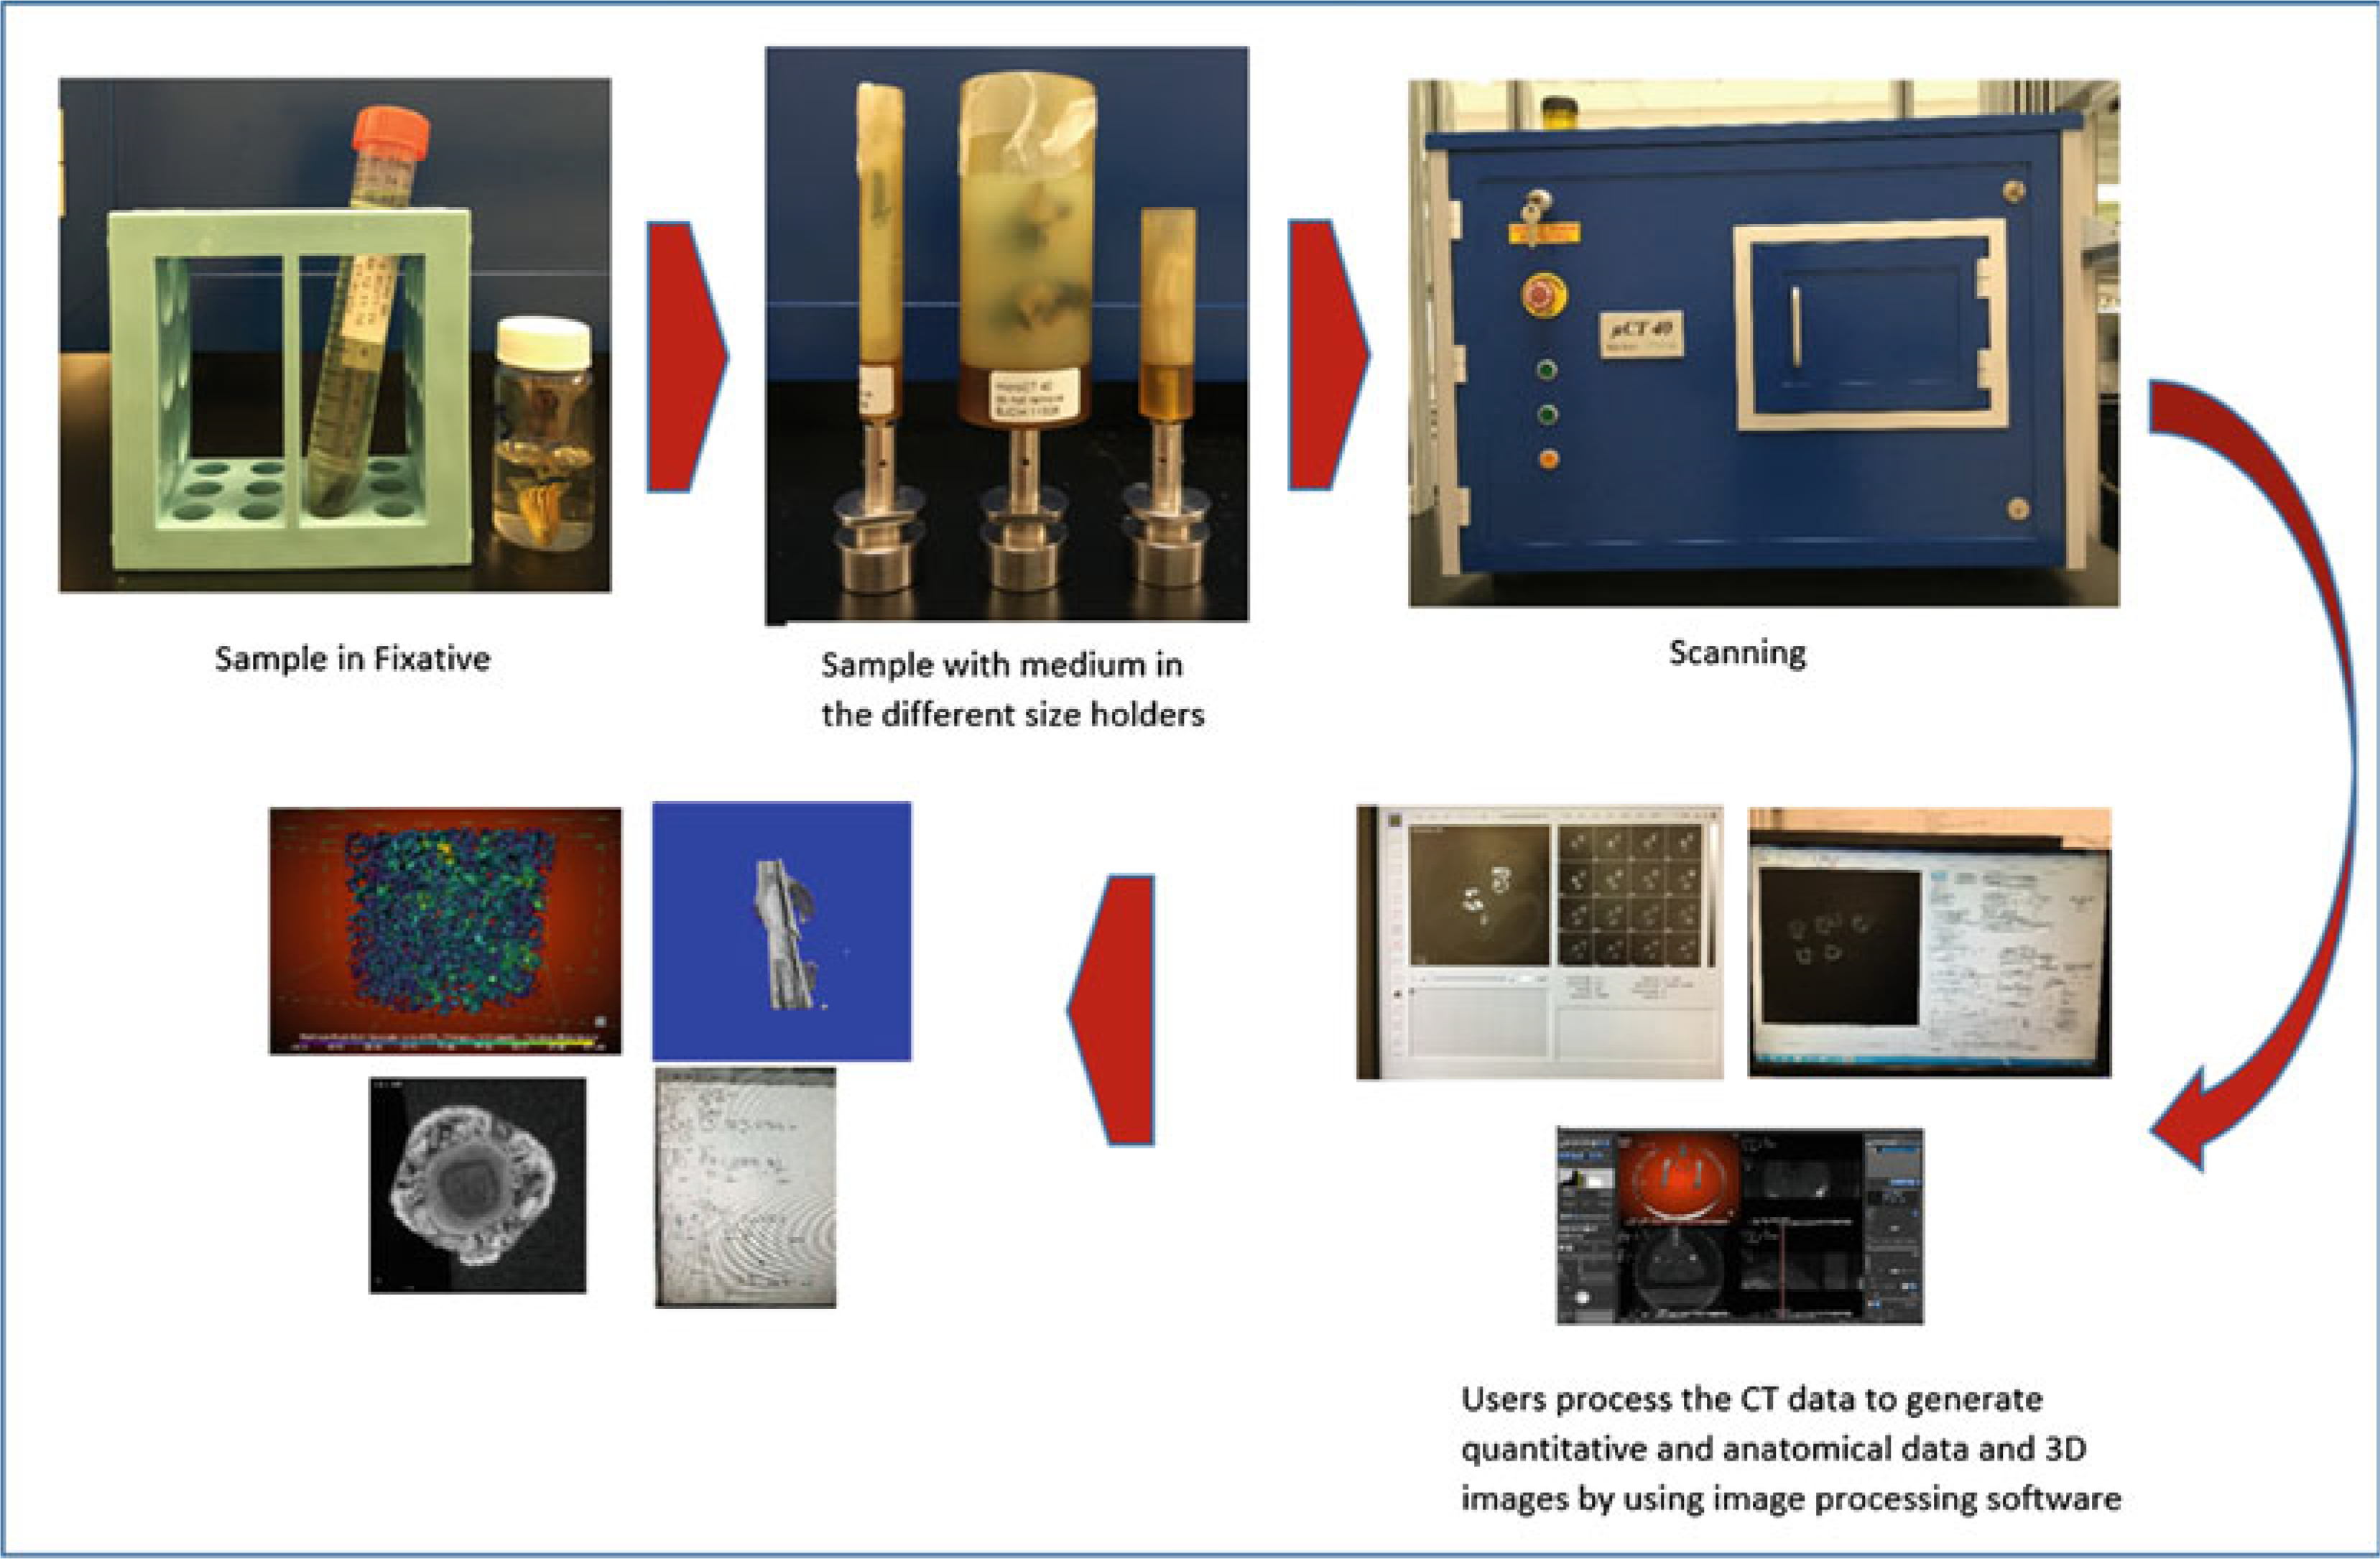
MicroCT workflow
3.1. Sample Preparation, Fixation, and Embedding
Dissection: Within 10–15 min (see Note 3) after euthanasia, use scalpel and scissors to remove femurs from mice. Take care to keep the entire femur intact; the femoral head and distal (knee) epiphysis can easily separate from the rest of the bone, especially in younger mice.
If doing histology after microCT, remove enough muscle to facilitate good infiltration of solutions, but leave the bone covered by a layer of muscle and leave the periosteum intact (Fig. 6a) (see Note 4).
If doing mechanical testing after microCT, remove as much soft tissue as possible, especially along the diaphysis, which should be “down to the bone”. It is acceptable to leave small amounts of tissue at the two ends (Fig. 6b) (see Note 4).
If doing histology after microCT, fix the bones according to your lab’s histology protocol (e.g., 4% paraformaldehyde for 48 h), transfer to 70% Ethanol, then store at 4° until ready to scan (see Note 5).
If doing mechanical testing after microCT or if no other assays are planned, wrap the bones in gauze or paper towels that have been soaked with 1× PBS. Wrap in plastic wrap, then place in individual labeled tubes, for example, 2 ml snap lock Eppendorf or 15 ml conical tube. Freeze at −20 °C until ready to scan. Bones can be stored for up to 1 year. When ready to scan, thaw samples at room temperature for 30–60 min, keeping them soaked with 1× PBS.
Choose the 20 mm diameter sample holder (see Note 6) (Fig. 7).
To minimize sample movement (and avoid motion artifact) during scanning, the specimen is embedded in medium before placement in the sample holder. We use 2% agarose, as indicated above in Subheading 2, item 12. This also will keep the sample hydrated during scanning, and provide a water/soft-tissue like background for the CT images. The method here describes staging for 10 bones to be placed in a 20 mm tube and scanned in one session. Bones are arranged in two stacks of five per stack. Use an asymmetric arrangement to facilitate identifying the individual bones (Fig. 8). It is essential to record in your lab notebook which bone is in which position. You can work with variations of this method to scan one or more femur per session (see Note 7).
Add a small amount of warm (approx. 38 °C), liquid agarose to cover the bottom of a Petri dish to make a base layer. Let gel cool until firm.
Place a rubber band that is about the length of one of the bones into the dish for a fiducial marker to help locate which bone is where in the scan (Fig. 9a).
Place two bones next to the rubber band (the first layer). Try to align the mid-point of bones. Space between bones is approximately 2.5 mm. The rubber band and bones should fit inside a width of approximately 18 mm. Add liquid agarose to cover bones.
Pour a layer of agarose over the first layer to make a barrier between the first and the second layer, and allow to cool.
Place three bones on the barrier (approx. 18 mm total width) and add agarose to cover (Fig. 9b).
After agarose is solidified, use a razor to cut a block containing the samples to the approximate dimensions of: 18 × 18 × 18 mm. Place the block into the 20 mm sample tube so that the long axis of the femurs aligns with the long axis of the tube (Z direction). By convention we position the knee (distal) end toward the bottom of the tube and the femoral head (proximal) toward the top.
(Optional) Follow Subheading 3.1, steps 8–13 to make another stack of five bones and add it into the tube.
Fill the tube with liquid agarose and let it harden.
Cover the tube with Parafilm®. Be sure that the film is tightly adhered to the tube, and trim any excess (see Note 8).
Fig. 6.
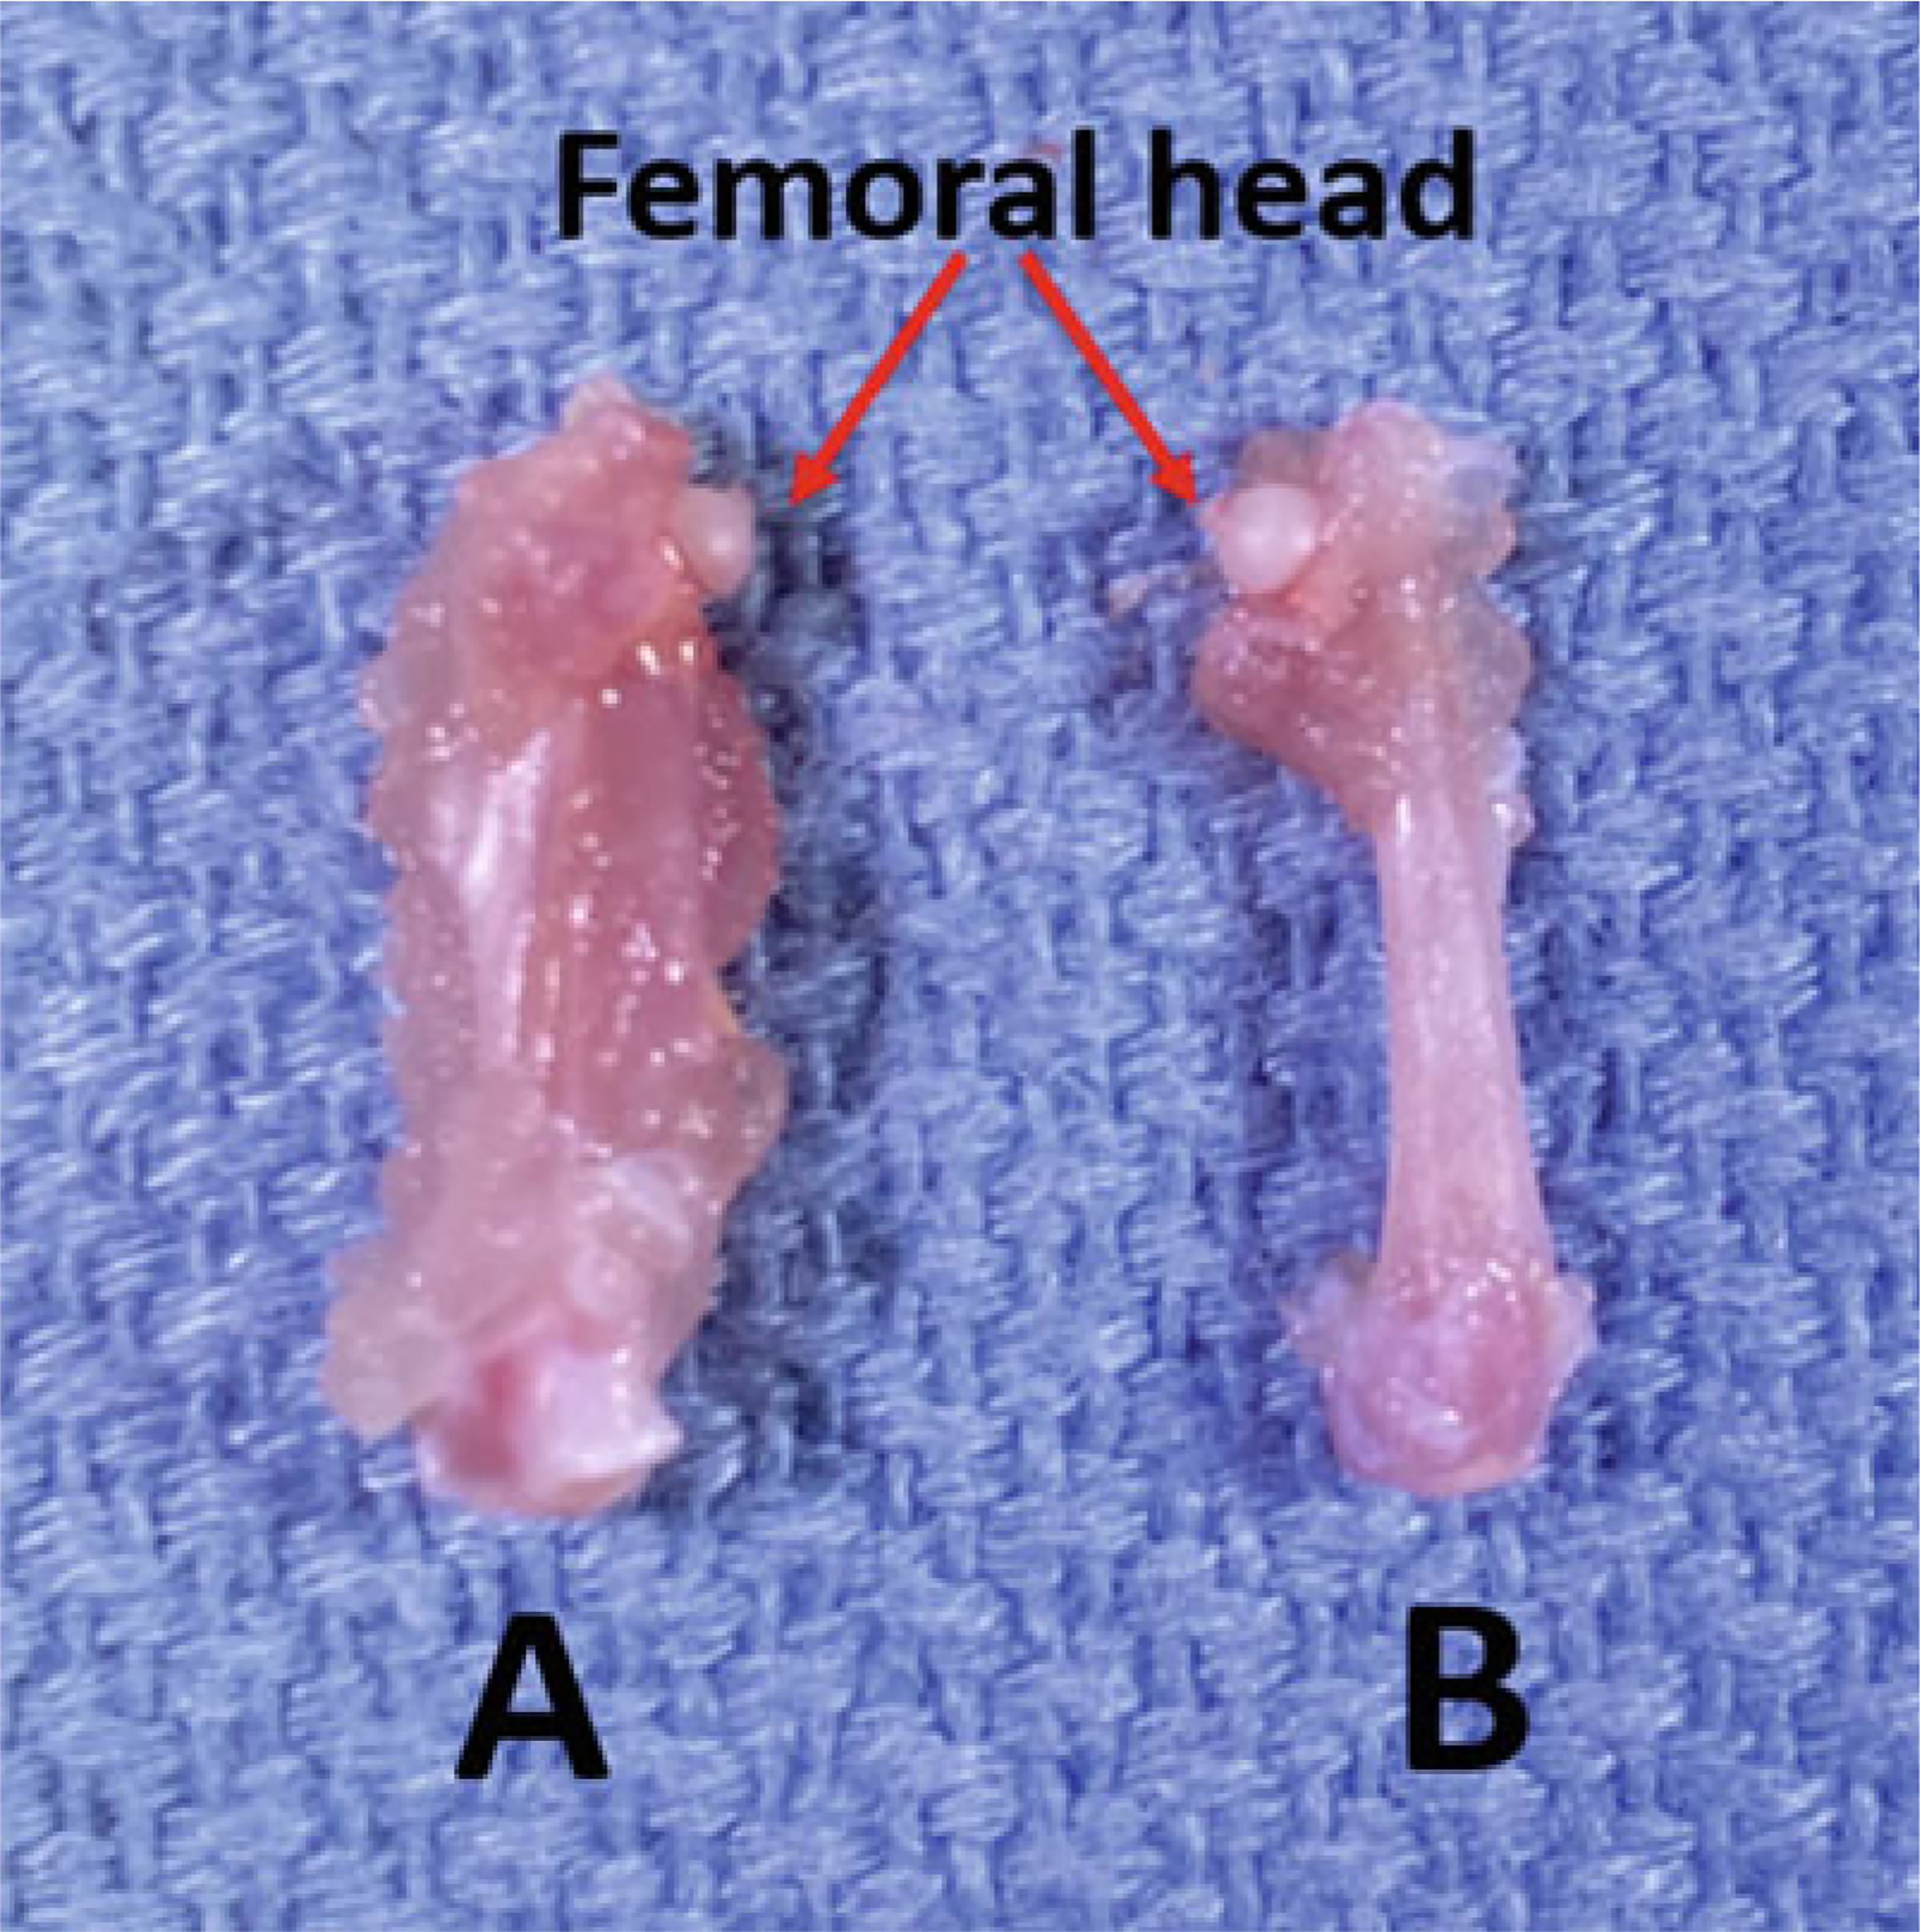
Dissected mouse femurs (a) with and (b) without muscle
Fig. 7.
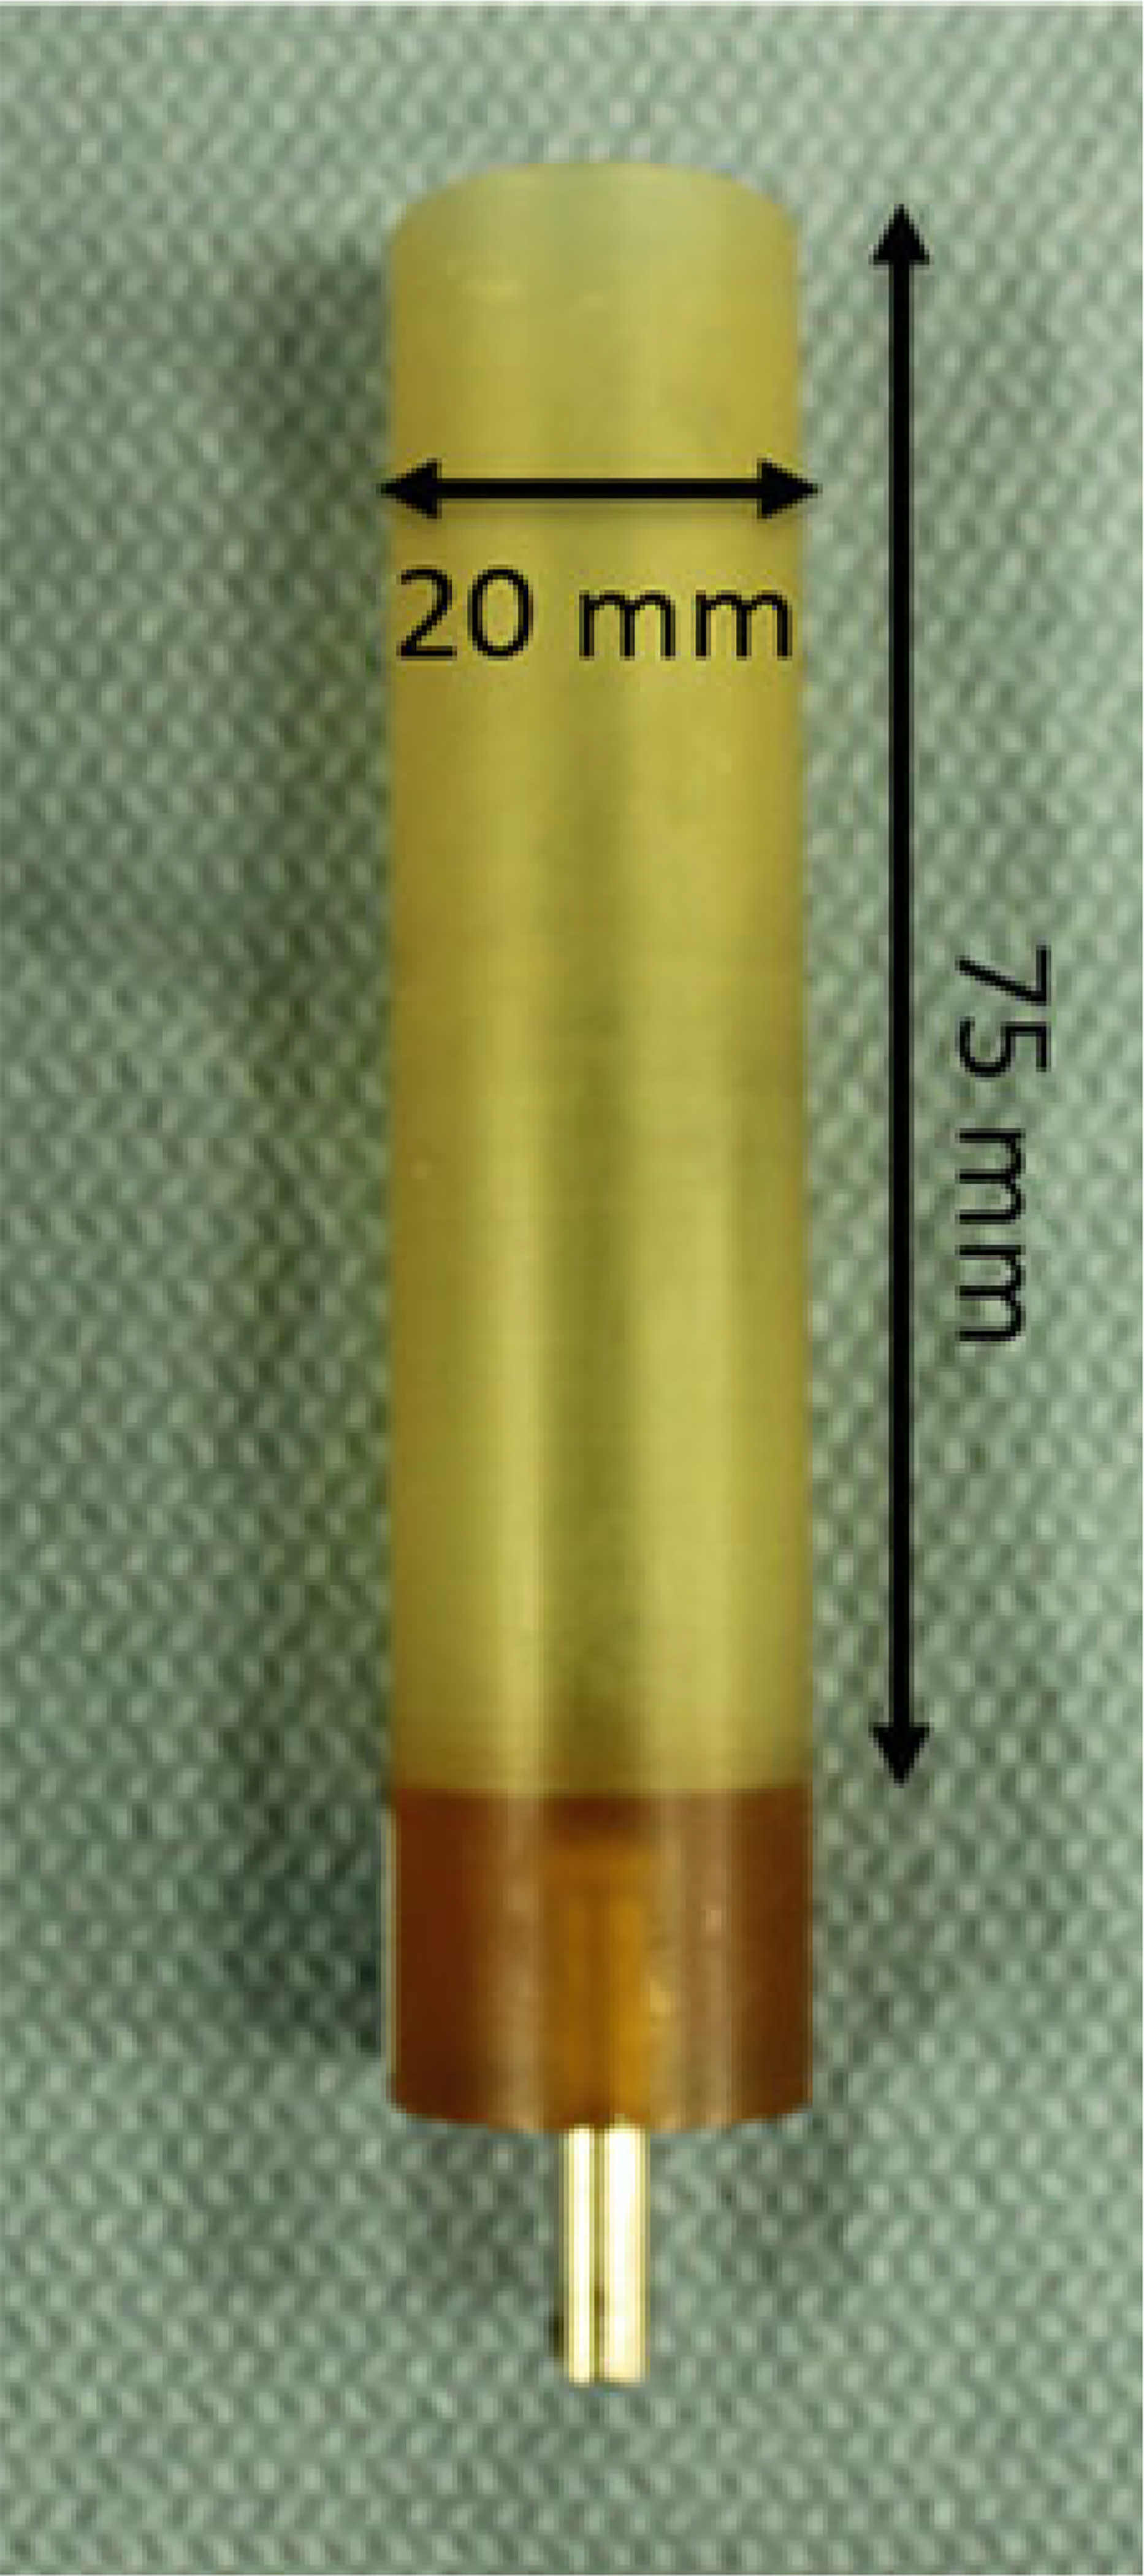
Scanco PEI (polyetherimide) sample tube. Outer diameter is 20 mm; inner diameter is 18.5 mm. Stainless steel pin aligns tube in the scanner
Fig. 8.
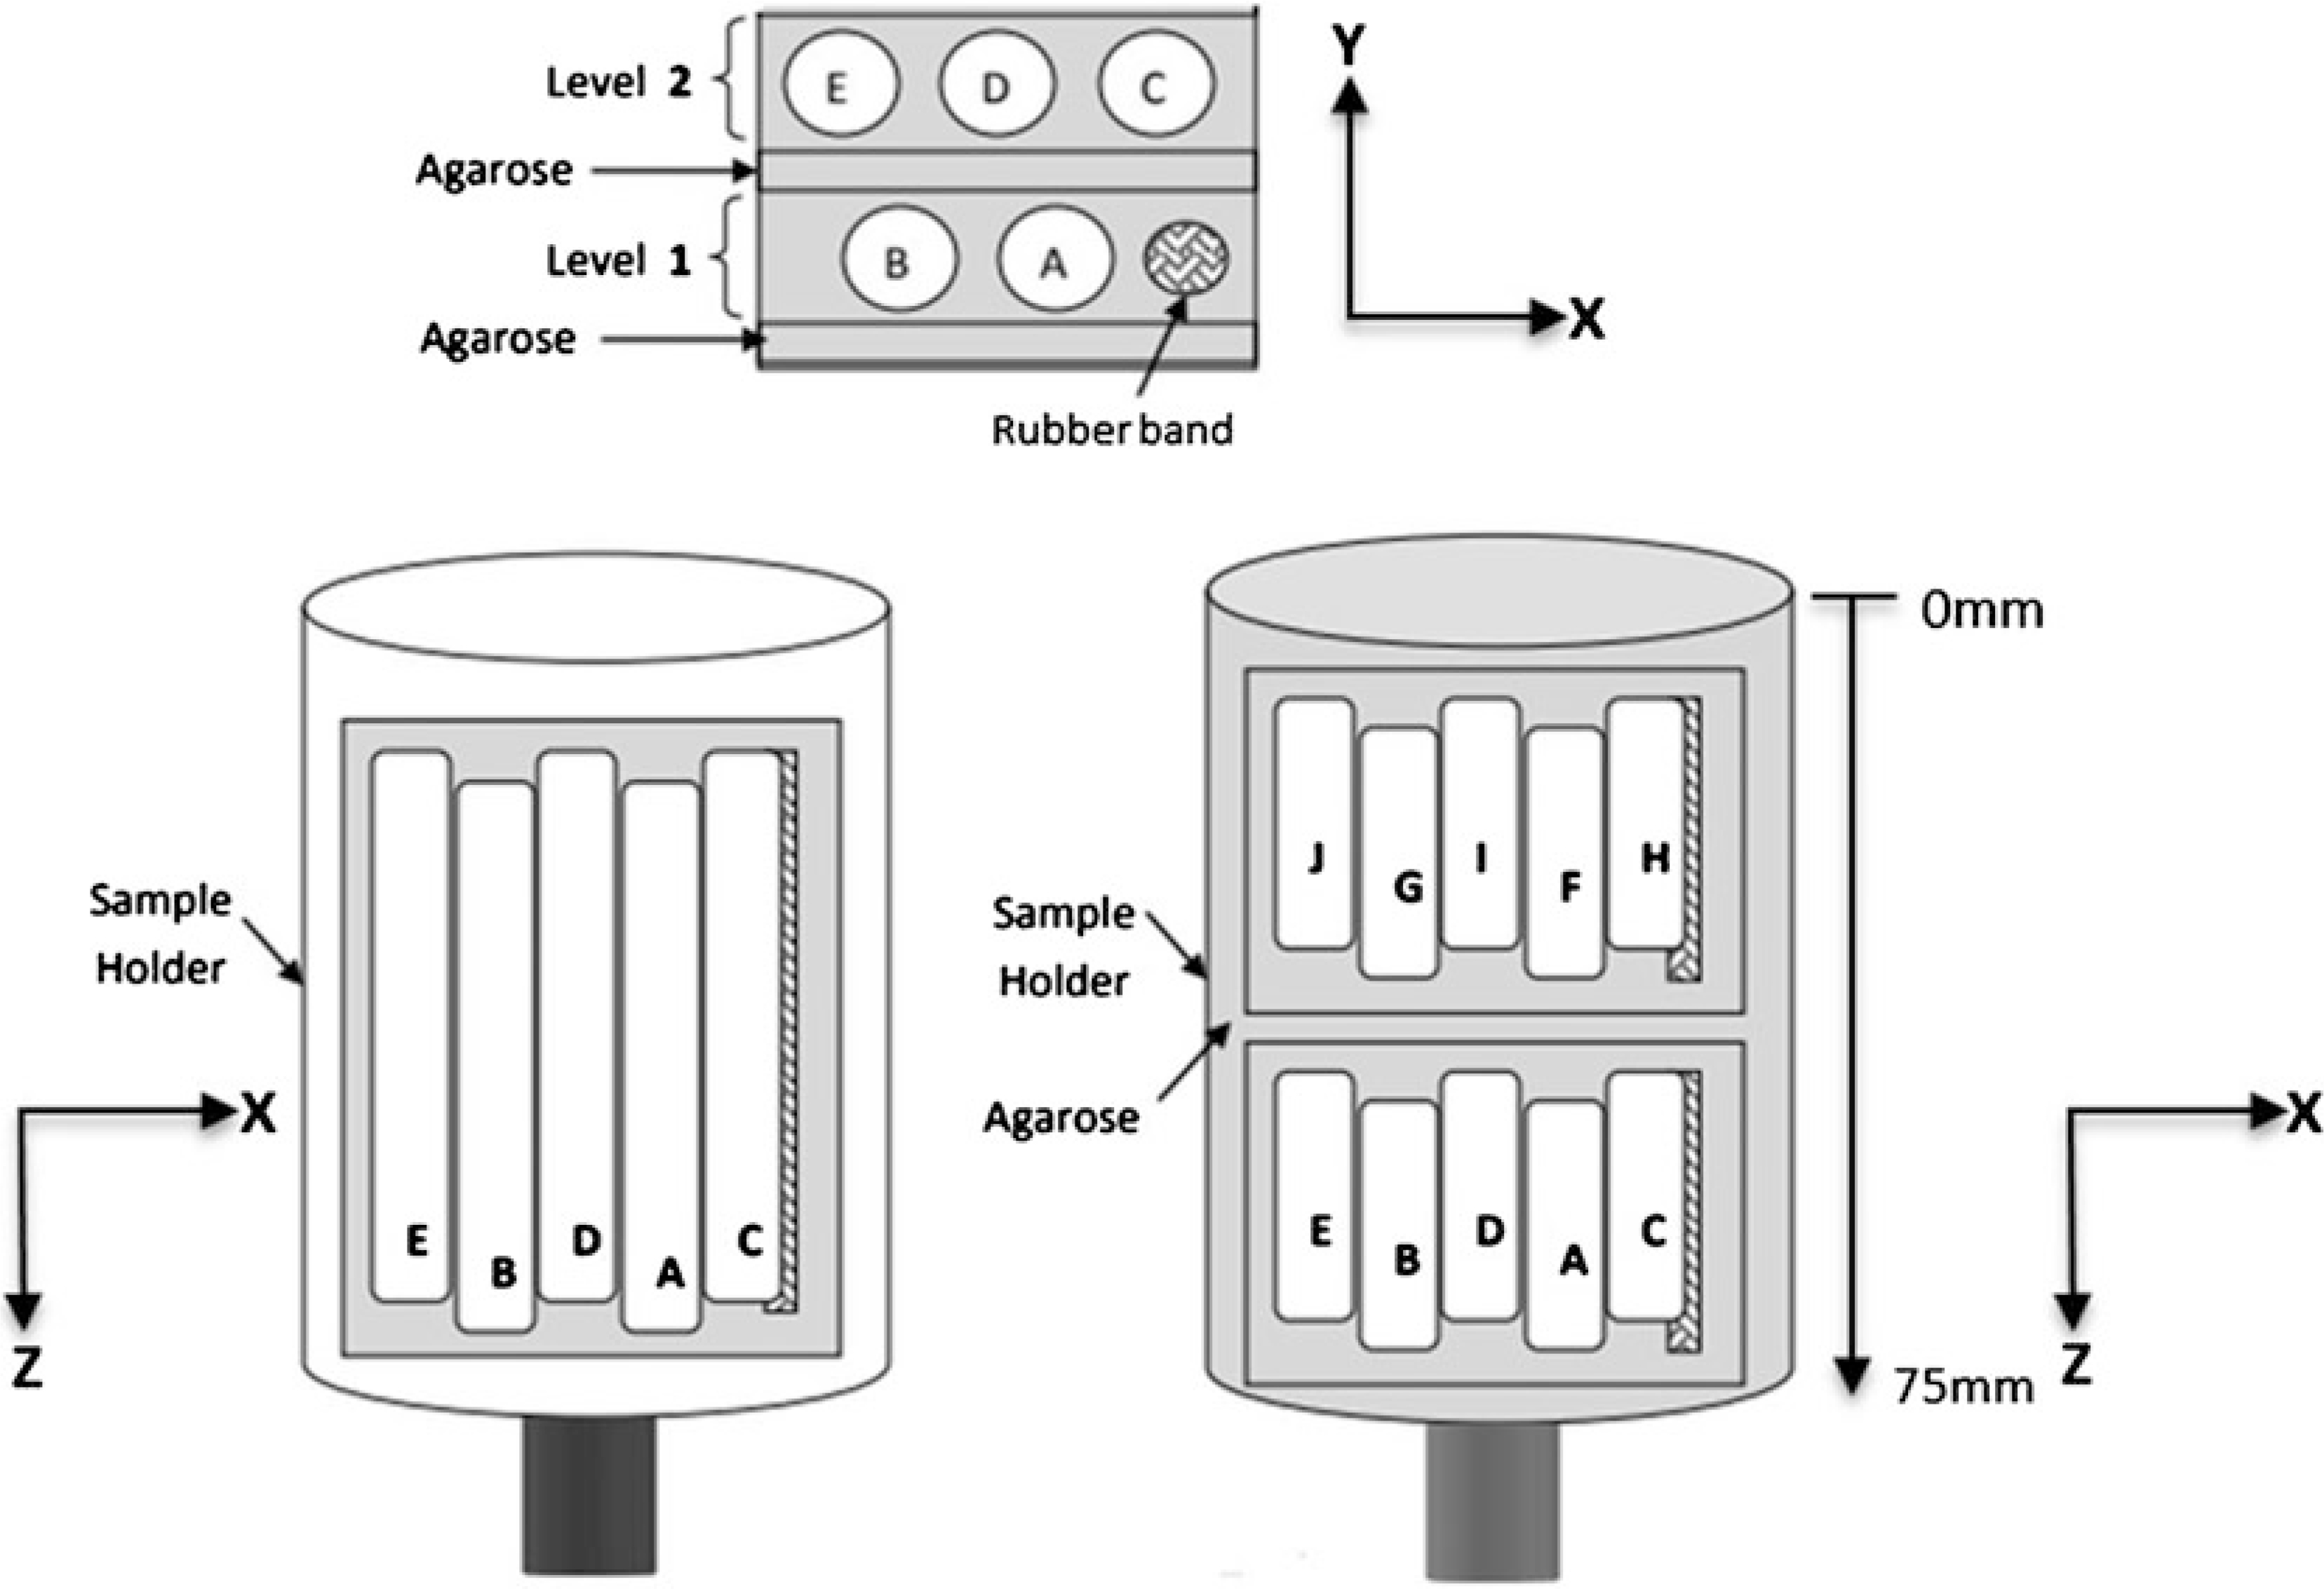
Sketch illustrates asymmetric positioning for five femurs in a single stack, allowing for multiple bones to be scanned simultaneously in a single measurement. Additional stacks can be placed in the sample holder and scanned as additional measurements in batch mode. Further, if your system is equipped with a sample changer, you can load up to 10 holders for batch mode scanning
Fig. 9.
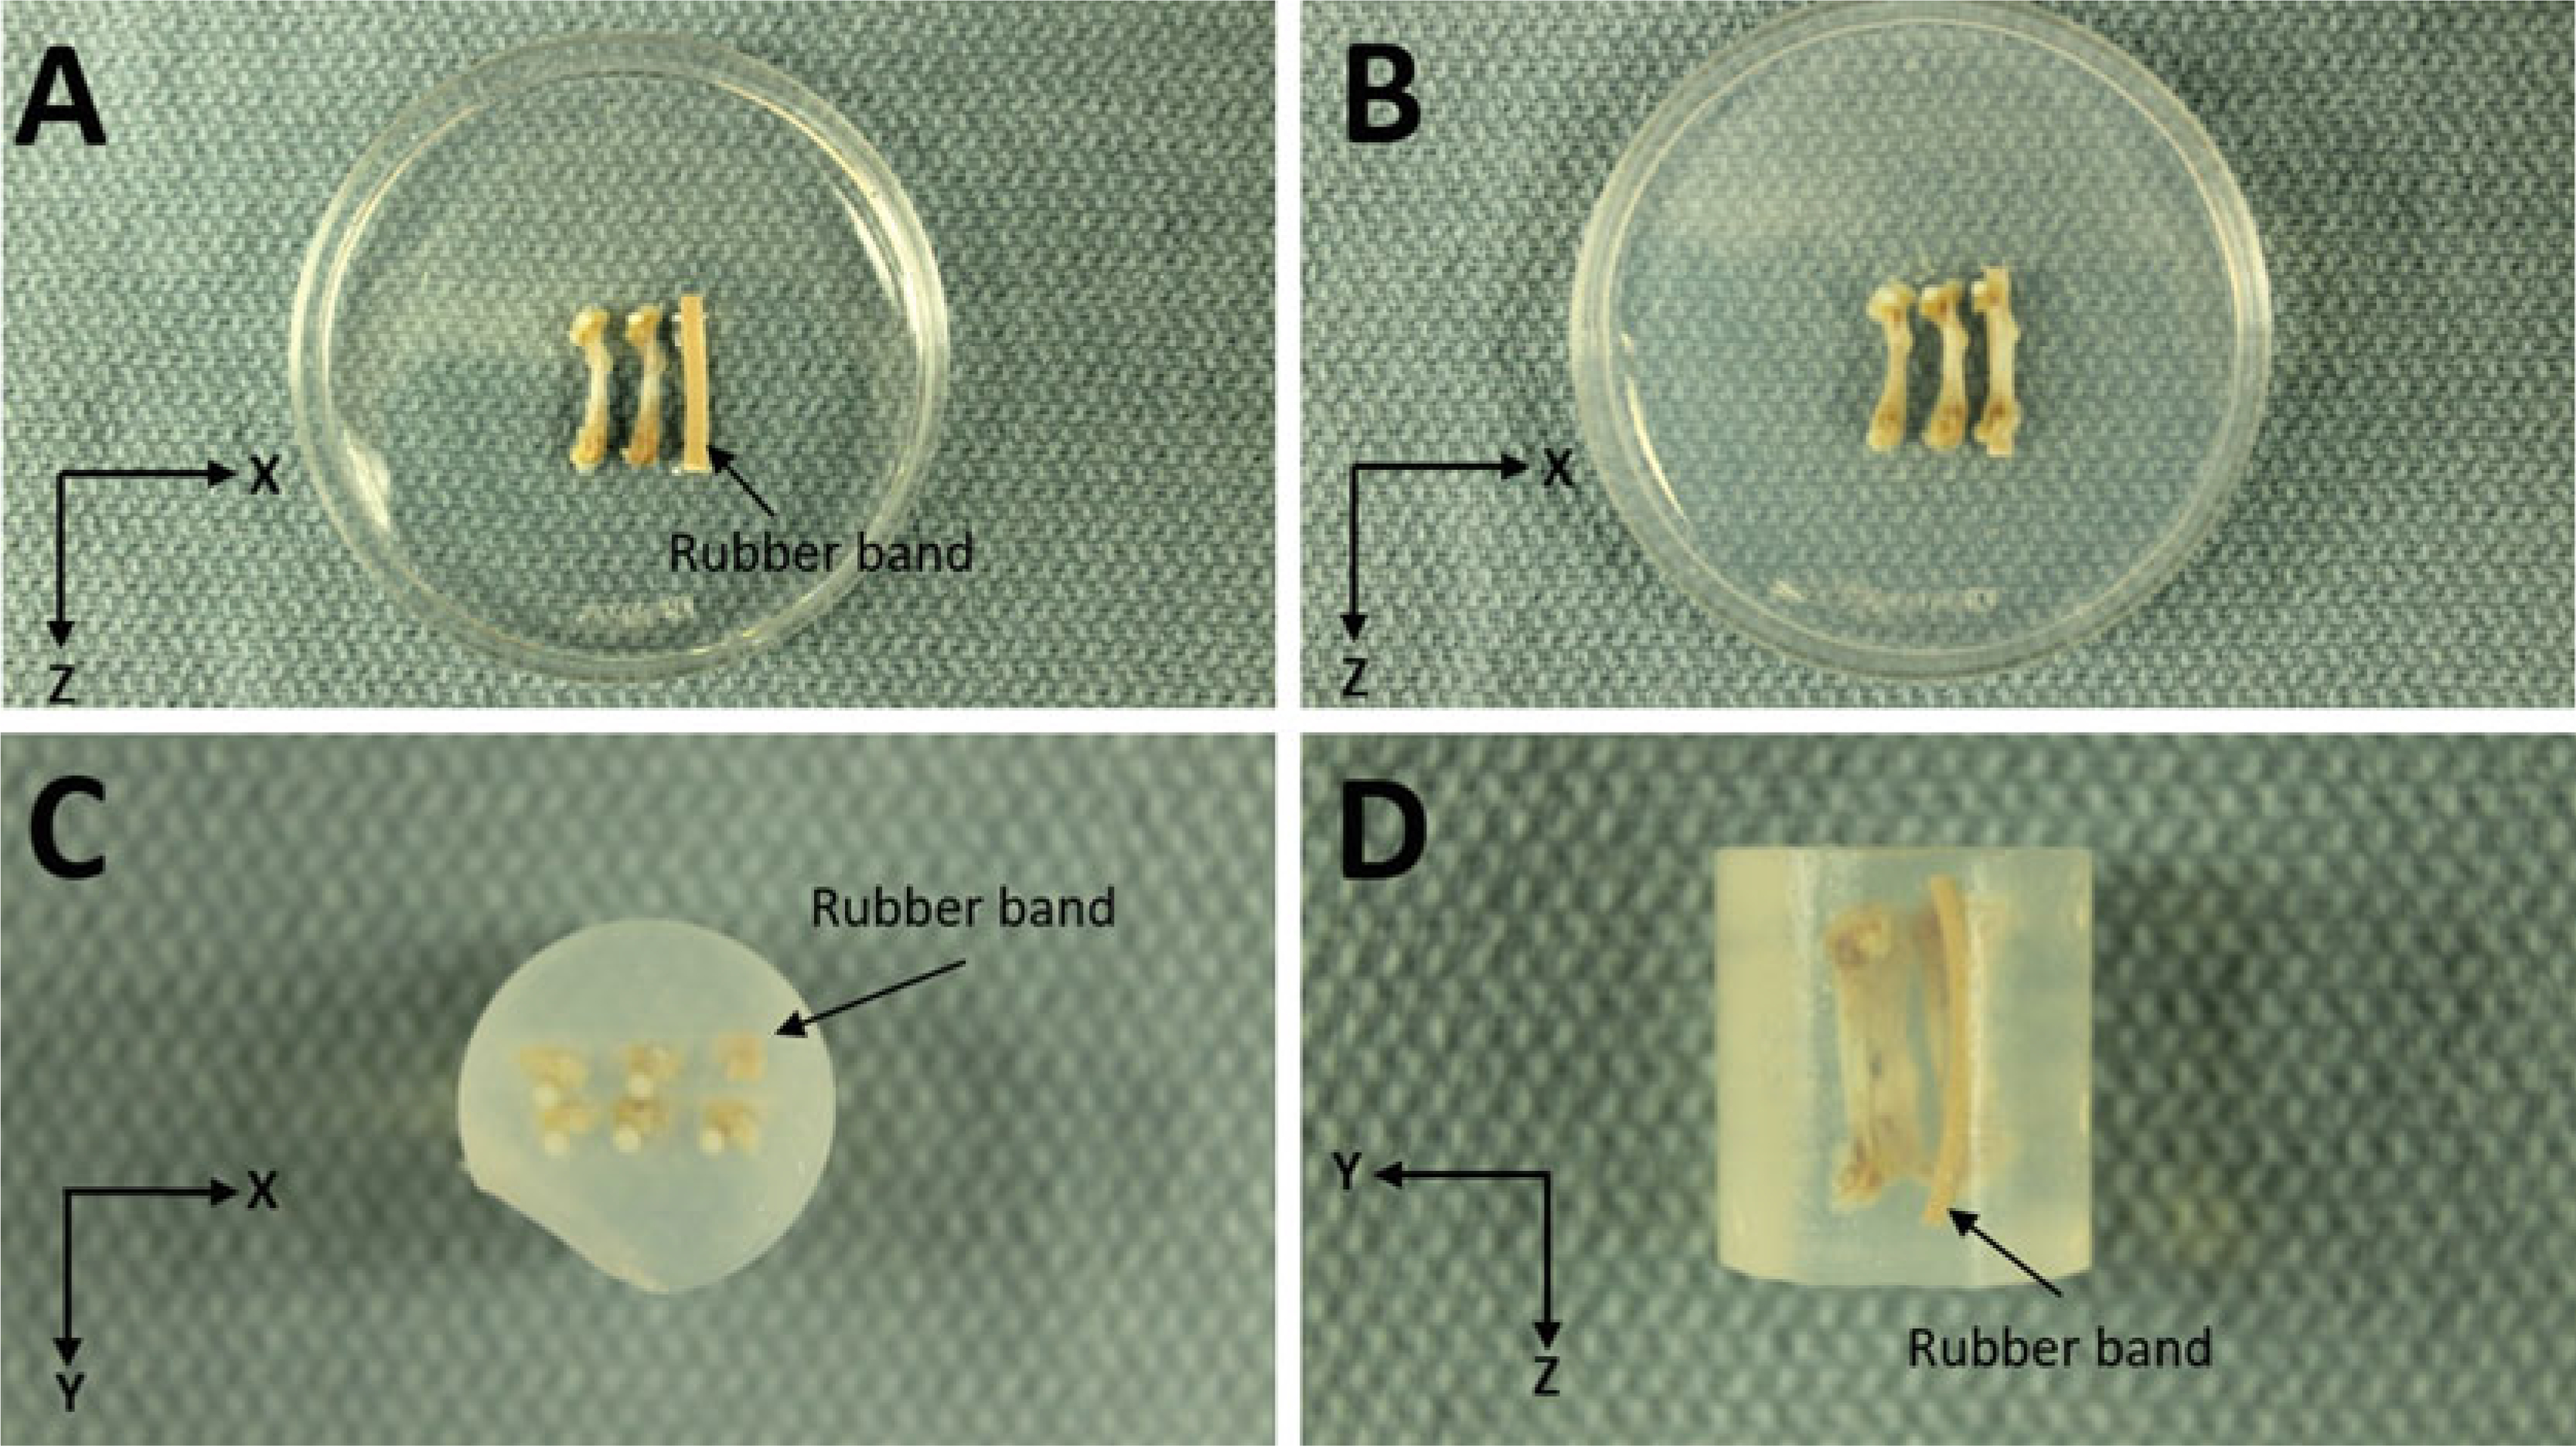
Agarose Embedding. (a) First layer with rubber band marker and two femurs. (b) Second layer with three femurs. (c) Top view looking down on femoral heads. (d) Side View
3.2. Labeling Samples, Defining Region of Interest (ROI), and Generating Measurements
Place tube(s) in the scanner (Fig. 10). If the system has a carousel, place the first sample holder in the carousel and note which position (e.g., position 1). Add additional sample holders as necessary and record their positions. Prior to scanning any samples, the system needs to have a sample number that is system generated. Each sample number requires a name.
Click on the “Create/Change Sample Data” (Fig. 11, #1).
Enter a descriptive sample name in the “Name” field (Fig. 12) (see Note 9).
Click “Save.” Record the sample number.
Begin measurements by clicking on the “Perform Measurements” (Fig. 11, #2).
Click on the “Yes” for starting a measurement (Fig. 13a).
Enter Sample Number (Fig. 13b)—enter the sample number that was created in Subheading 3.2, step 4.
Check carousel positions (Fig. 14). The program shows the valid (occupied) carousel positions (marked in green). Select one highlighted carousel position.
In the Measurement window, create a new or select an existing control file.
If creating a new control file, set the scanning parameters in Subheading 3.2, steps 11–17) (Fig. 15). If using a saved control file, check/edit the parameters.
Holder type (Fig. 15, #1): choose the sample holder that matches the size of the holder in this carousel position. For our example, select “‘20 mm × H 75 mm.”
Energy/intensity (Fig. 15, #2): choose 70 kVp, 114 μA, 8 W from one of the preset combinations (see Note 10).
Resolution (Fig. 15, #3): select “High” resolution (see Note 11).
FOV/Diameter [mm]: leave setting at ‘20.5’ to match the sample holder size (see Note 12).
Voxelsize (μm) (Fig. 15, #4): based on sample holder size and resolution, the system sets the Voxelsize automatically (Table 1). For this example it is 10 μm.
Integration time (ms) (Fig. 15, #5): select 300 ms (see Note 13).
After creating or selecting the Control file, click on the “Scout View” in the main measurement window (Fig. 16a) to bring up the Scout View window (Fig. 16b). This window is used to define the initial ‘Scout scan’ which is a low-resolution 2D projection image of the specimen holder.
Adjust the Startposition and Endposition sliders to 0 and 80 mm, respectively, to acquire a scout scan of the entire sample holder. Click on the “Scout View” button in the upper right of the window (Fig. 16b) to acquire the scout scan, which may take a few minutes.
We recommend doing the cortical and cancellous bone regions as two separate measurements (Fig. 17). Define the cortical region first, then add a new scan for the cancellous region (see Note 15).
After the Scout View scan is complete and displayed on the screen, click on “Reference-Line” (Fig. 16b). The Reference lines are used to determine the longitudinal (z-axis) extent of the scan region (see Note 16). Use the mouse to set reference lines indicating the start and end positions for the scan (Fig. 16c).
Click on the left mouse button to fix the reference lines once ROI is defined.
Click on the “Add Scan” (Fig. 16b).
To add Cancellous region, repeat Subheading 3.2, steps 21–23. Similarly, if you wish to scan another stack of bones in the same sample holder, repeat these same steps.
When done adding scans, click on the “OK” (Fig. 16b).
If you wish to scan bones in another sample holder, go to Subheading 3.2, step 8 and select a new carousel position. Then repeat Subheading 3.2, steps 9–25.
When all the scans are added for all sample holders, click on the “Task List” (Fig. 16a) to display each scan that was added and then click on the “Submit Batch Scans” button. The Measurement window will close.
Enter “que” in command prompt window to see the list of active measurements. Once a measurement is complete, its entry will no longer be on the list. The system will start to acquire your raw images, followed by image reconstruction resulting in two files per measurement (see Note 17). When reconstruction is complete, you can proceed to Subheading 3.3 for Image Analysis and Evaluation.
Fig. 10.
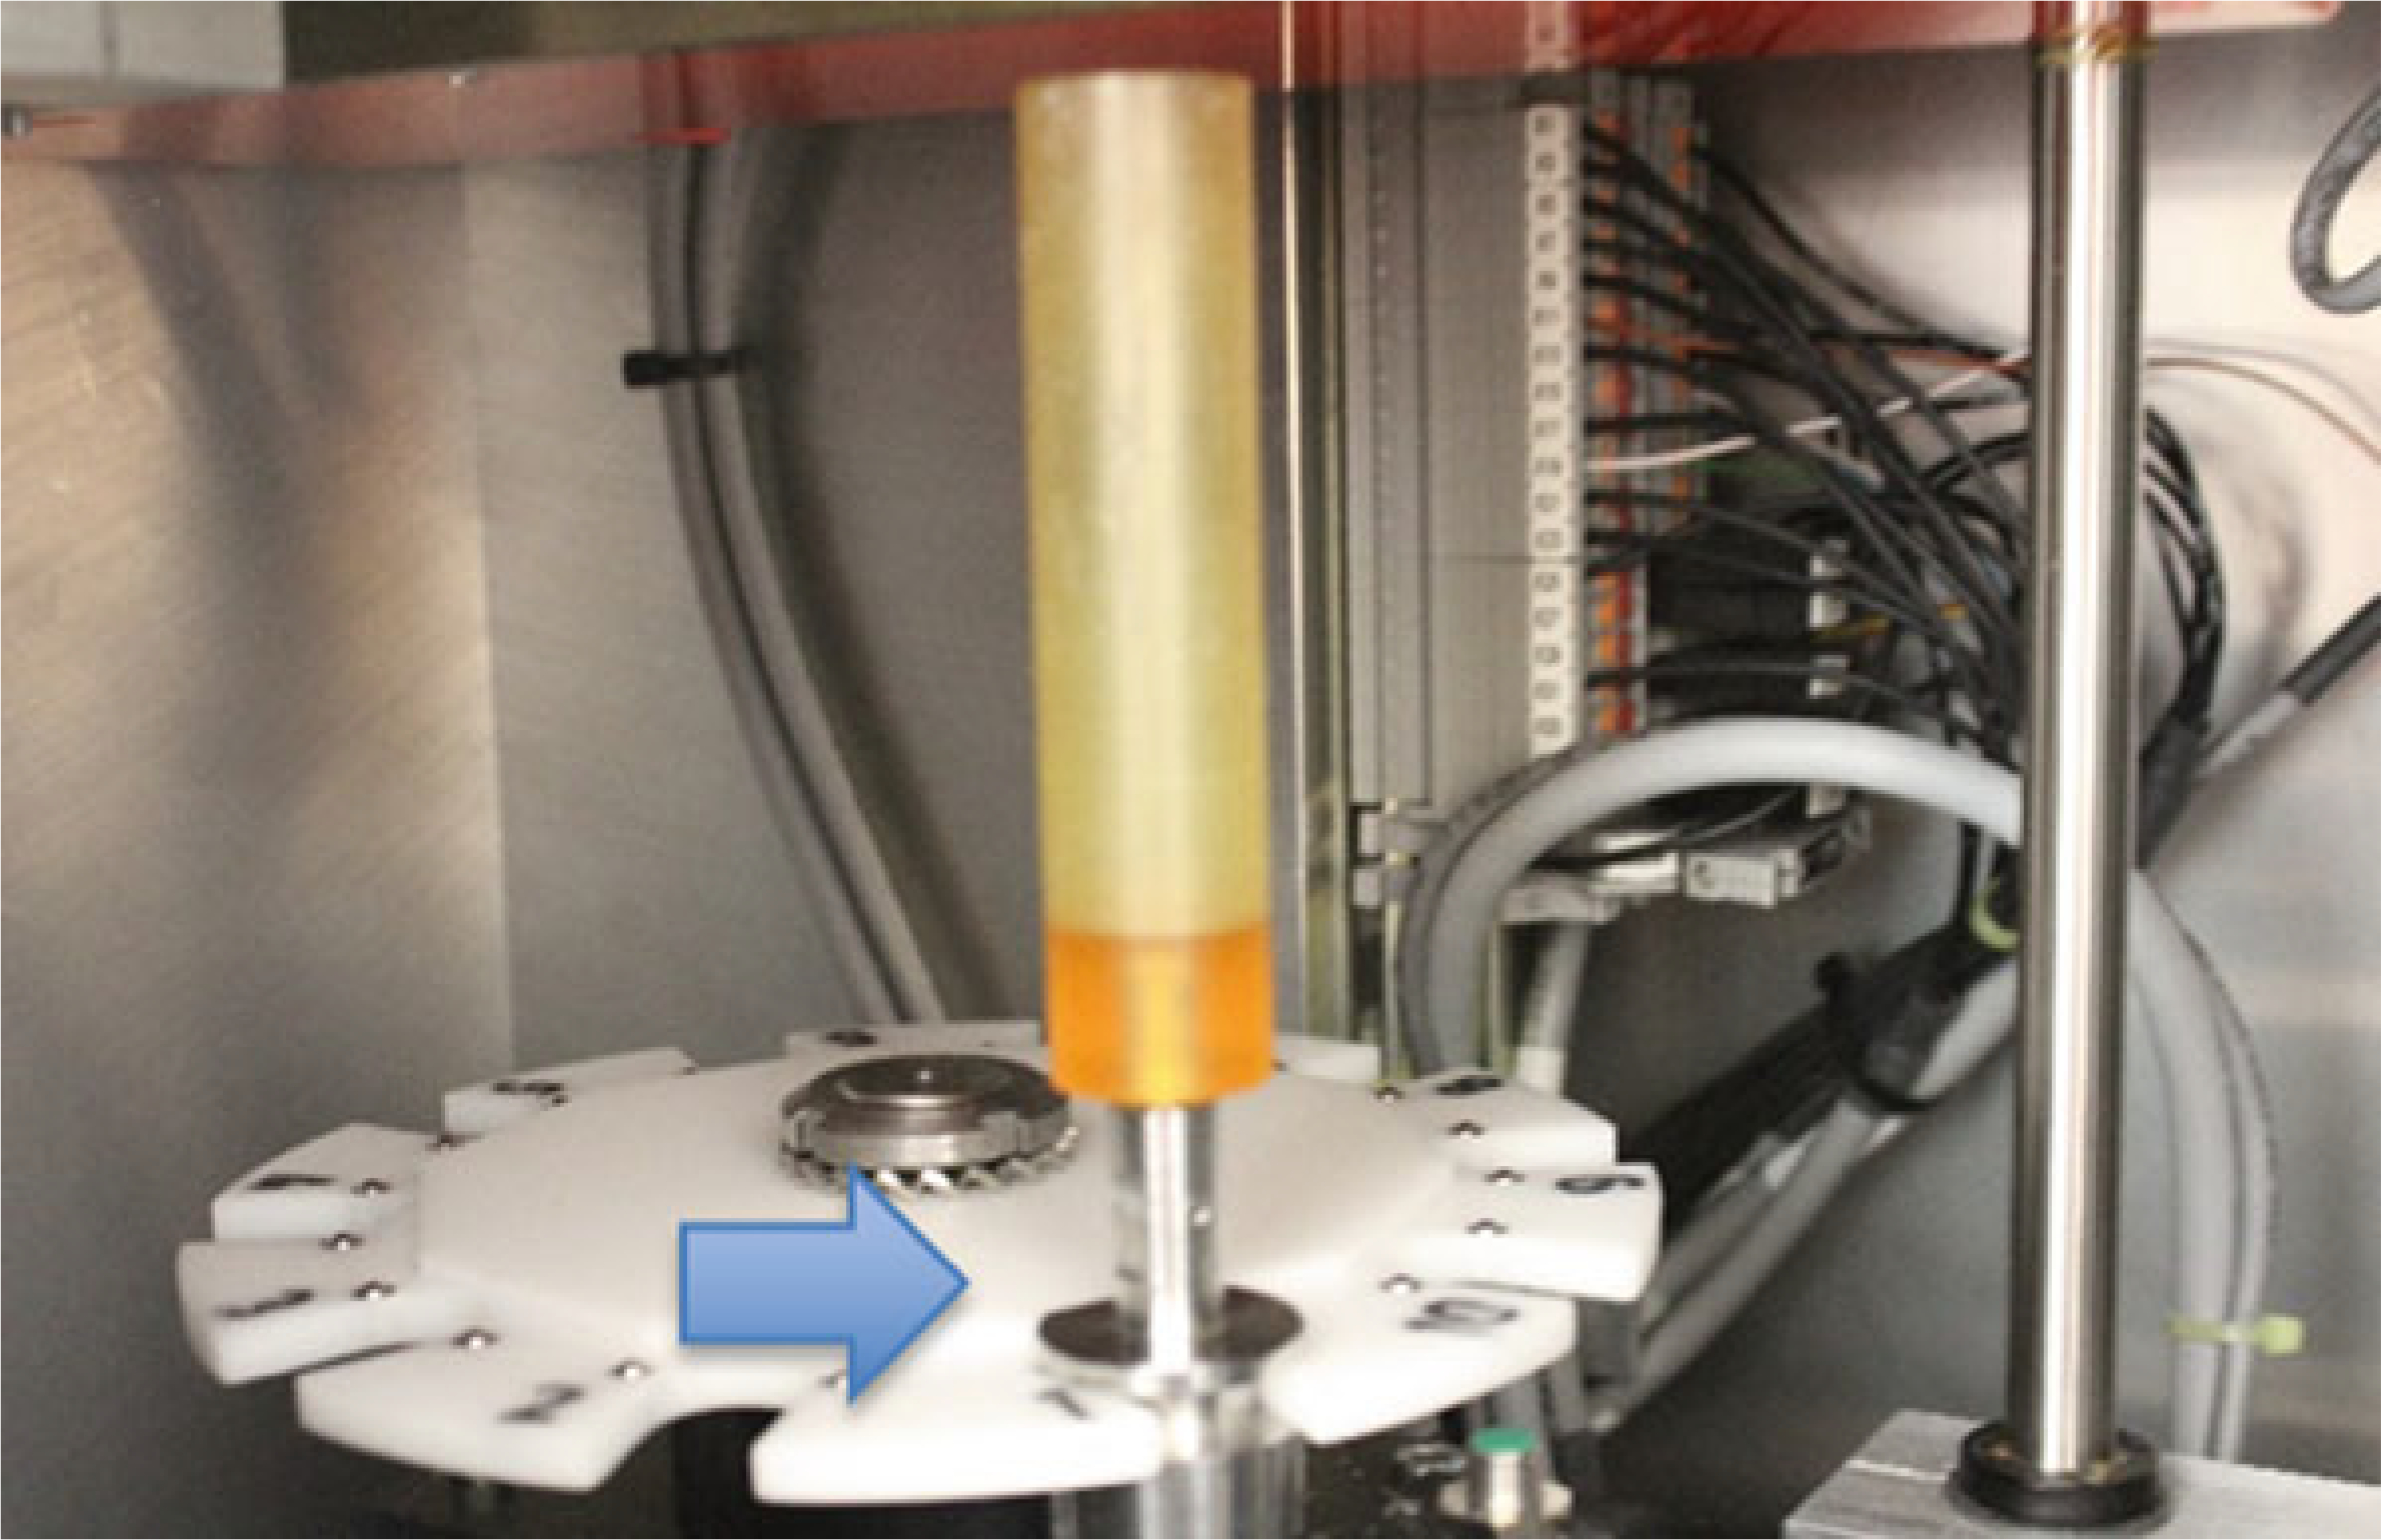
Placing the sample holder in the scanner. Here the holder is in position 1 of the sample changer (carousel). This changer can hold up to 10 sample tubes
Fig. 11.
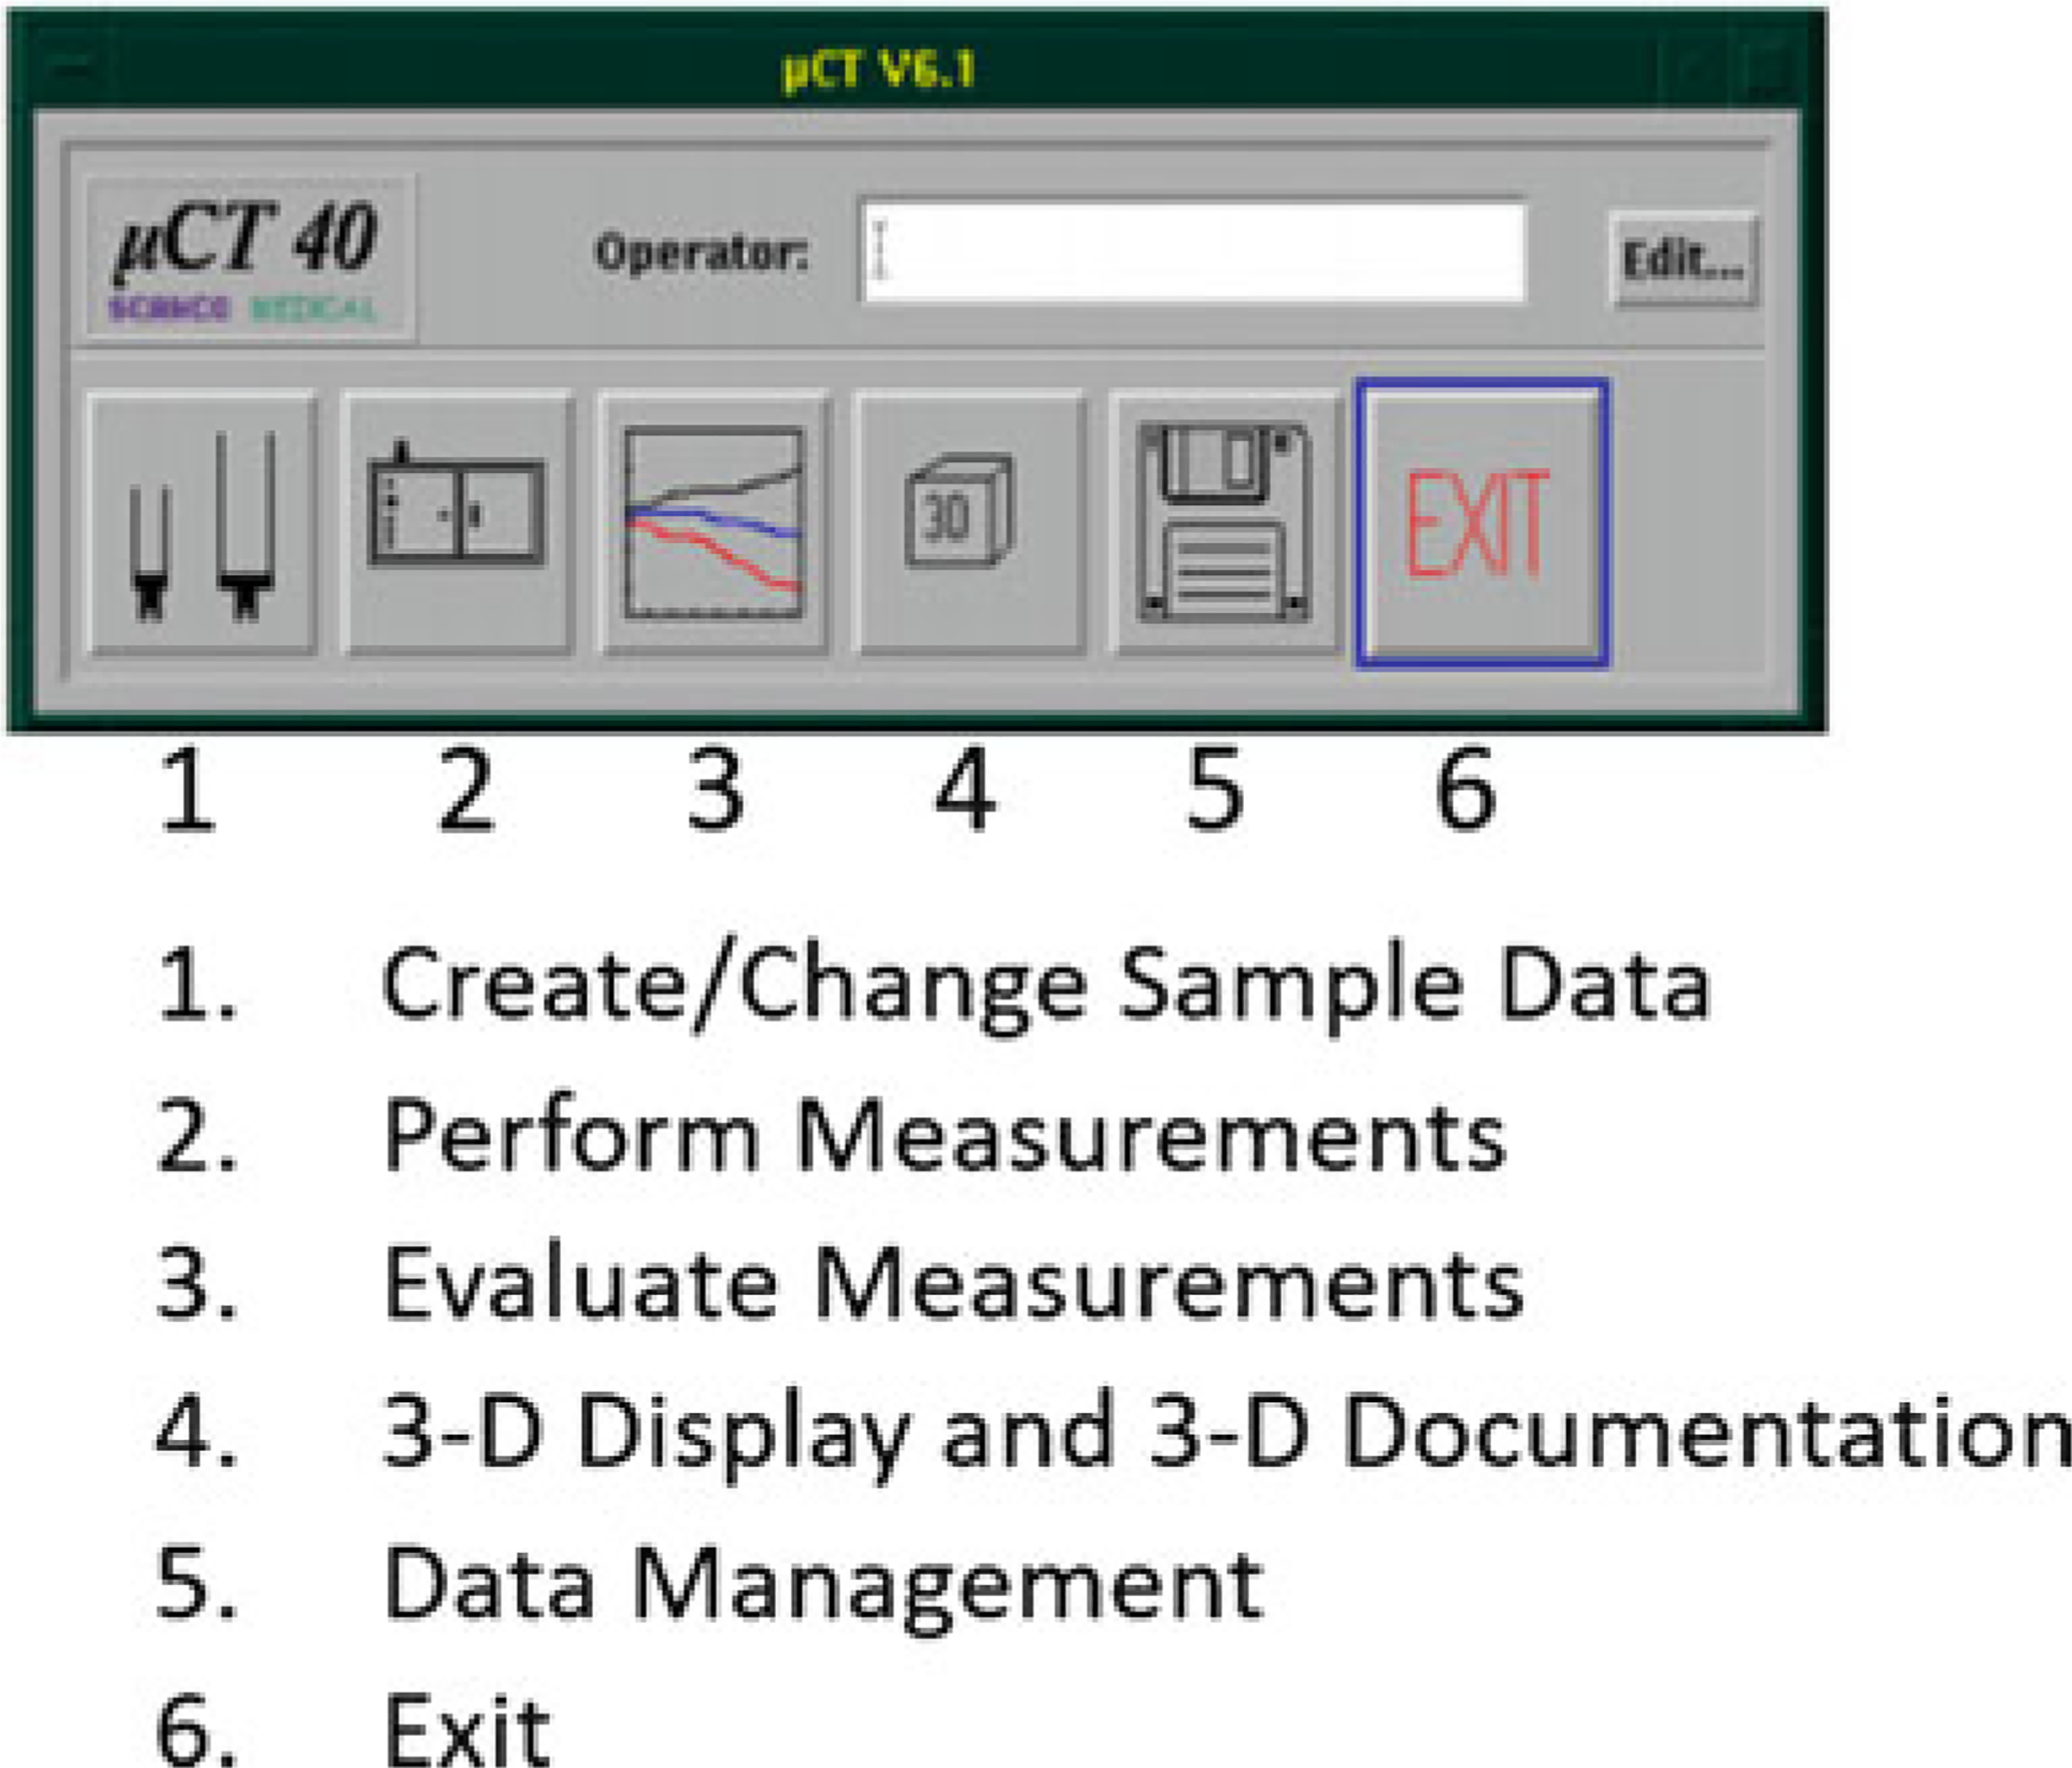
Scanco software main menu
Fig. 12.
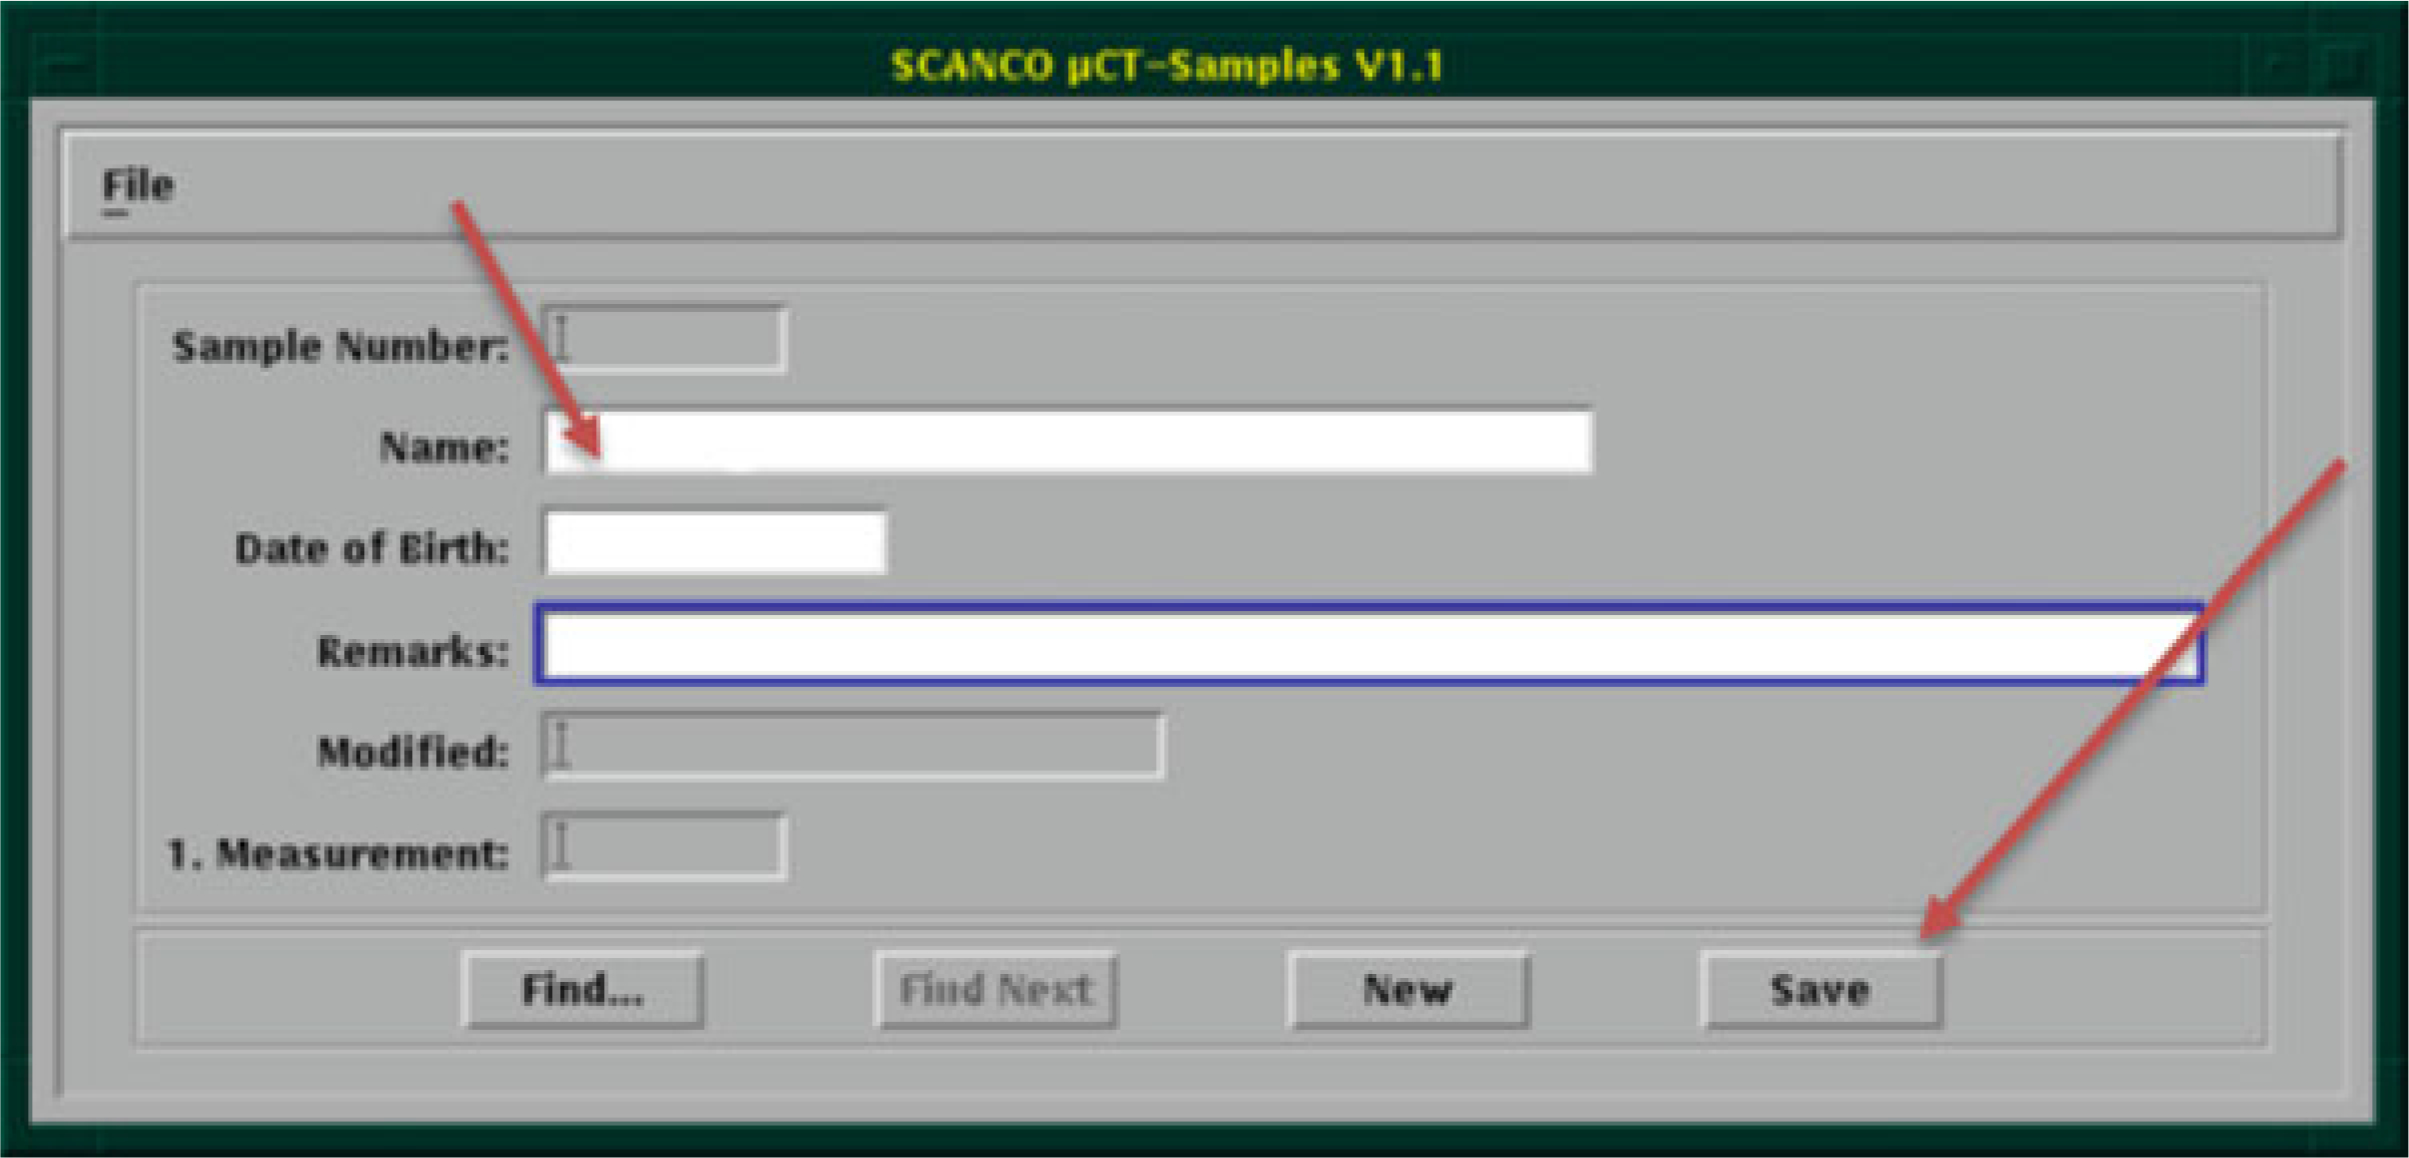
Create new sample number with descriptive name (see Note 9)
Fig. 13.
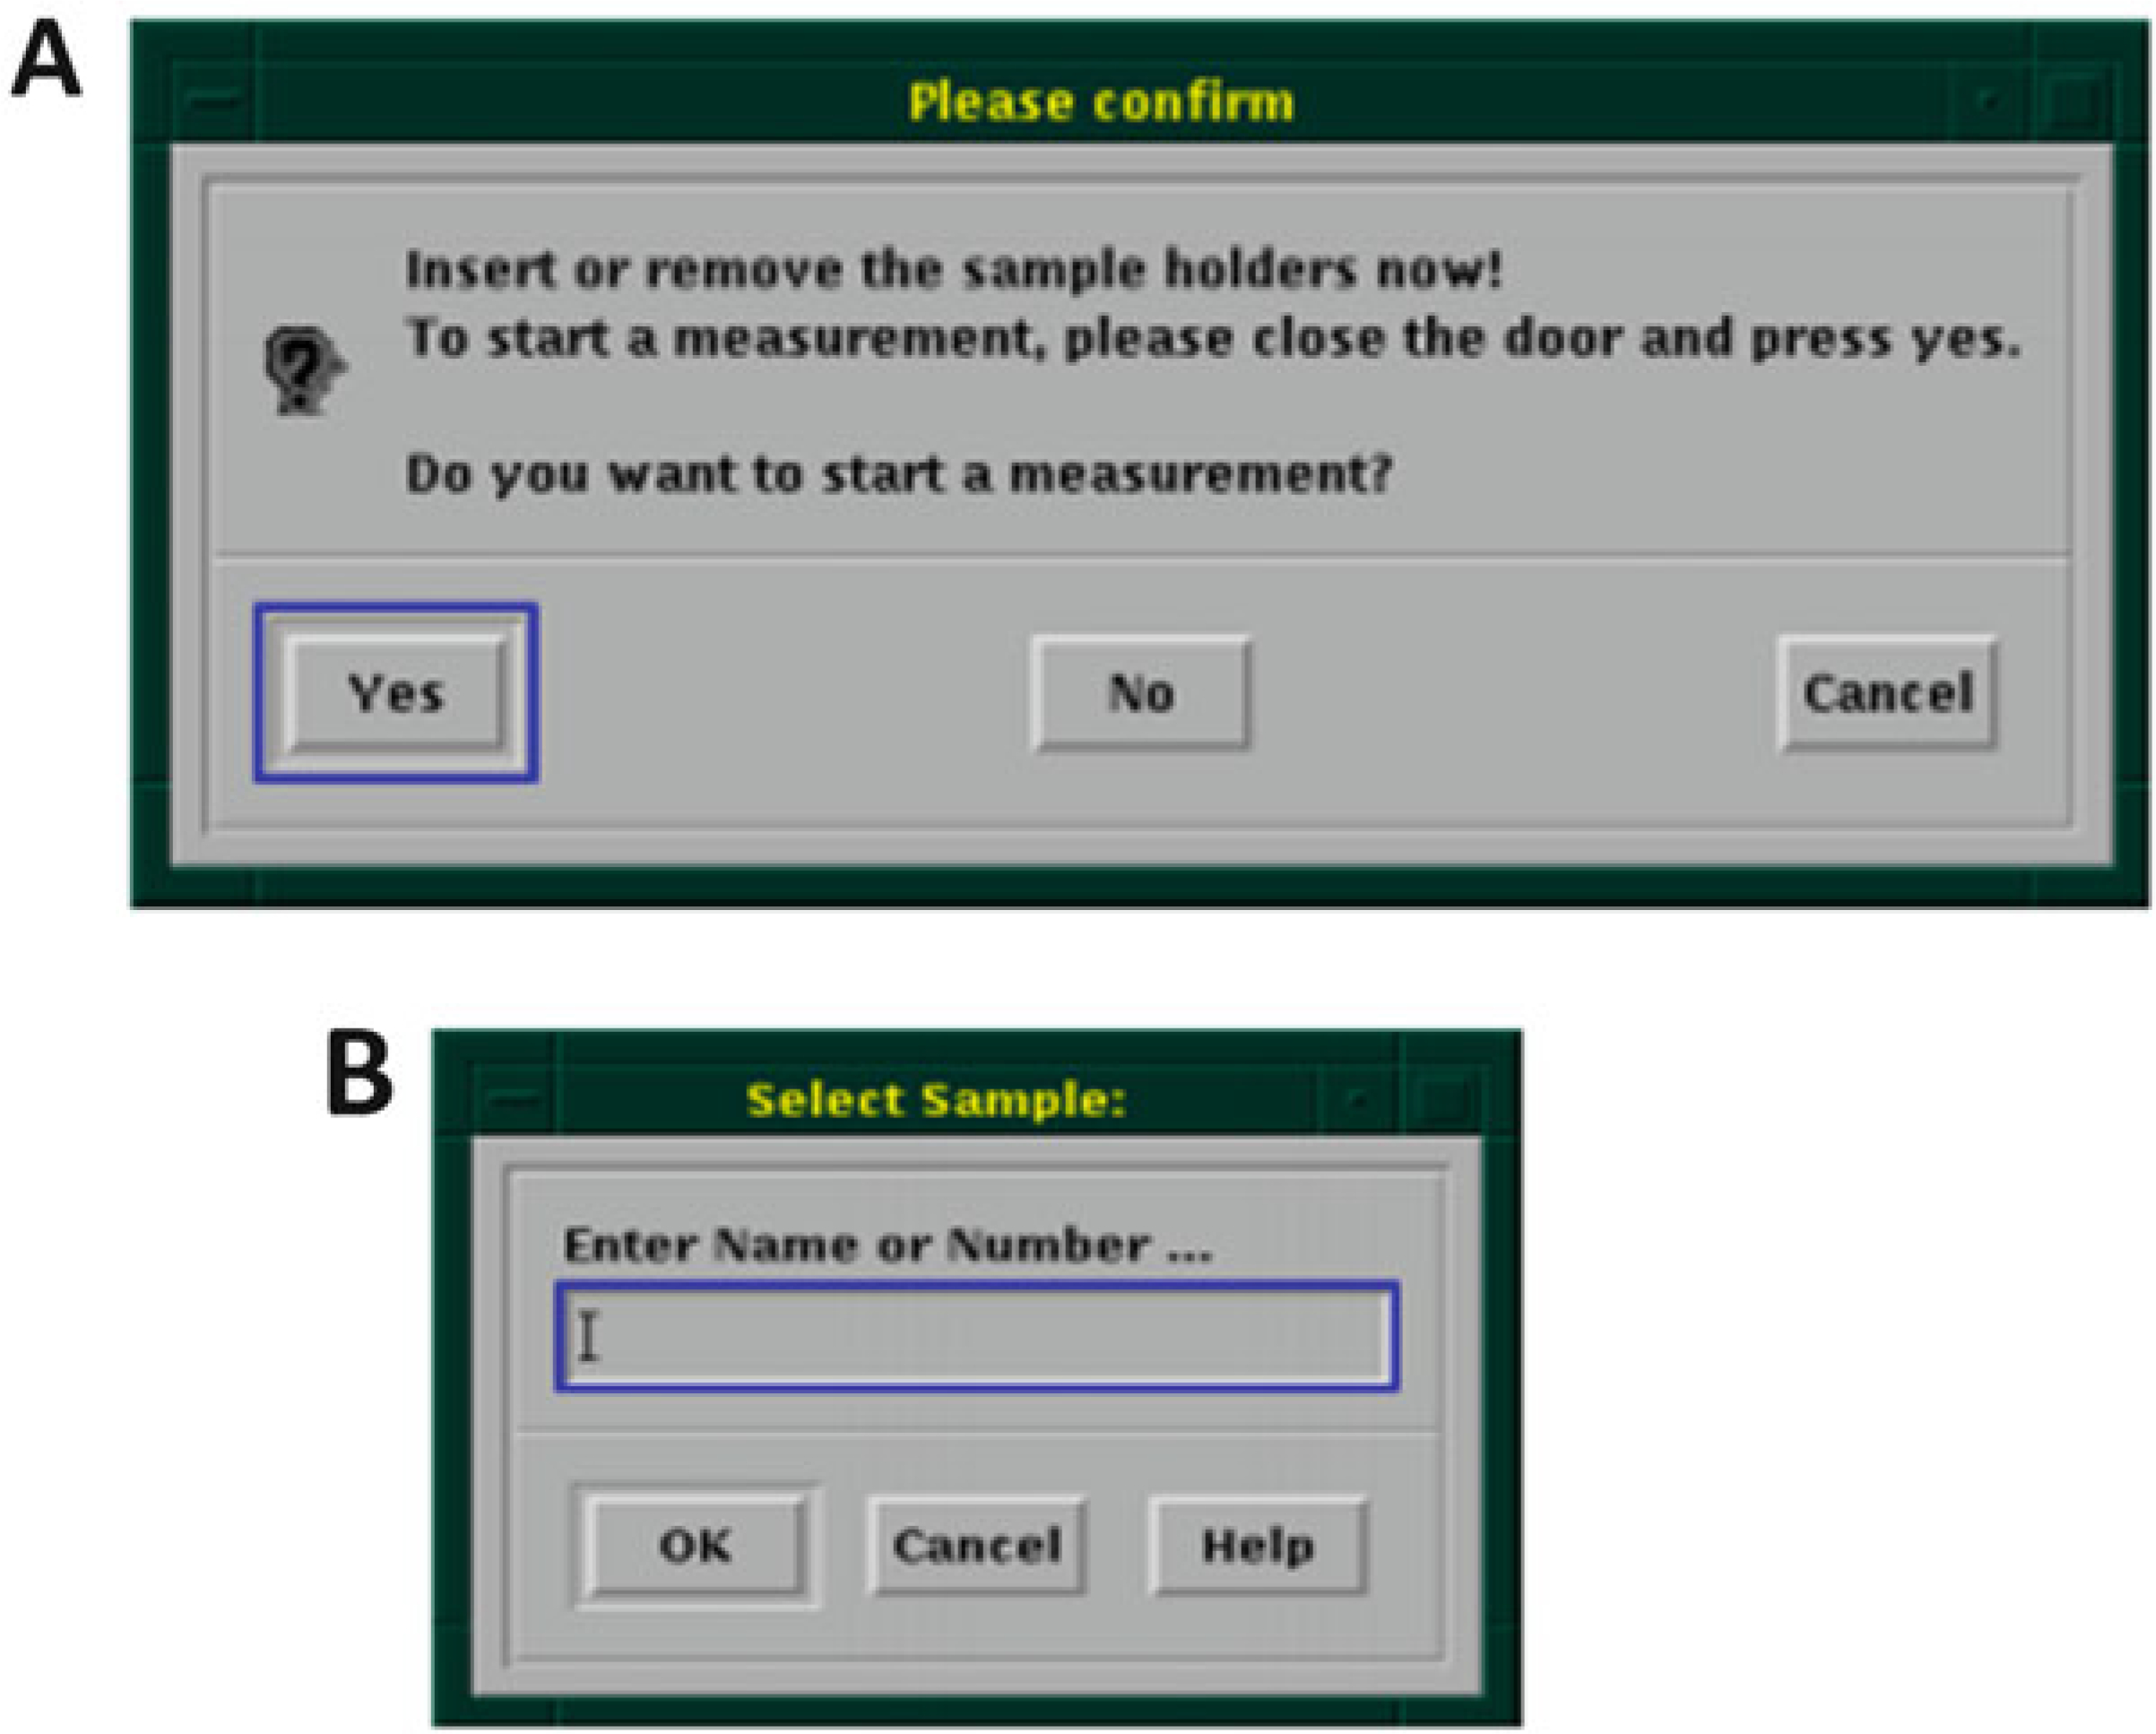
(a) Start a new measurement. (b) Enter sample number created in previous step
Fig. 14.

Carousel Position. Example shows holders in positions 5 and 7 (green)
Fig. 15.
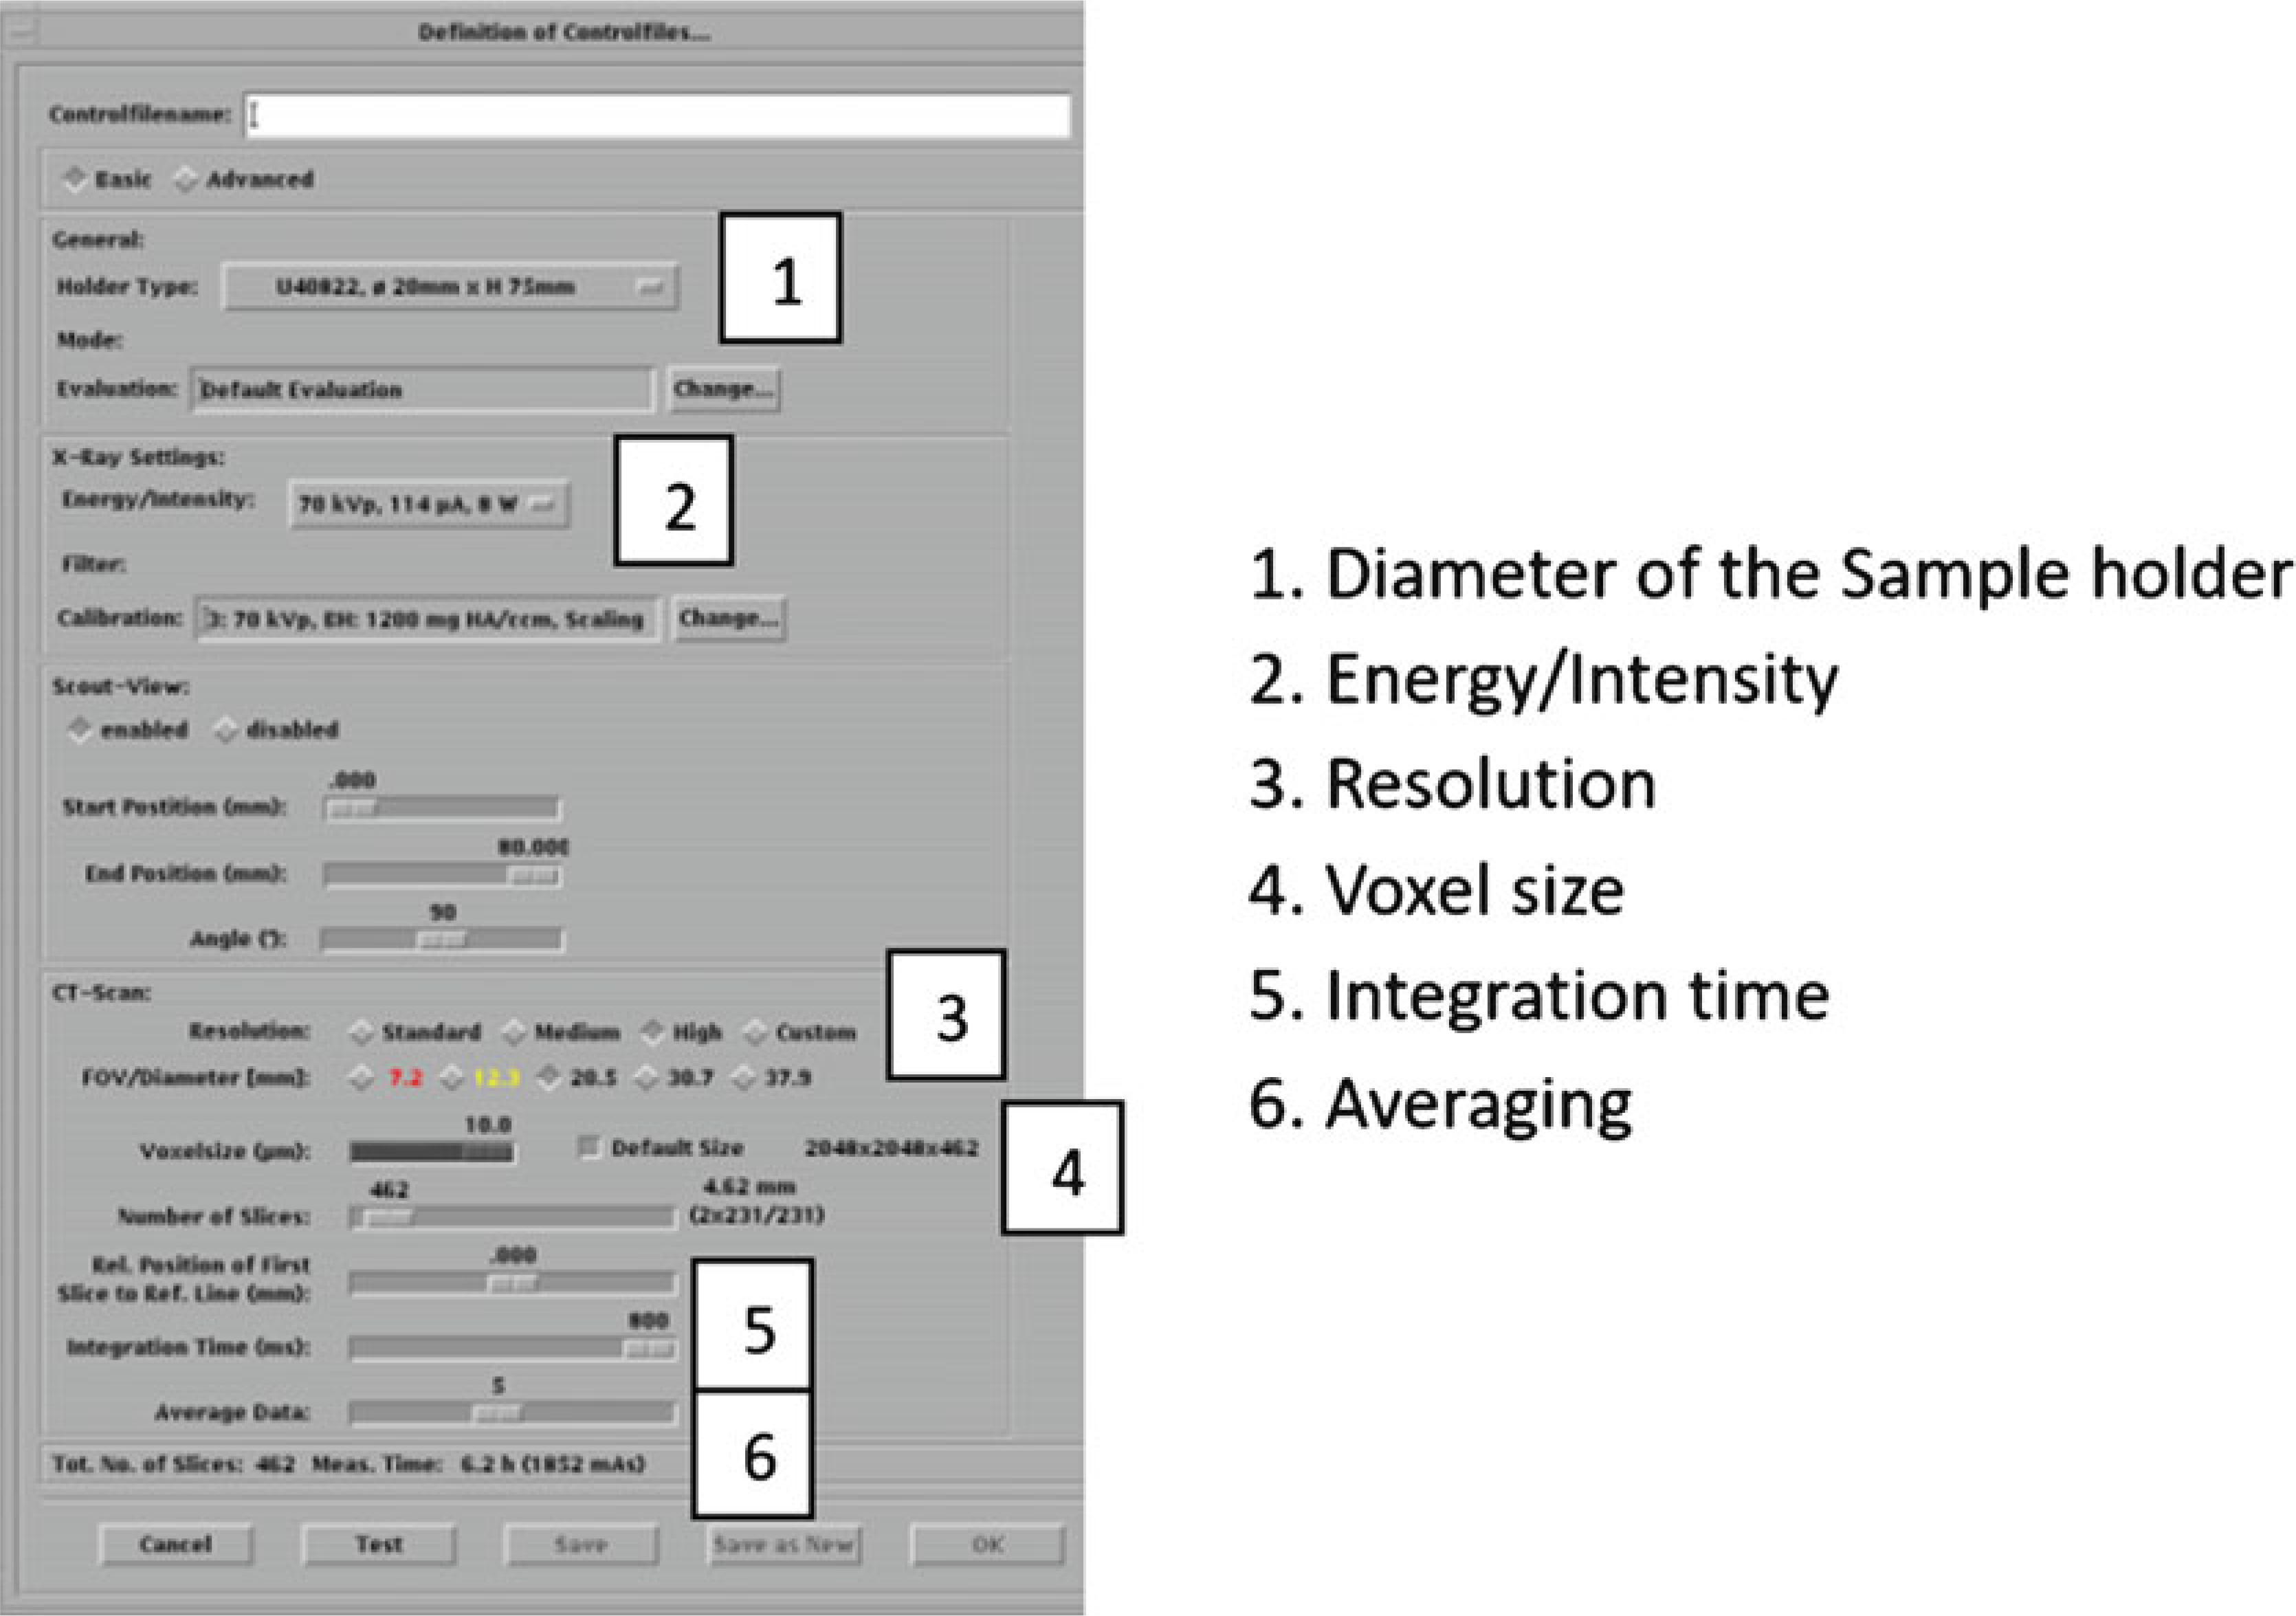
Controlfile settings
Fig. 16.

(a) Measurement main window; selecting Scout View. (b) Scout-View window. (c) Scout-view of a bone biopsy with reference line (green) selections (Scanco Medical)
Fig. 17.
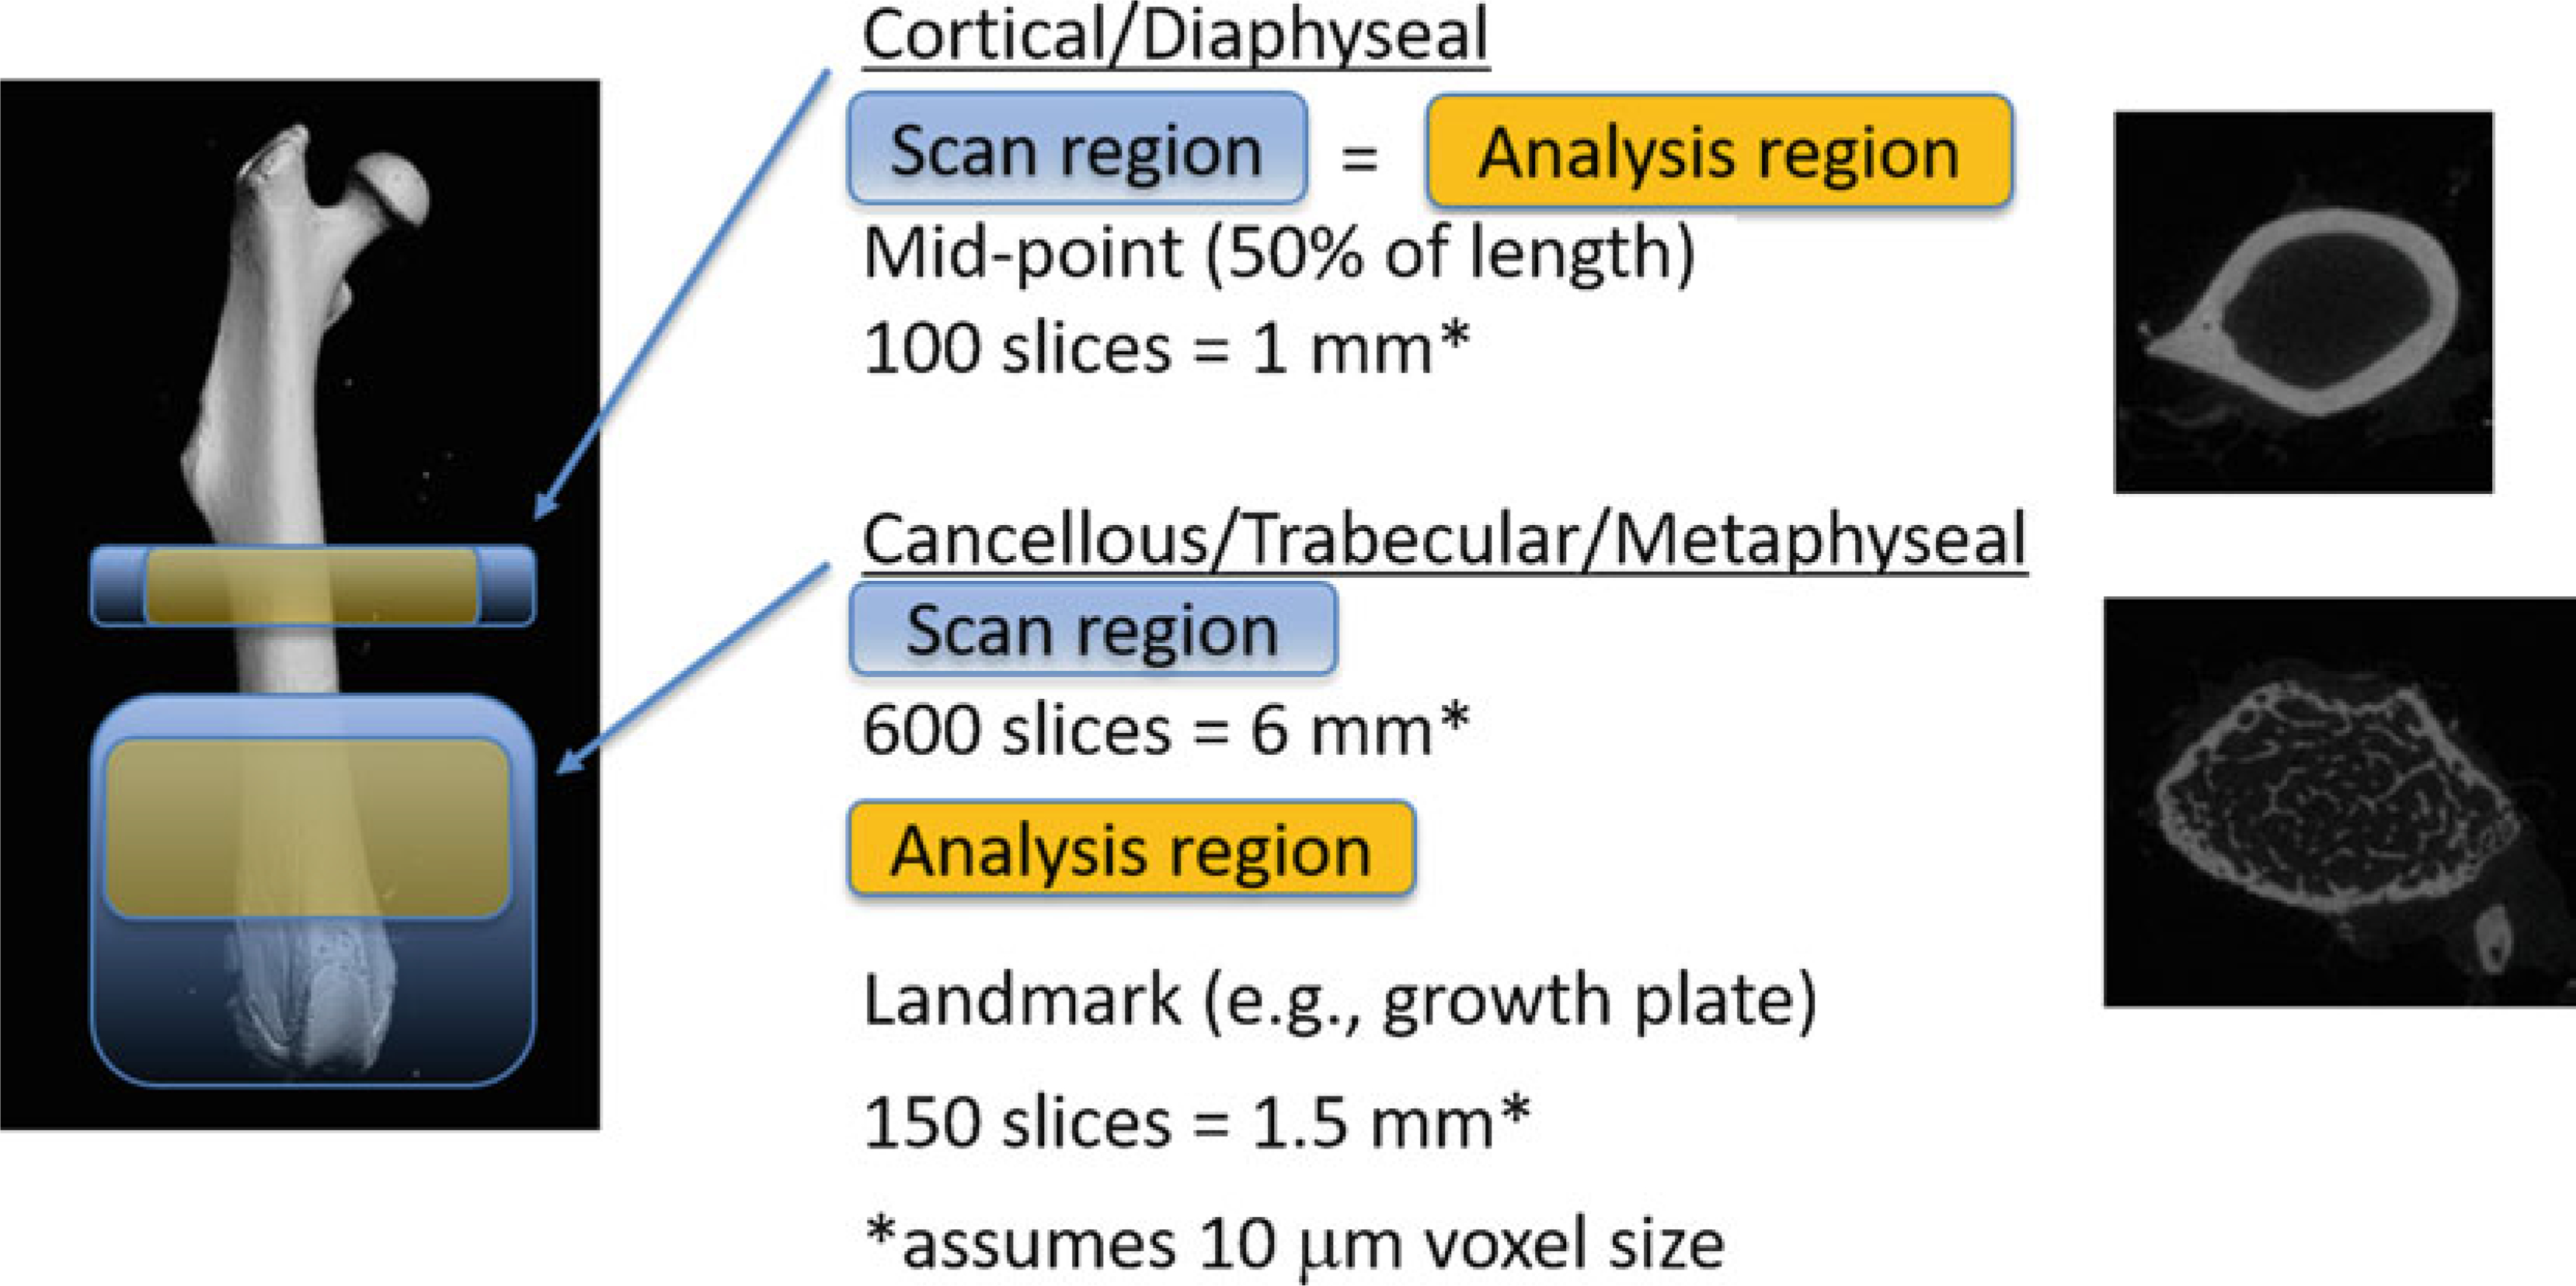
Scan and Analysis Regions for Cortical and Cancellous/Trabecular regions
3.3. Image Analysis and Evaluation
Start the evaluation program (Fig. 11, #3). Enter or select the sample number and choose the measurement from the list. Measurement numbers are assigned by the system during reconstruction. The images are loaded and you can check them in the Evaluation window (Fig. 18).
If there is more than one bone in the scan, go to the “Zoom” menu and select magnification to zoom in on the bone to be analyzed (Fig. 19).
To contour the bones (Fig. 20), delineate the region of interest by manual or automatic methods. For cortical bone perform Subheading 3.3, steps 4–8, and for trabecular bone perform Subheading 3.3, steps 9–16.
Draw manual contours on the first and last slices of the cortical analysis region (Figs. 17 and 21) by first zooming in on the region of interest and clicking “Draw Contour” (Fig. 21, #1).
Draw contour around the outside of the cortical bone (counter-clockwise) for first and last slices (Fig. 21, #2).
Select the first/starting slice and click on the “C...” (Fig. 22, #1).
Choose “Forwards” in the Selection column (Fig. 22, #2).
Click on the “Iterate forwards” (Fig. 22, #3). Once the automatic contours have been drawn, scroll through the slices to check for accuracy. Then go to Subheading 3.3, step 17.
For trabecular bone contouring (see Note 18), begin manual contour starting at the first slice.
Zoom in on the region of interest and click on “Draw Contour” (Fig. 21, #1).
Draw contour around medullary area (just inside of cortical bone, counterclockwise).
Repeat steps 10 and 11 for every tenth slice of the trabecular analysis region (Fig. 17).
We will now use the Morph automatic contour function.
Select the first slice and click on the “C...”.
Choose “all” in the Selection column (Fig. 23, #1).
Click on “Morph” (Fig. 23, #2). Once the automatic contours have been drawn, scroll through the slices to check for accuracy. Proceed to Subheading 3.3, step 17.
Evaluation of the data requires segmentation (see Note 19), which involves applying filters to the image data (see Note 20) and selecting a threshold (see Note 21). Begin this process by selecting 3D Evaluation “T...” (Fig. 18, bottom left) in the Evaluation window.
In the 3D Evaluation window click on “Select” (Fig. 24, #1) and choose the proper Task (Script). Choose the default cortical or trabecular analysis script created by Scanco during your system set-up. (On our system, these are named “Bone midshaft more than e.g. 50 slices Evaluation” for cortical bone analysis, and “Bone Trab. Morphometry” for trabecular bone analysis.)
Adjust the sliders to select values for “Gauss Sigma” and “Gauss Support” (Fig. 24, #2). We recommend starting with the combination of Sigma = 0, Support = 0 (see Note 20).
Adjust the sliders to select a “Lower Threshold” and “Upper Threshold” values (Fig. 24, #3). For cortical bone, a lower threshold value of approximately 300 (per 1000) may be appropriate. For trabecular bone, a lower threshold of approximately 220 (per 1000) may be appropriate. The values need to be confirmed by user inspection. Typically, the lower threshold value is chosen iteratively by comparing grayscale vs. segmented images and adjusting the threshold value until the two images match as closely as possible (Fig. 25, see Note 21). To assist with selecting a lower threshold, you may wish to check the histogram for the grayscale image (see Note 22). Generally, you will not adjust the Upper Threshold value; it should be set to maximum value (1000).
Click on the “Start Evaluation” (Fig. 24, #4) and “Yes” to save contours. You must wait until evaluation is completed before collecting data or doing any additional analyses (e.g., a second bone in the same measurement). If you attempt concurrent evaluations, the results will be meaningless. Novice users should collect the data (Subheading 3.3, step 22) before doing additional analyses.
To acquire quantitative data (see Note 23), click on “Applications” in Session Manager window (Fig. 26).
Click on the “DECterm” to open a terminal window and enter “uct_list ‘measurement number’ ” in the terminal window. Results of the bone analysis will be displayed for the current bone and current contours (Fig. 27). You may wish to record the results at this time. Interpretation of the many outcomes generated by the analysis is addressed below (see Notes 24–35).
To observe the image data as a 3D display, first start 3D Display (Fig. 11, #4) and enter “Sample number” and select “measurement number.” The retrieved images should be contoured and evaluated.
Next, click on “Start” in 3D display window (Fig. 29).
The image can now be manipulated via Object Rotation, Elevation of the light source, or Cropping (see Note 36).
To analyze another bone, close the Evaluation window. Open a new Evaluation window and delete previous contour (s) (Fig. 20, #8). Go to Subheading 3.3, step 1 to repeat the steps for a new bone.
Fig. 18.
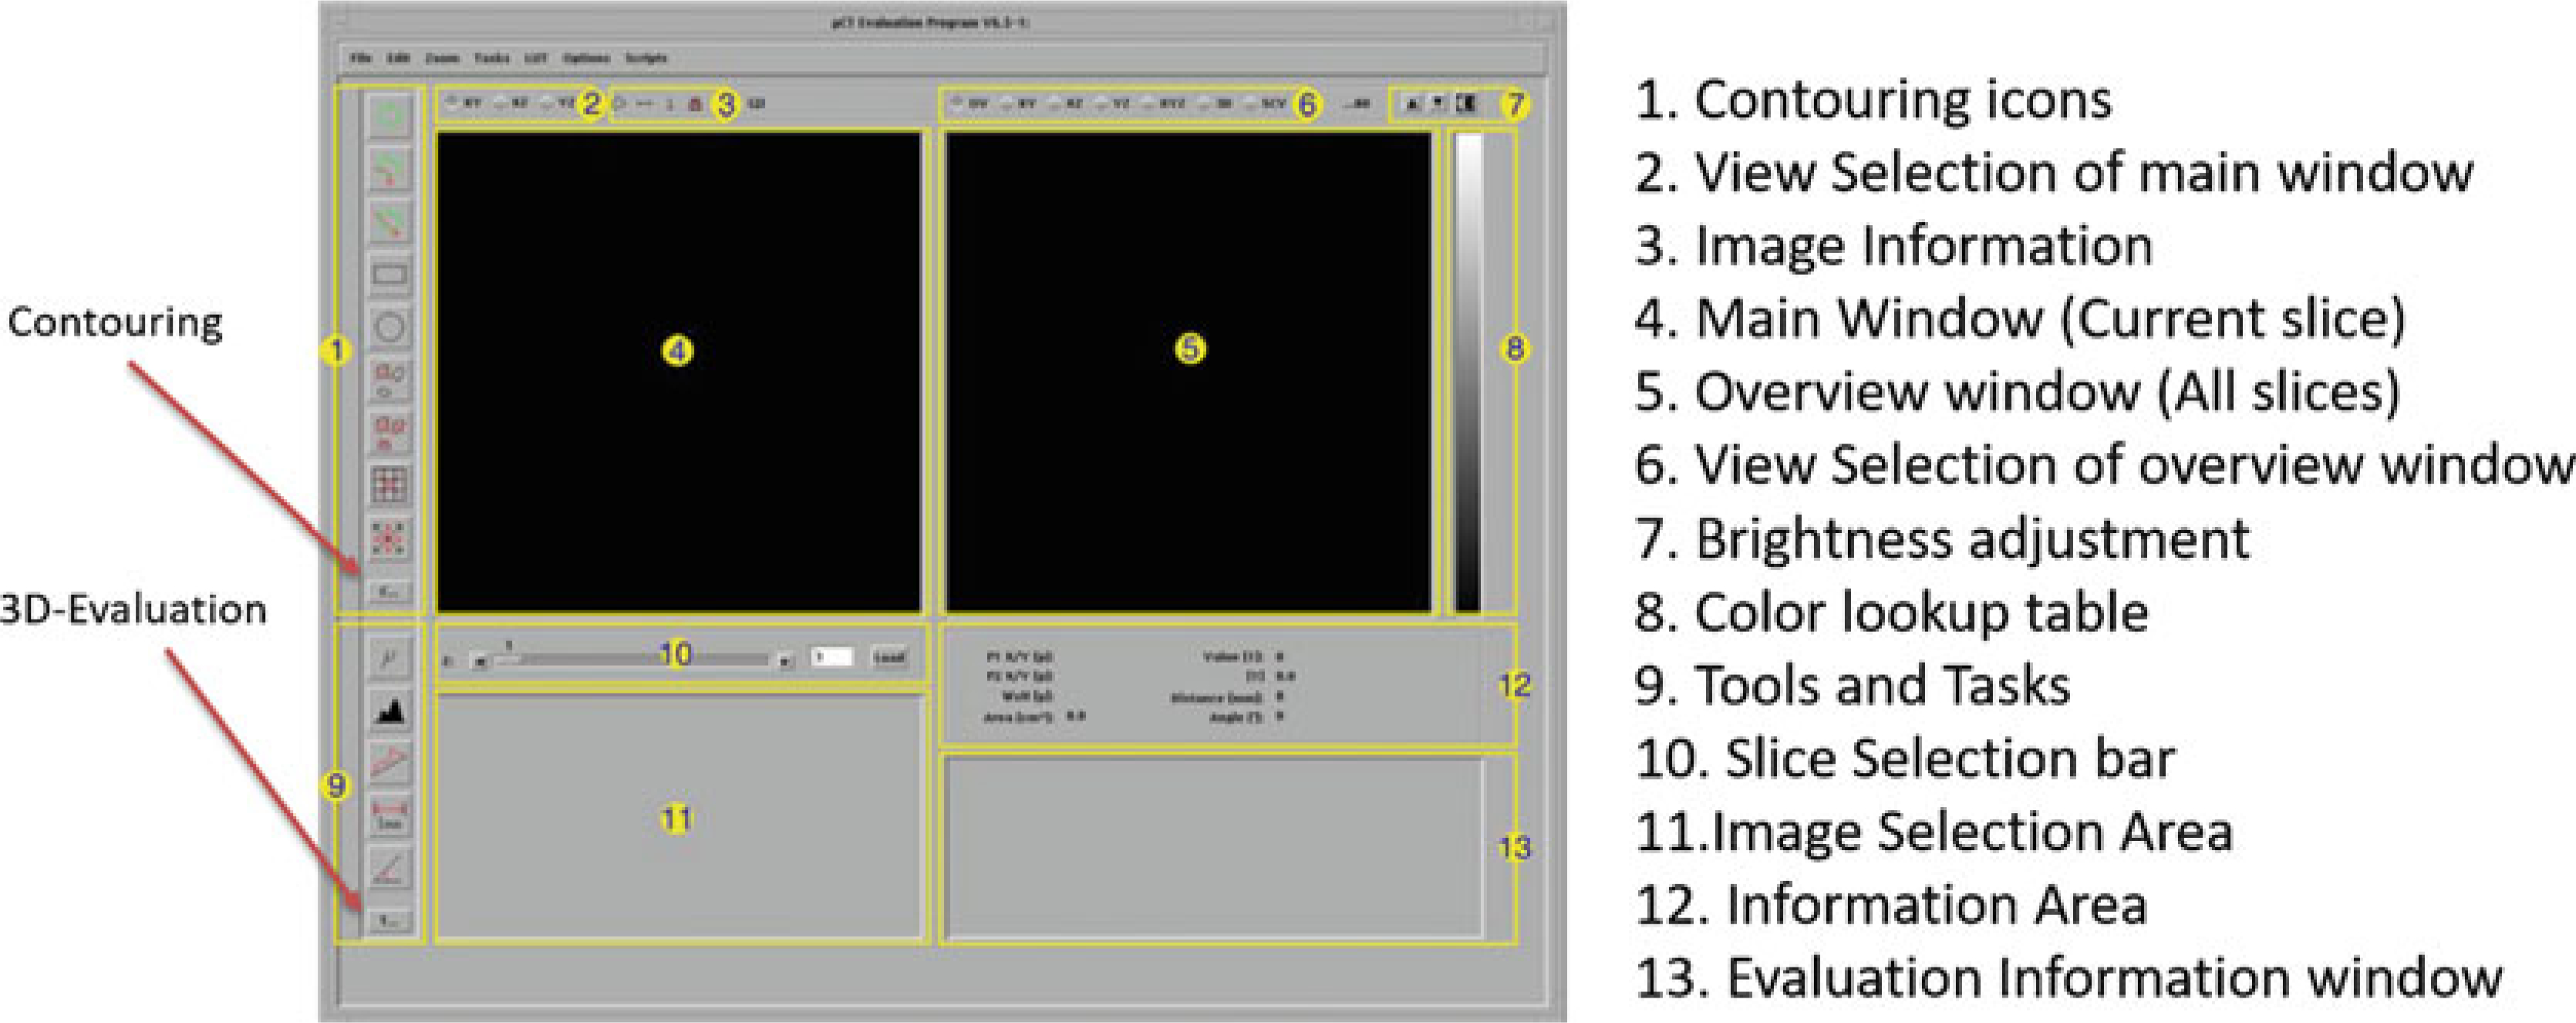
Overview of Evaluation Program (Scanco Medical)
Fig. 19.
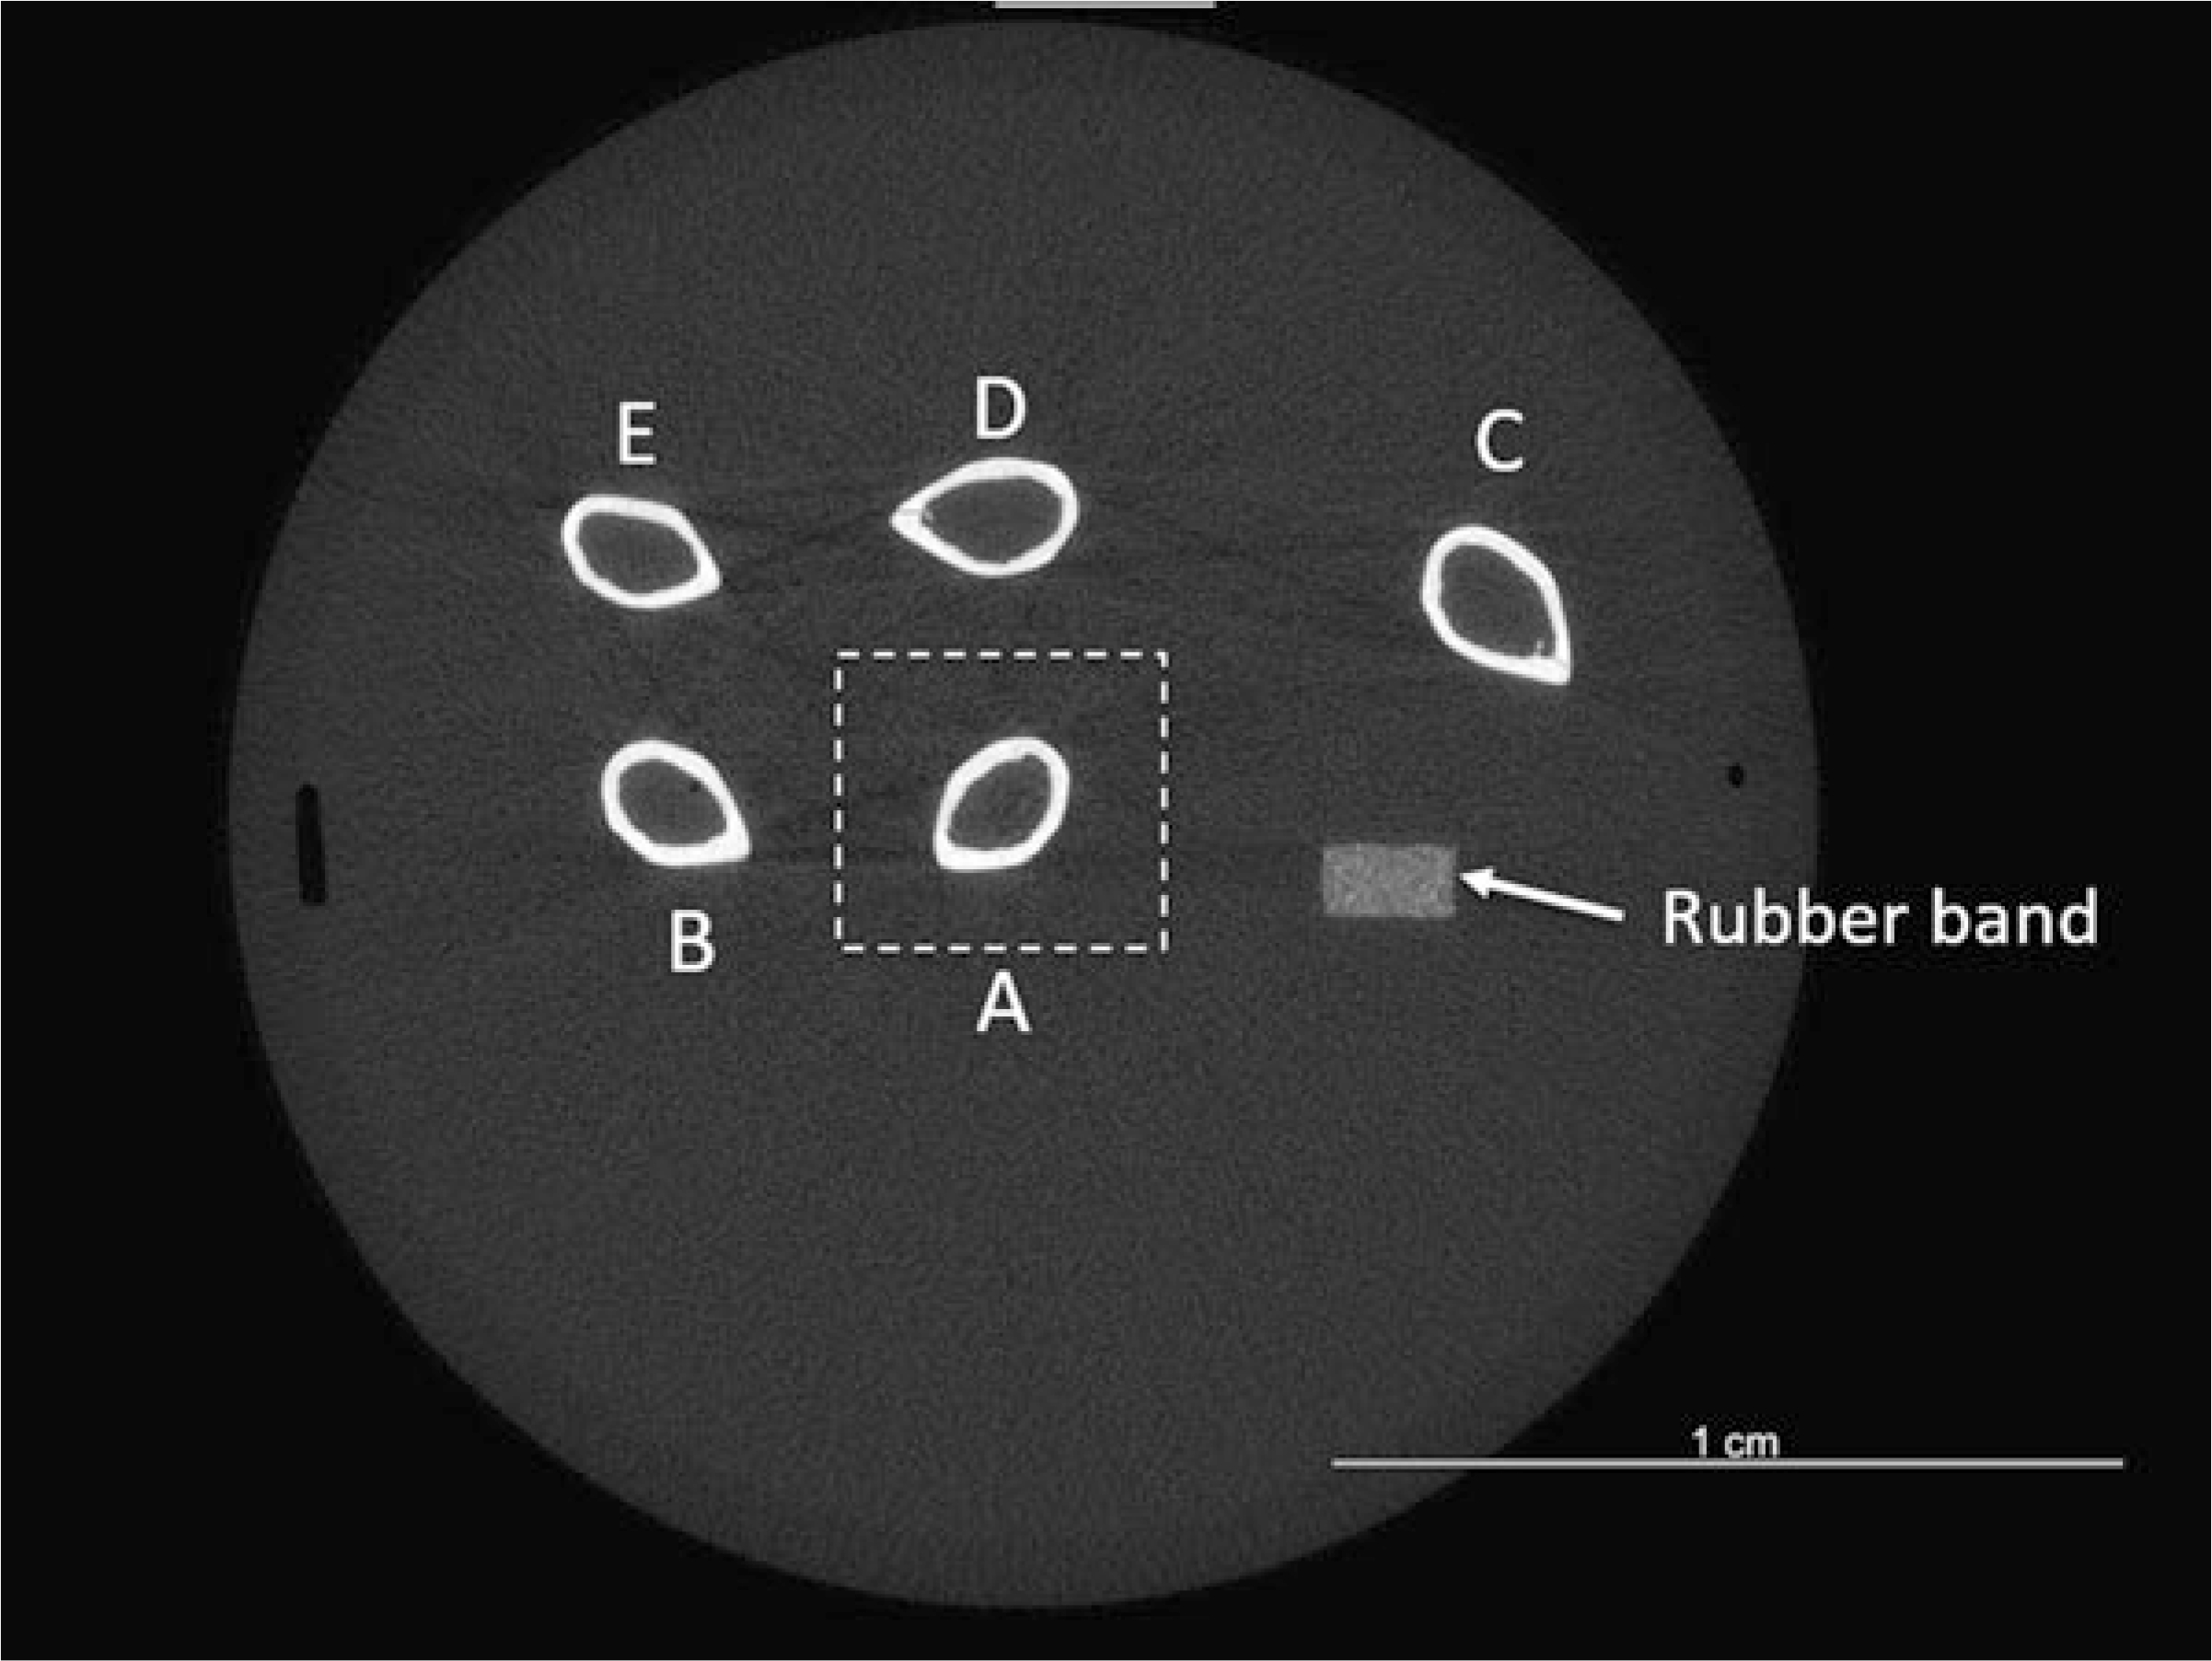
Example CT slice showing mid-diaphyseal cross-sections of five femurs, with rubber band fiducial marker. Orientation of bones relative to rubber band is as shown in Fig. 8. Dashed box illustrates zoom selection of femur A for analysis
Fig. 20.
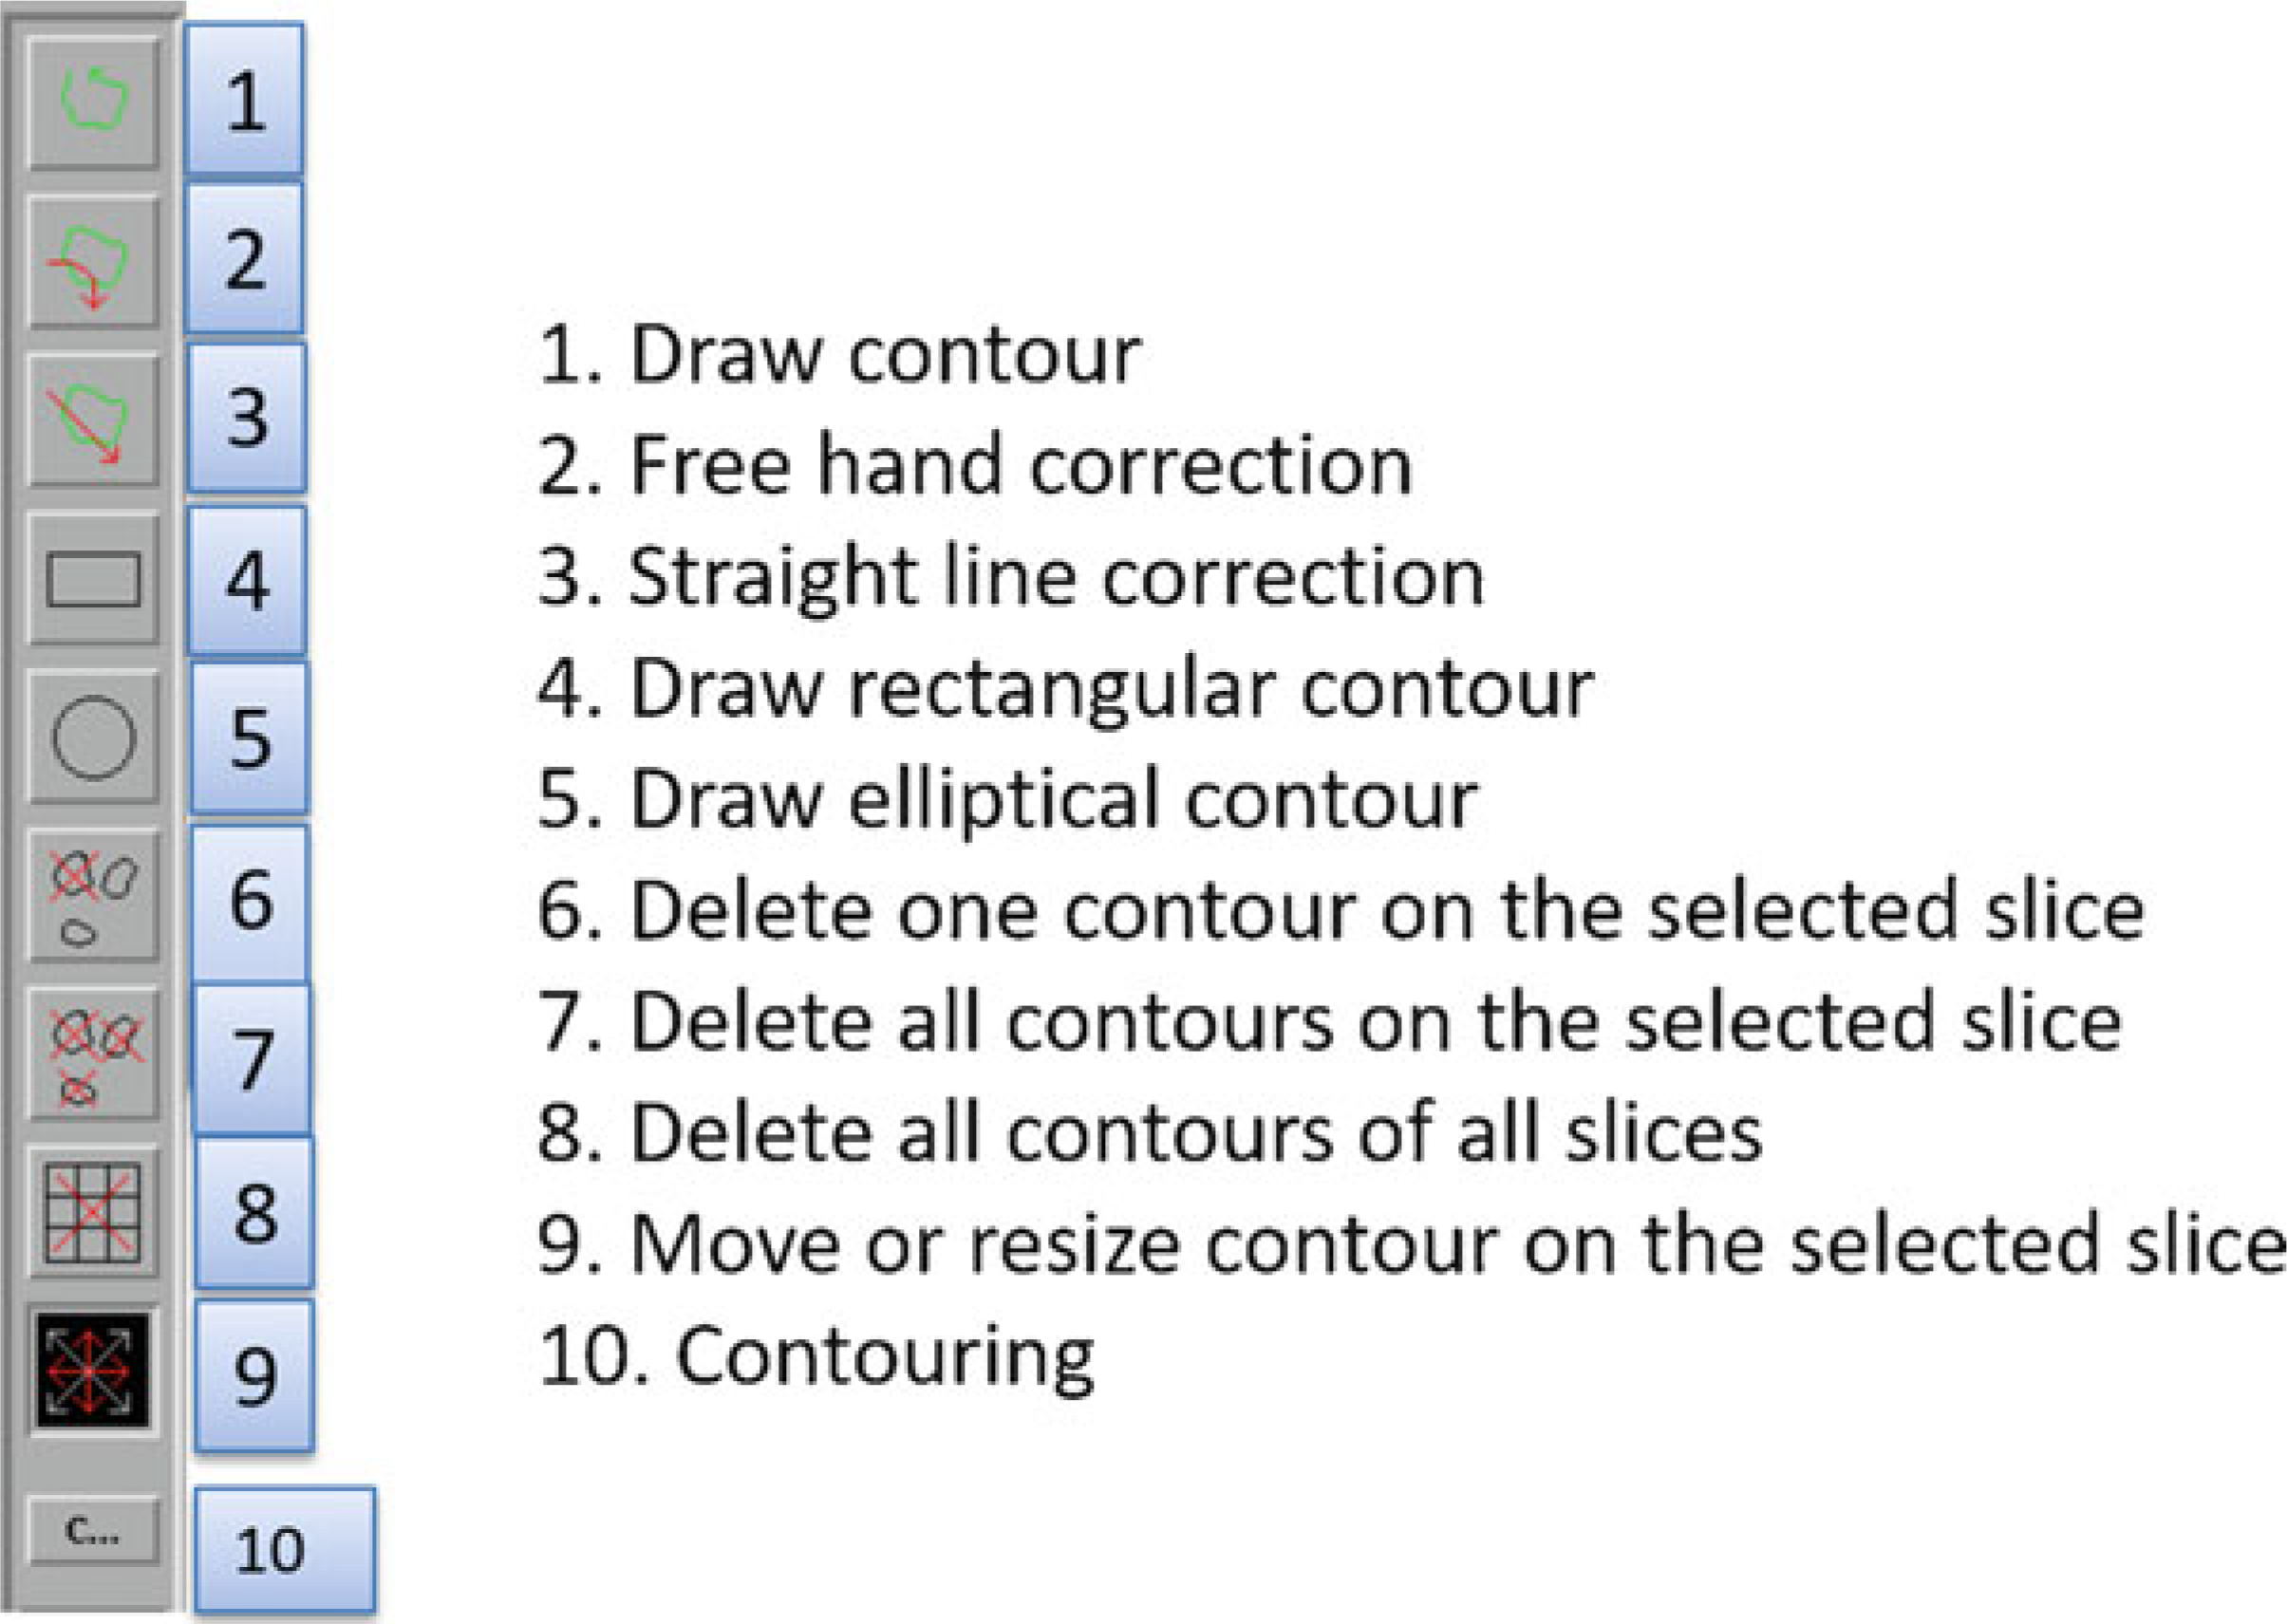
Contouring menu
Fig. 21.
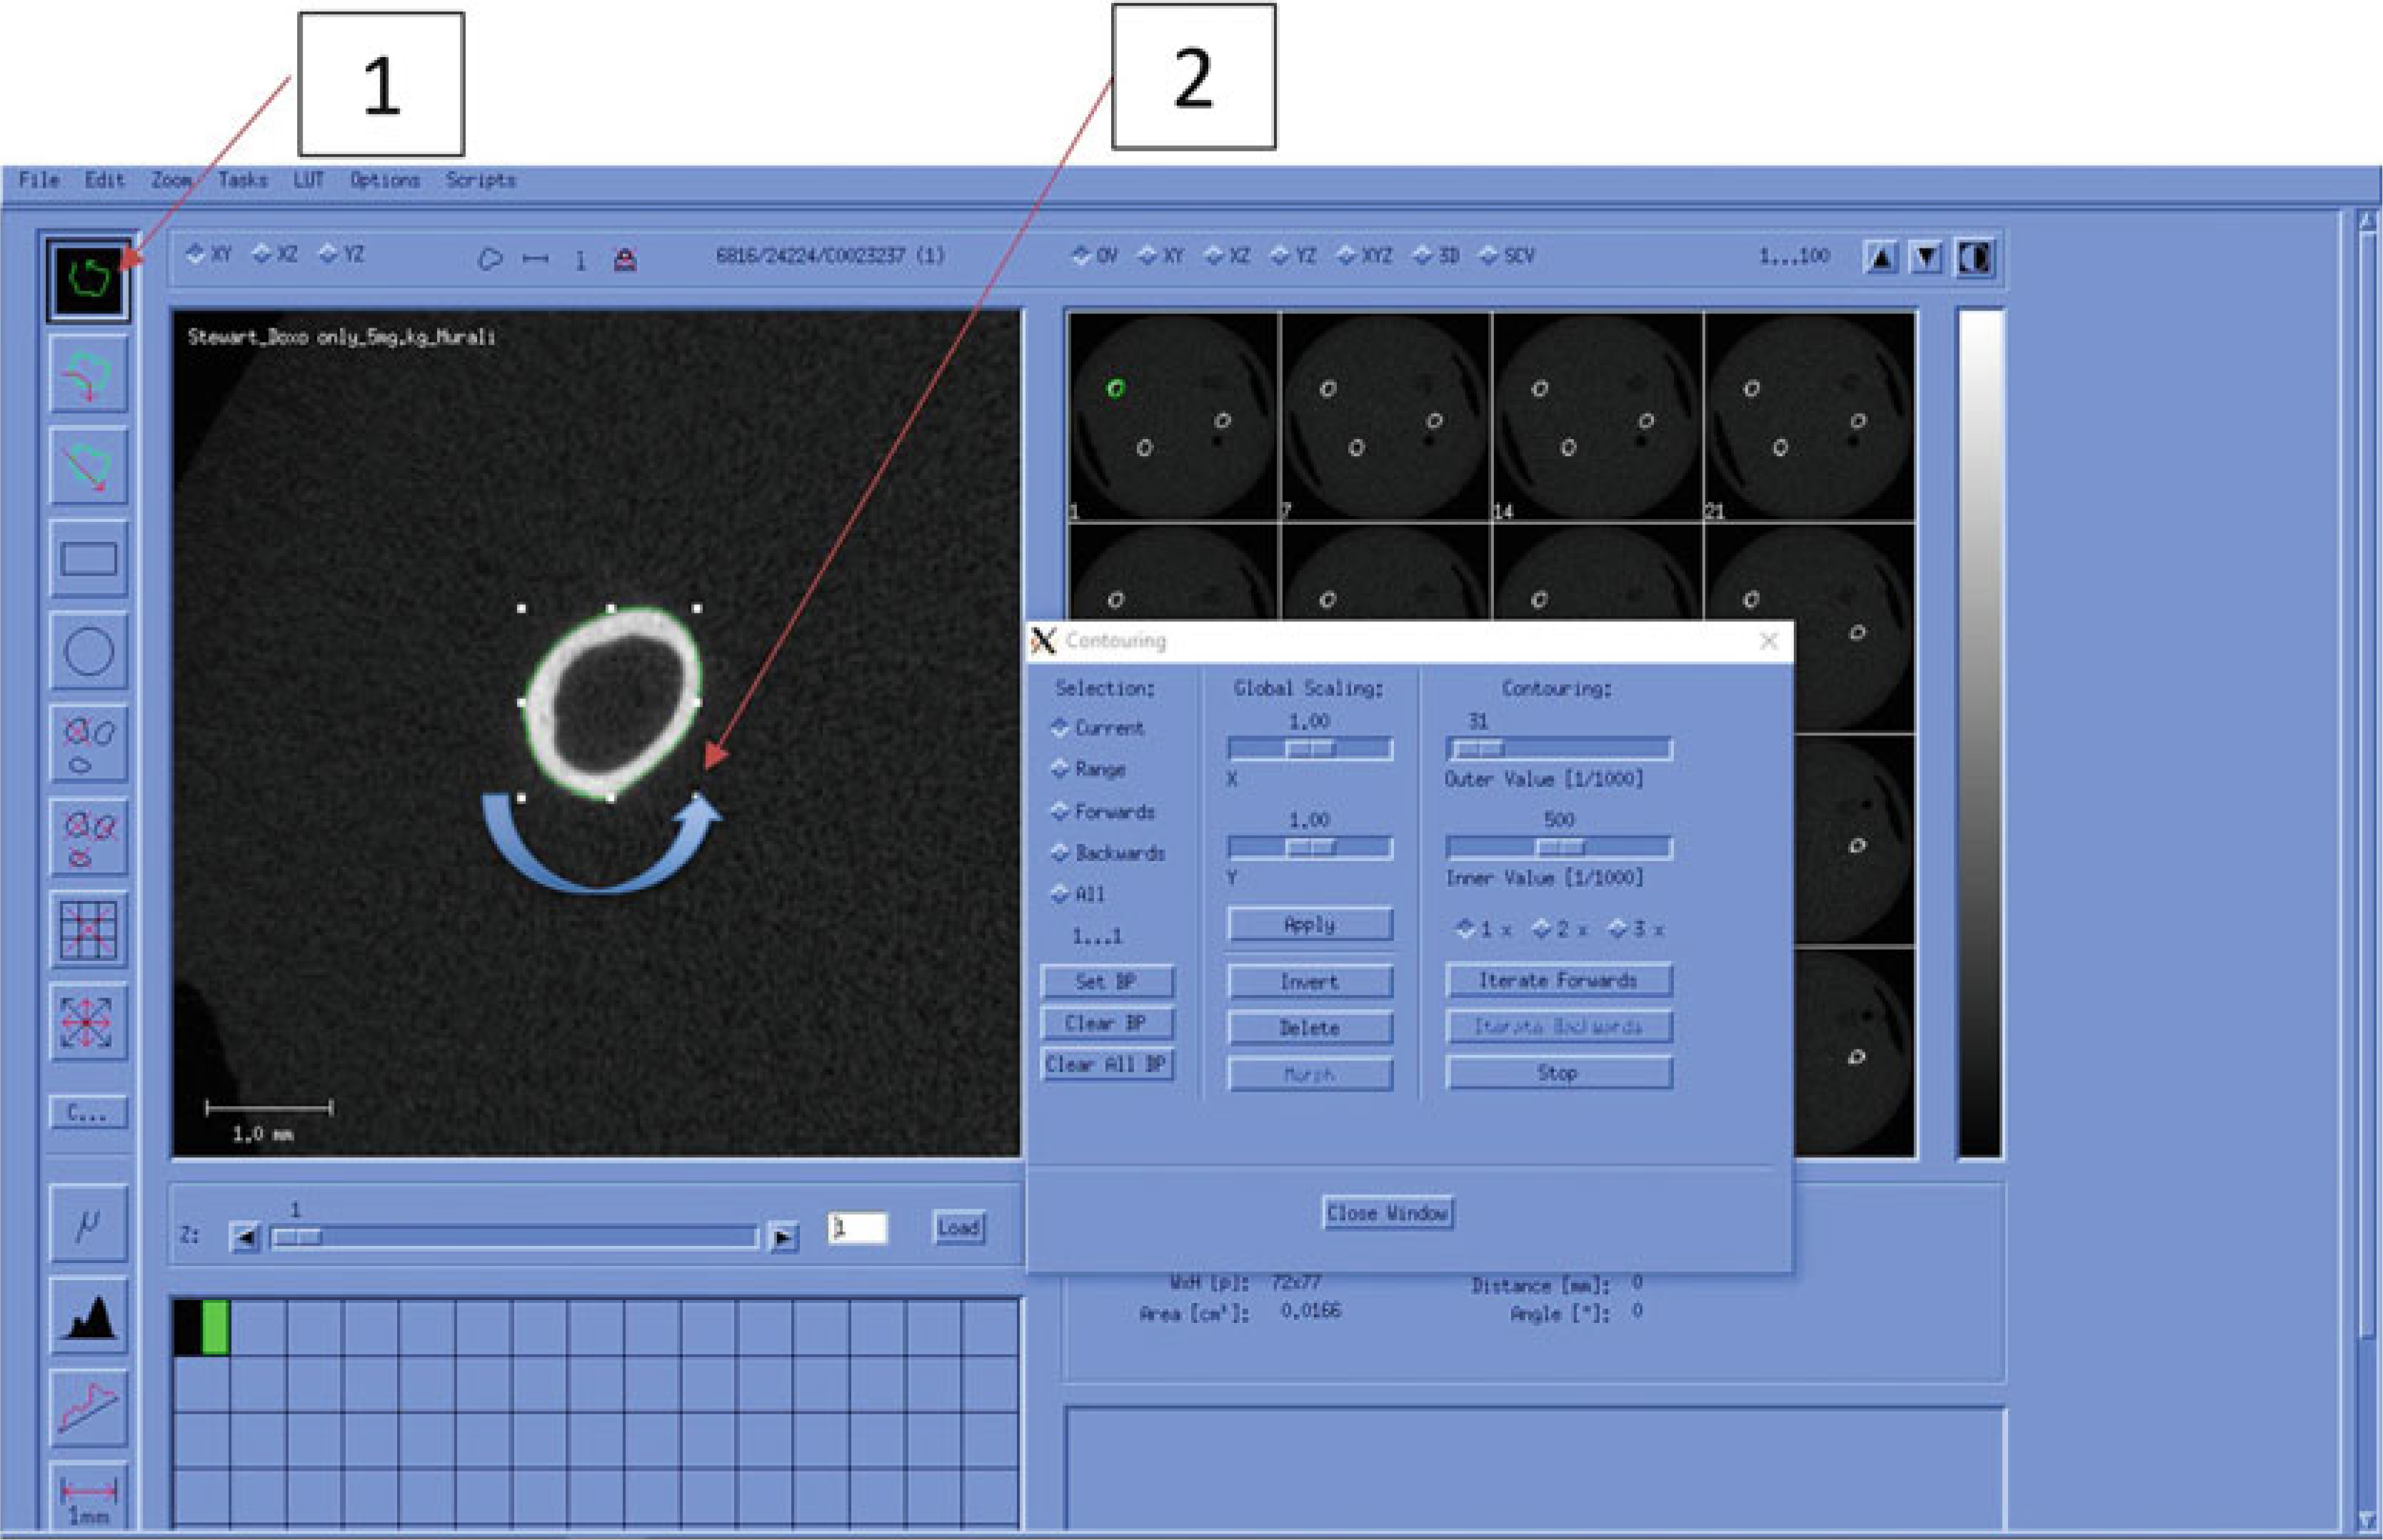
Manual Contouring (Cortical Bone)
Fig. 22.
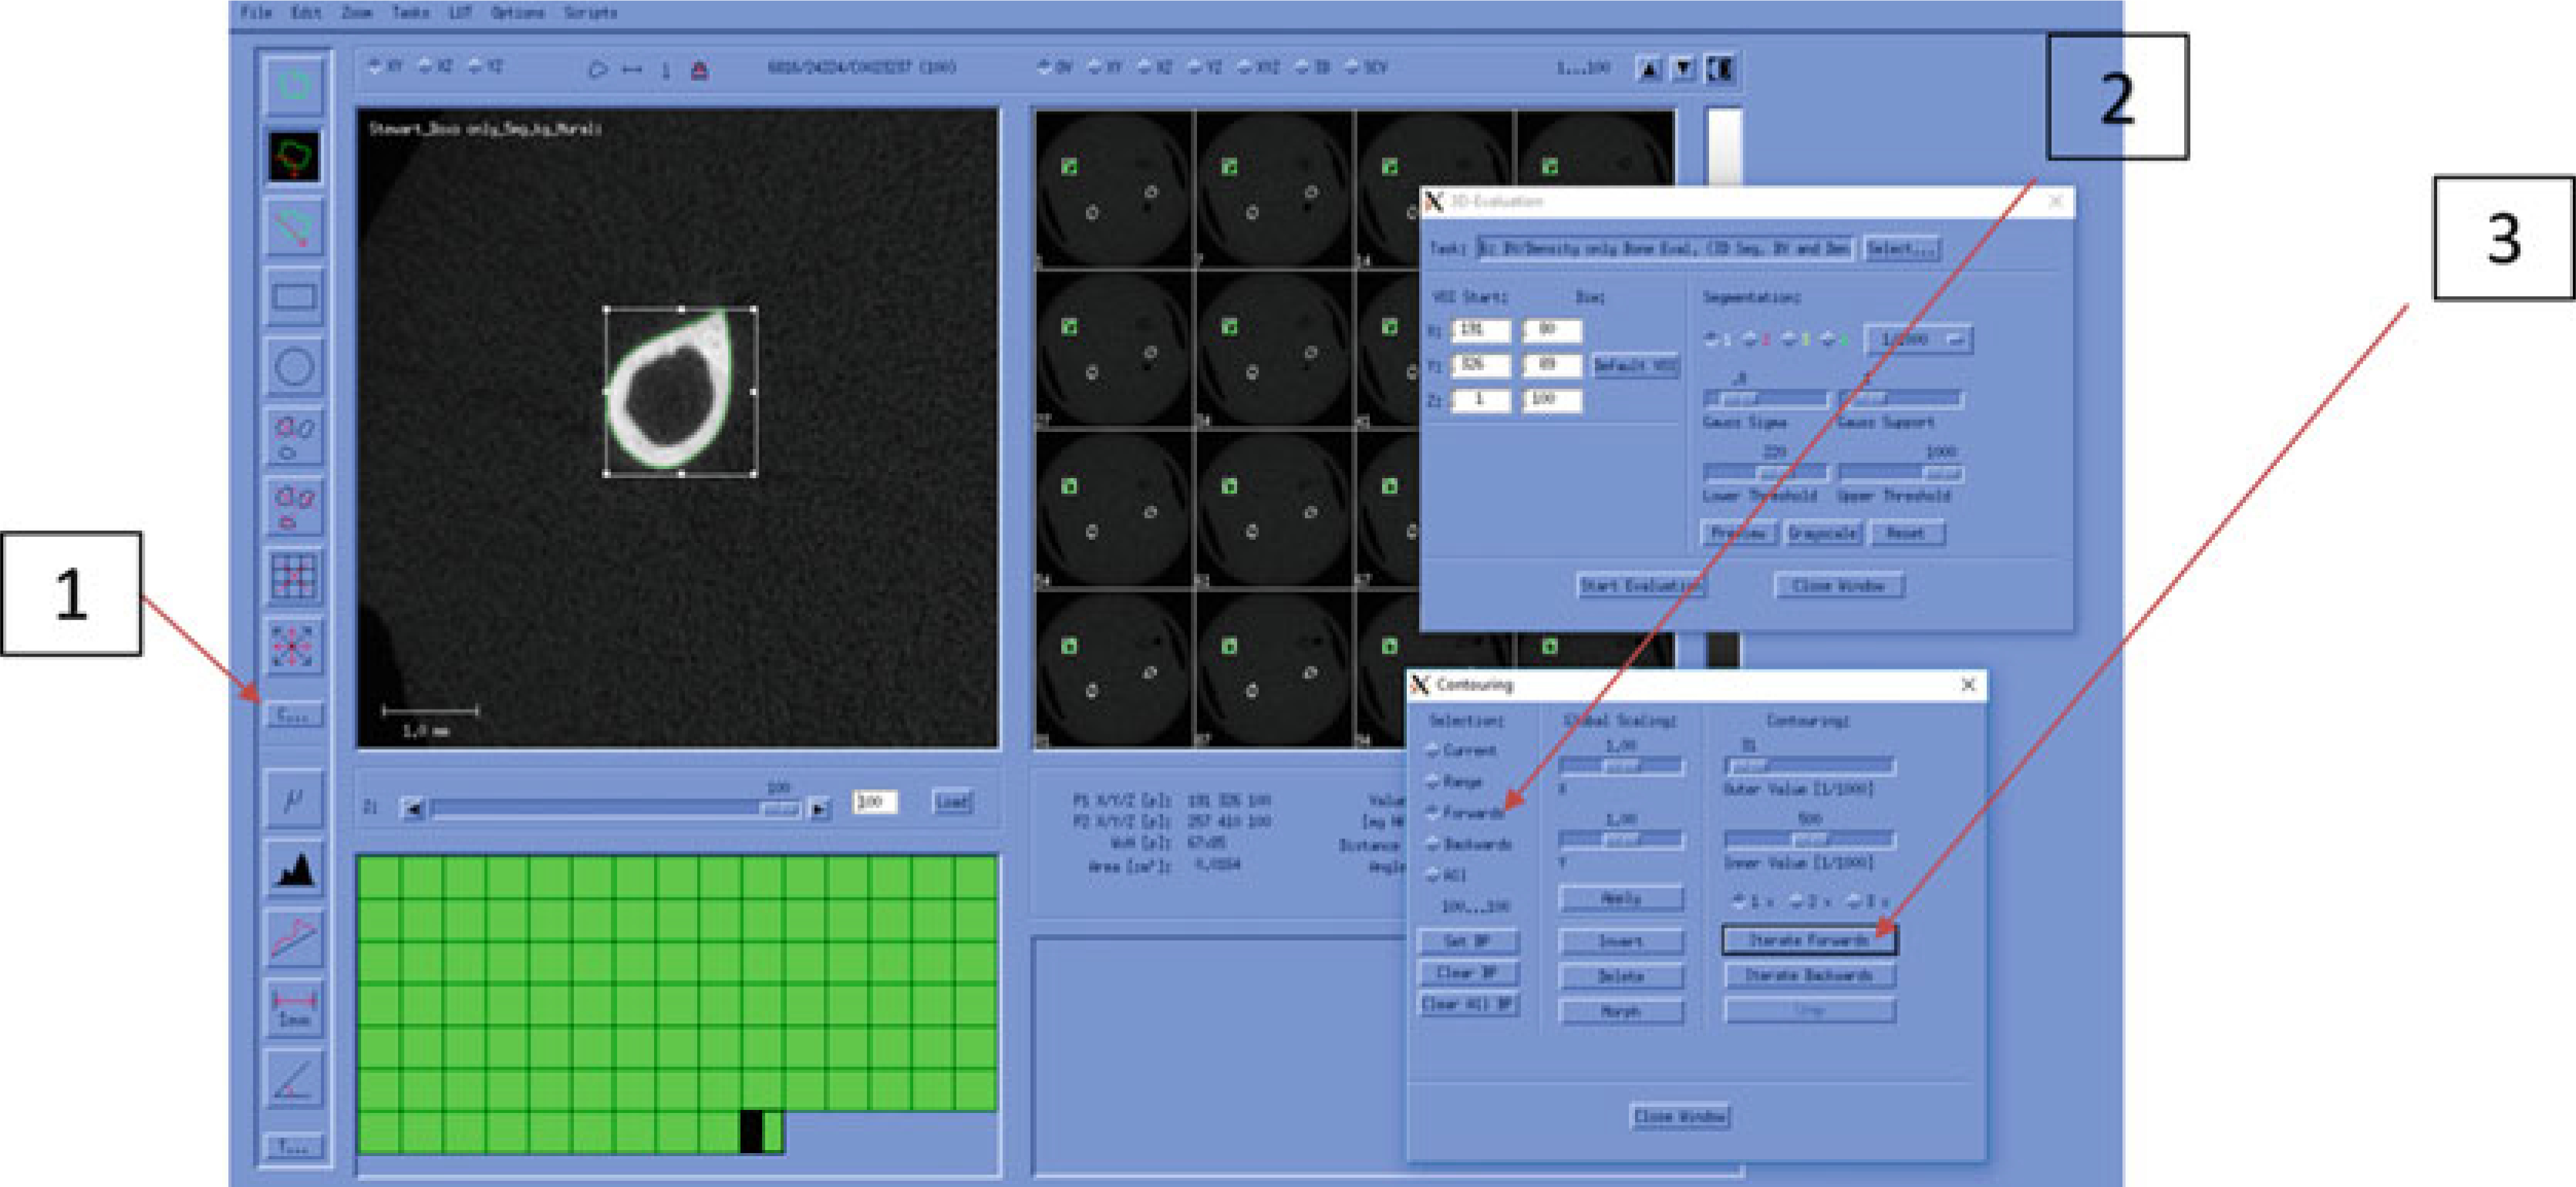
Automatic Contouring (Cortical Bone)
Fig. 23.
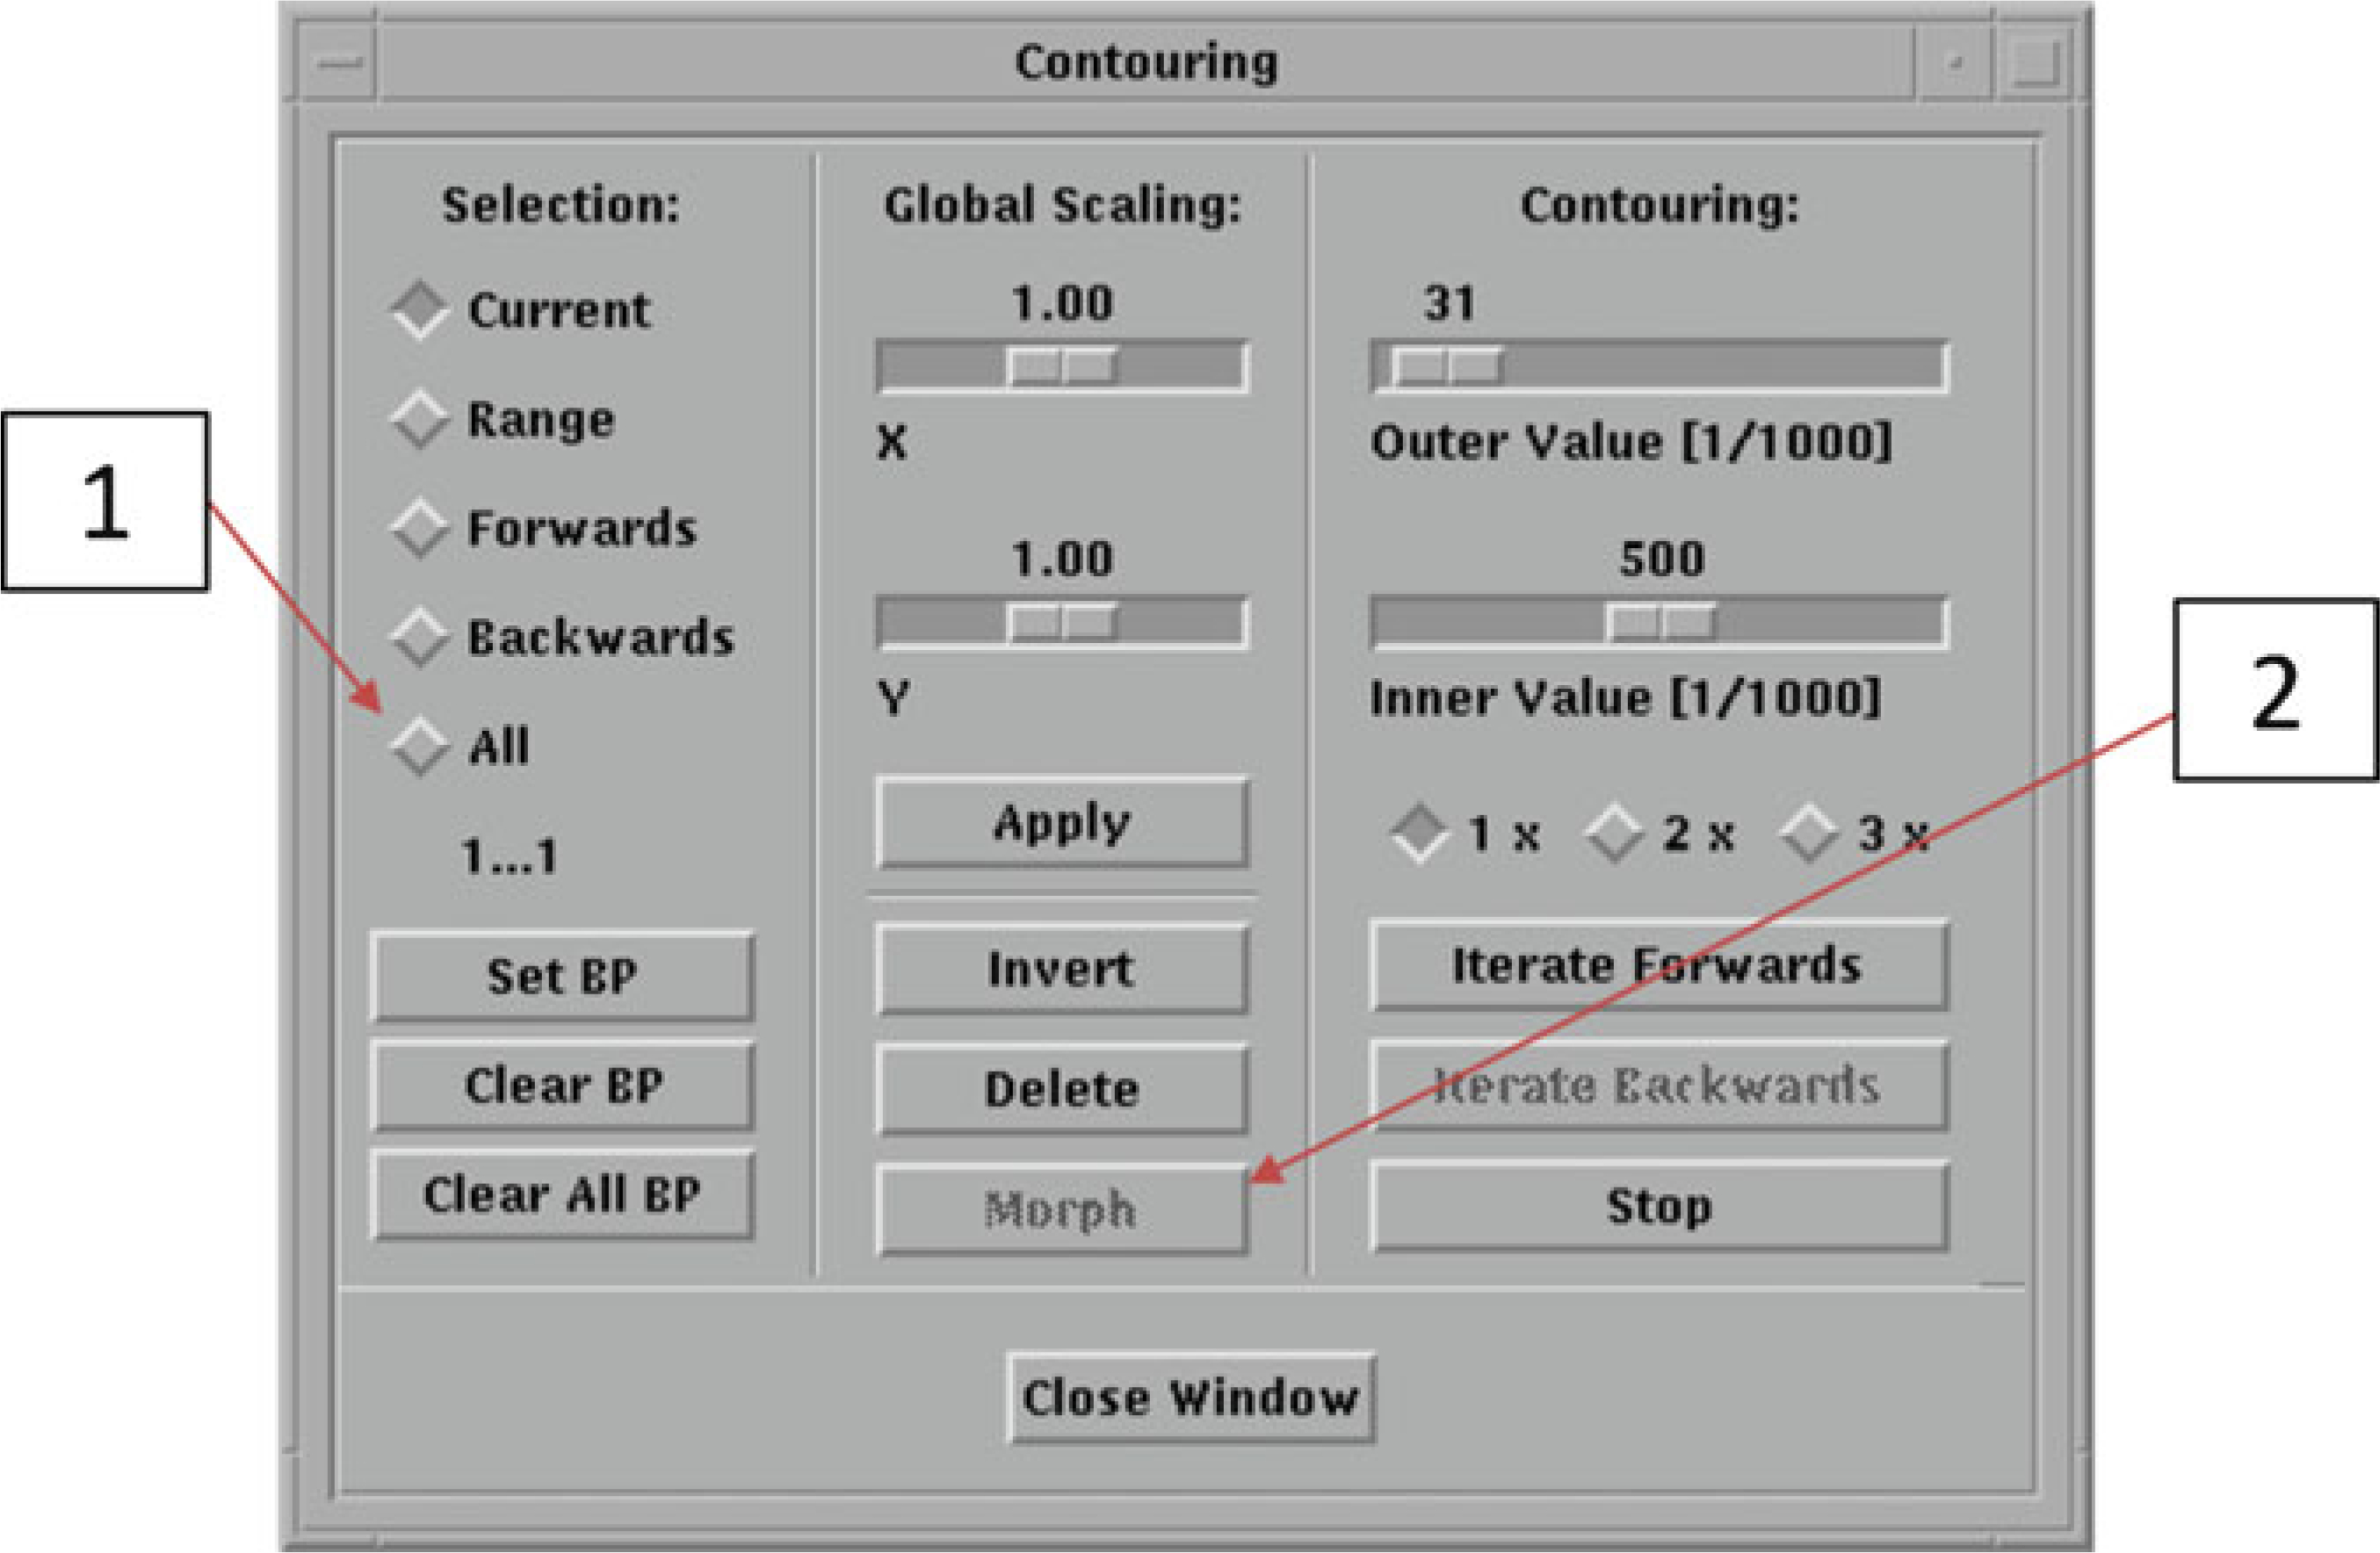
Automatic Contouring Window (Trabecular Bone)
Fig. 24.
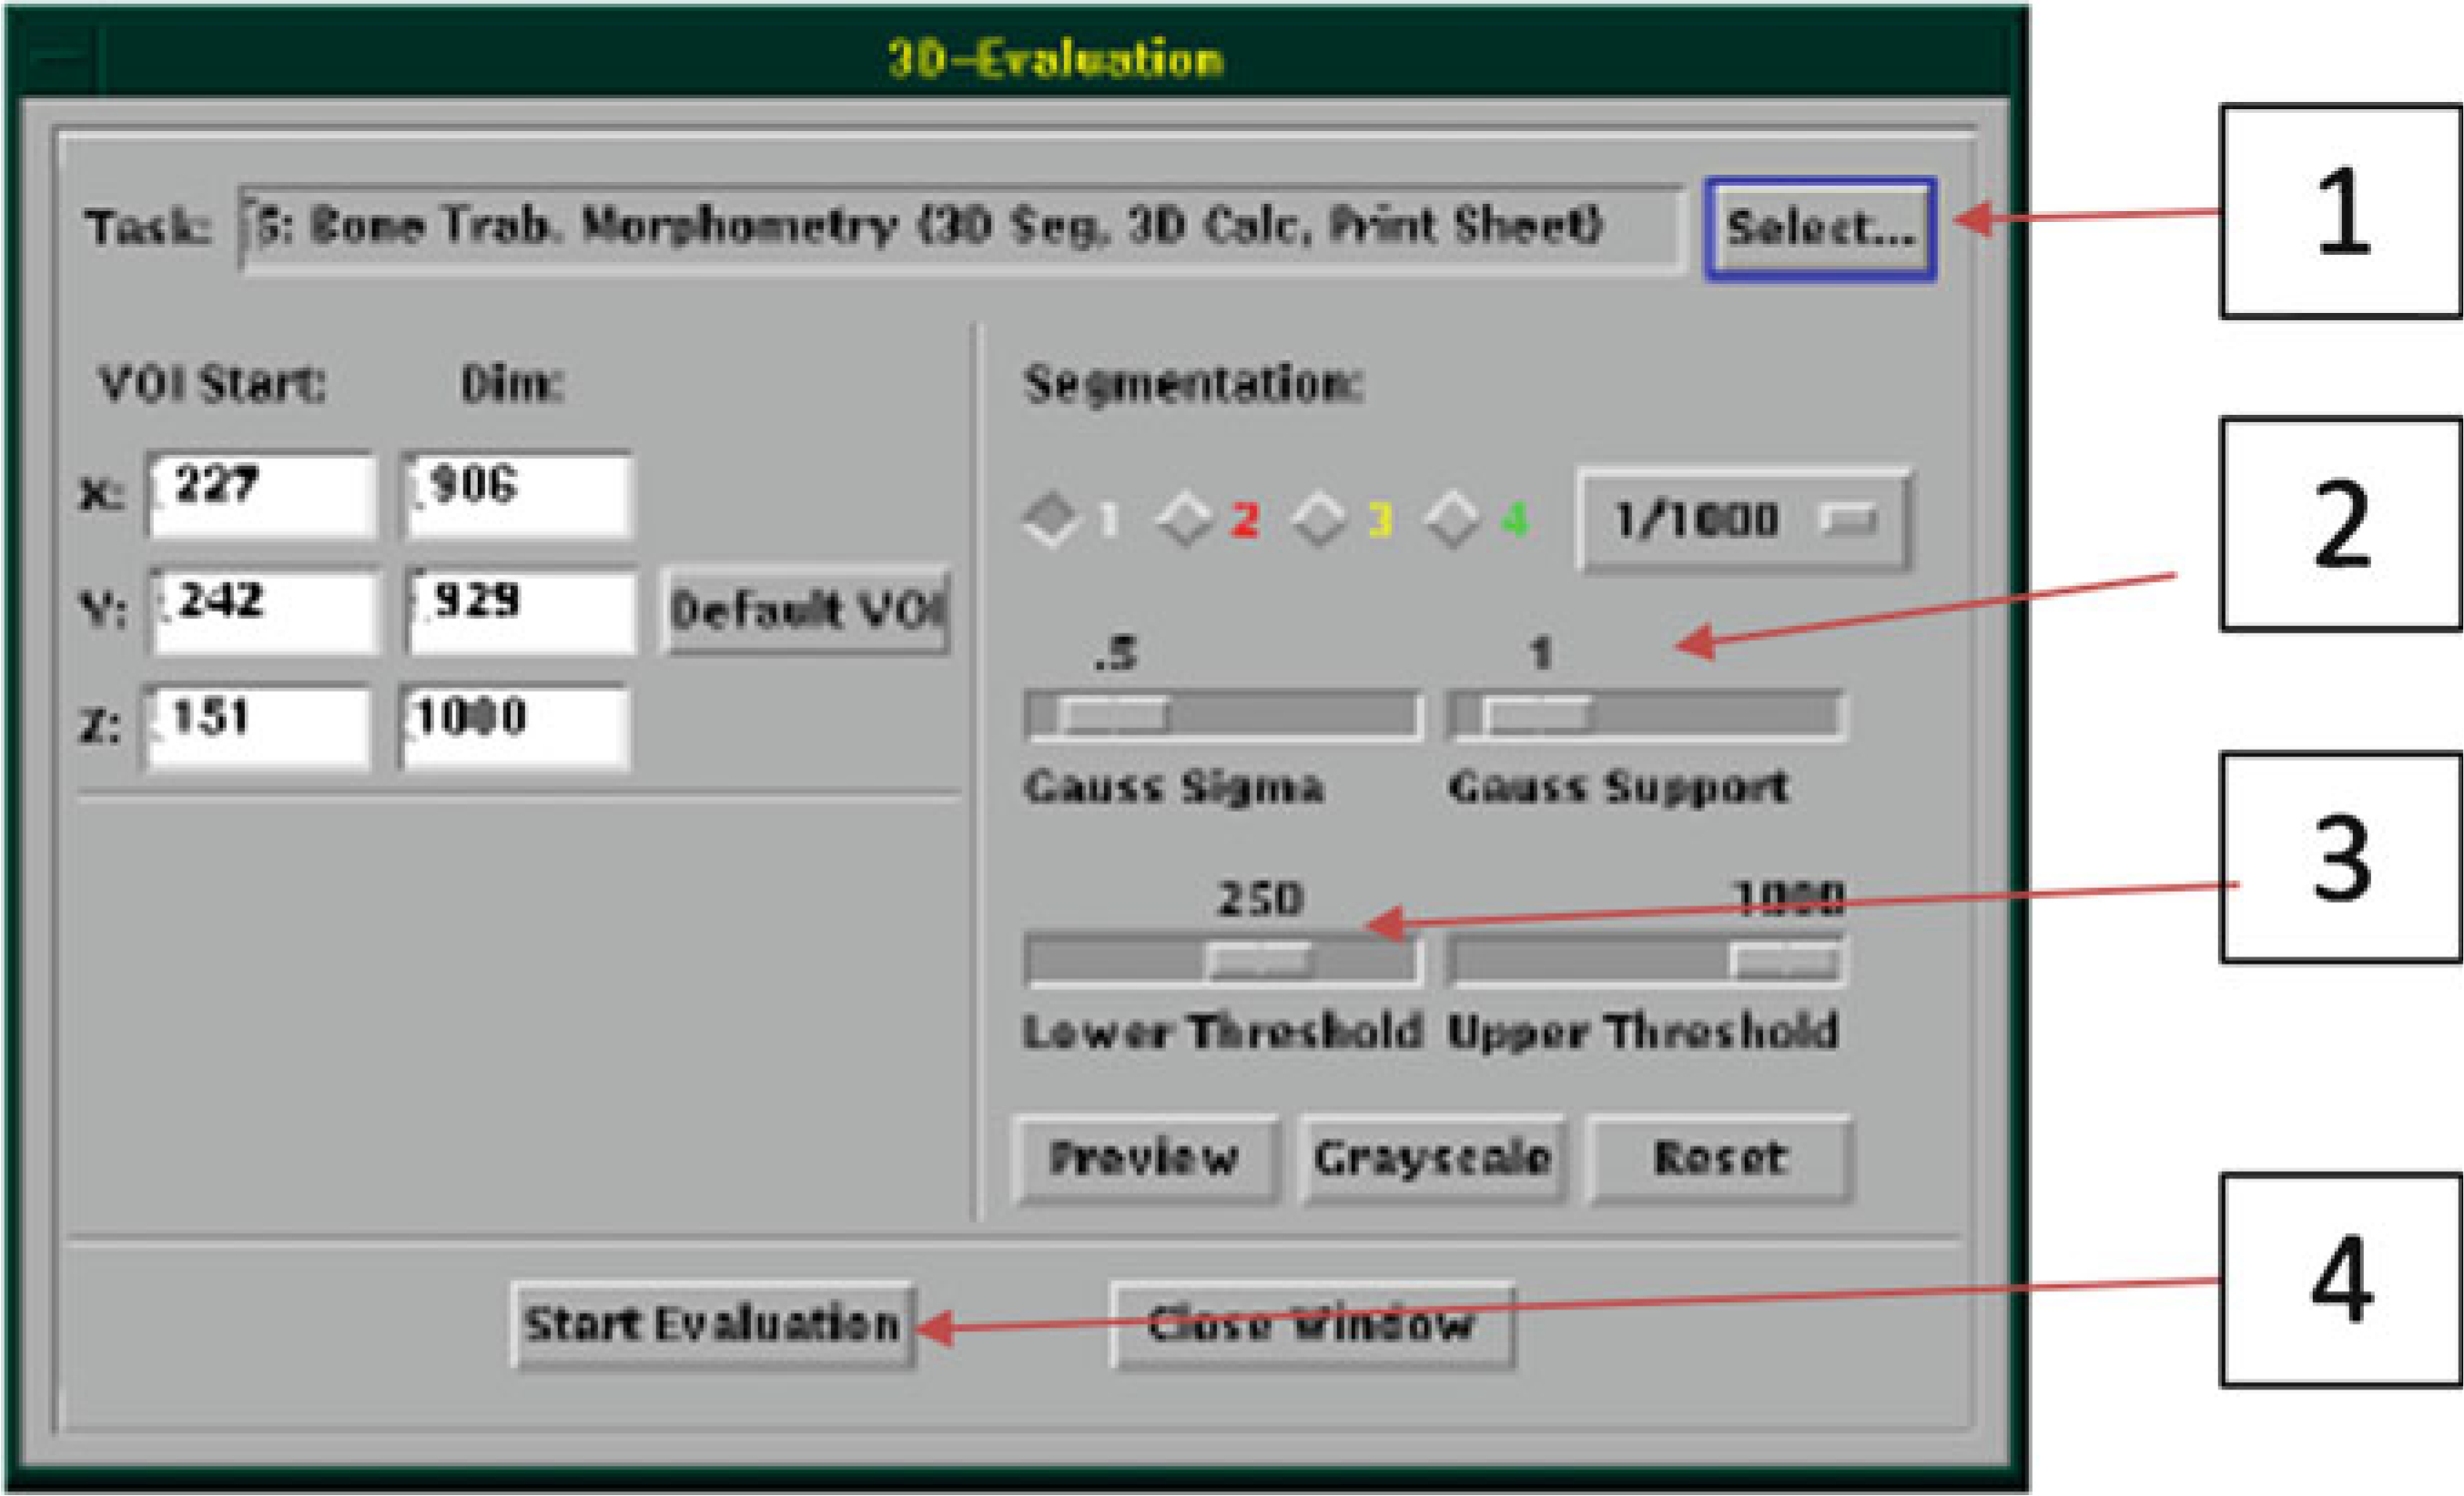
3D-Evaluation Window
Fig. 25.

Choosing the threshold (adapted from Bouxsein et al. [1]). (a) Grayscale image of femur metaphysis. (b) A good threshold value results in a segmented image that closely matches the grayscale. (c) Too high a threshold results in erosion of bone and underestimating bone volume. (d) Too low a threshold results in excessive bone
Fig. 26.
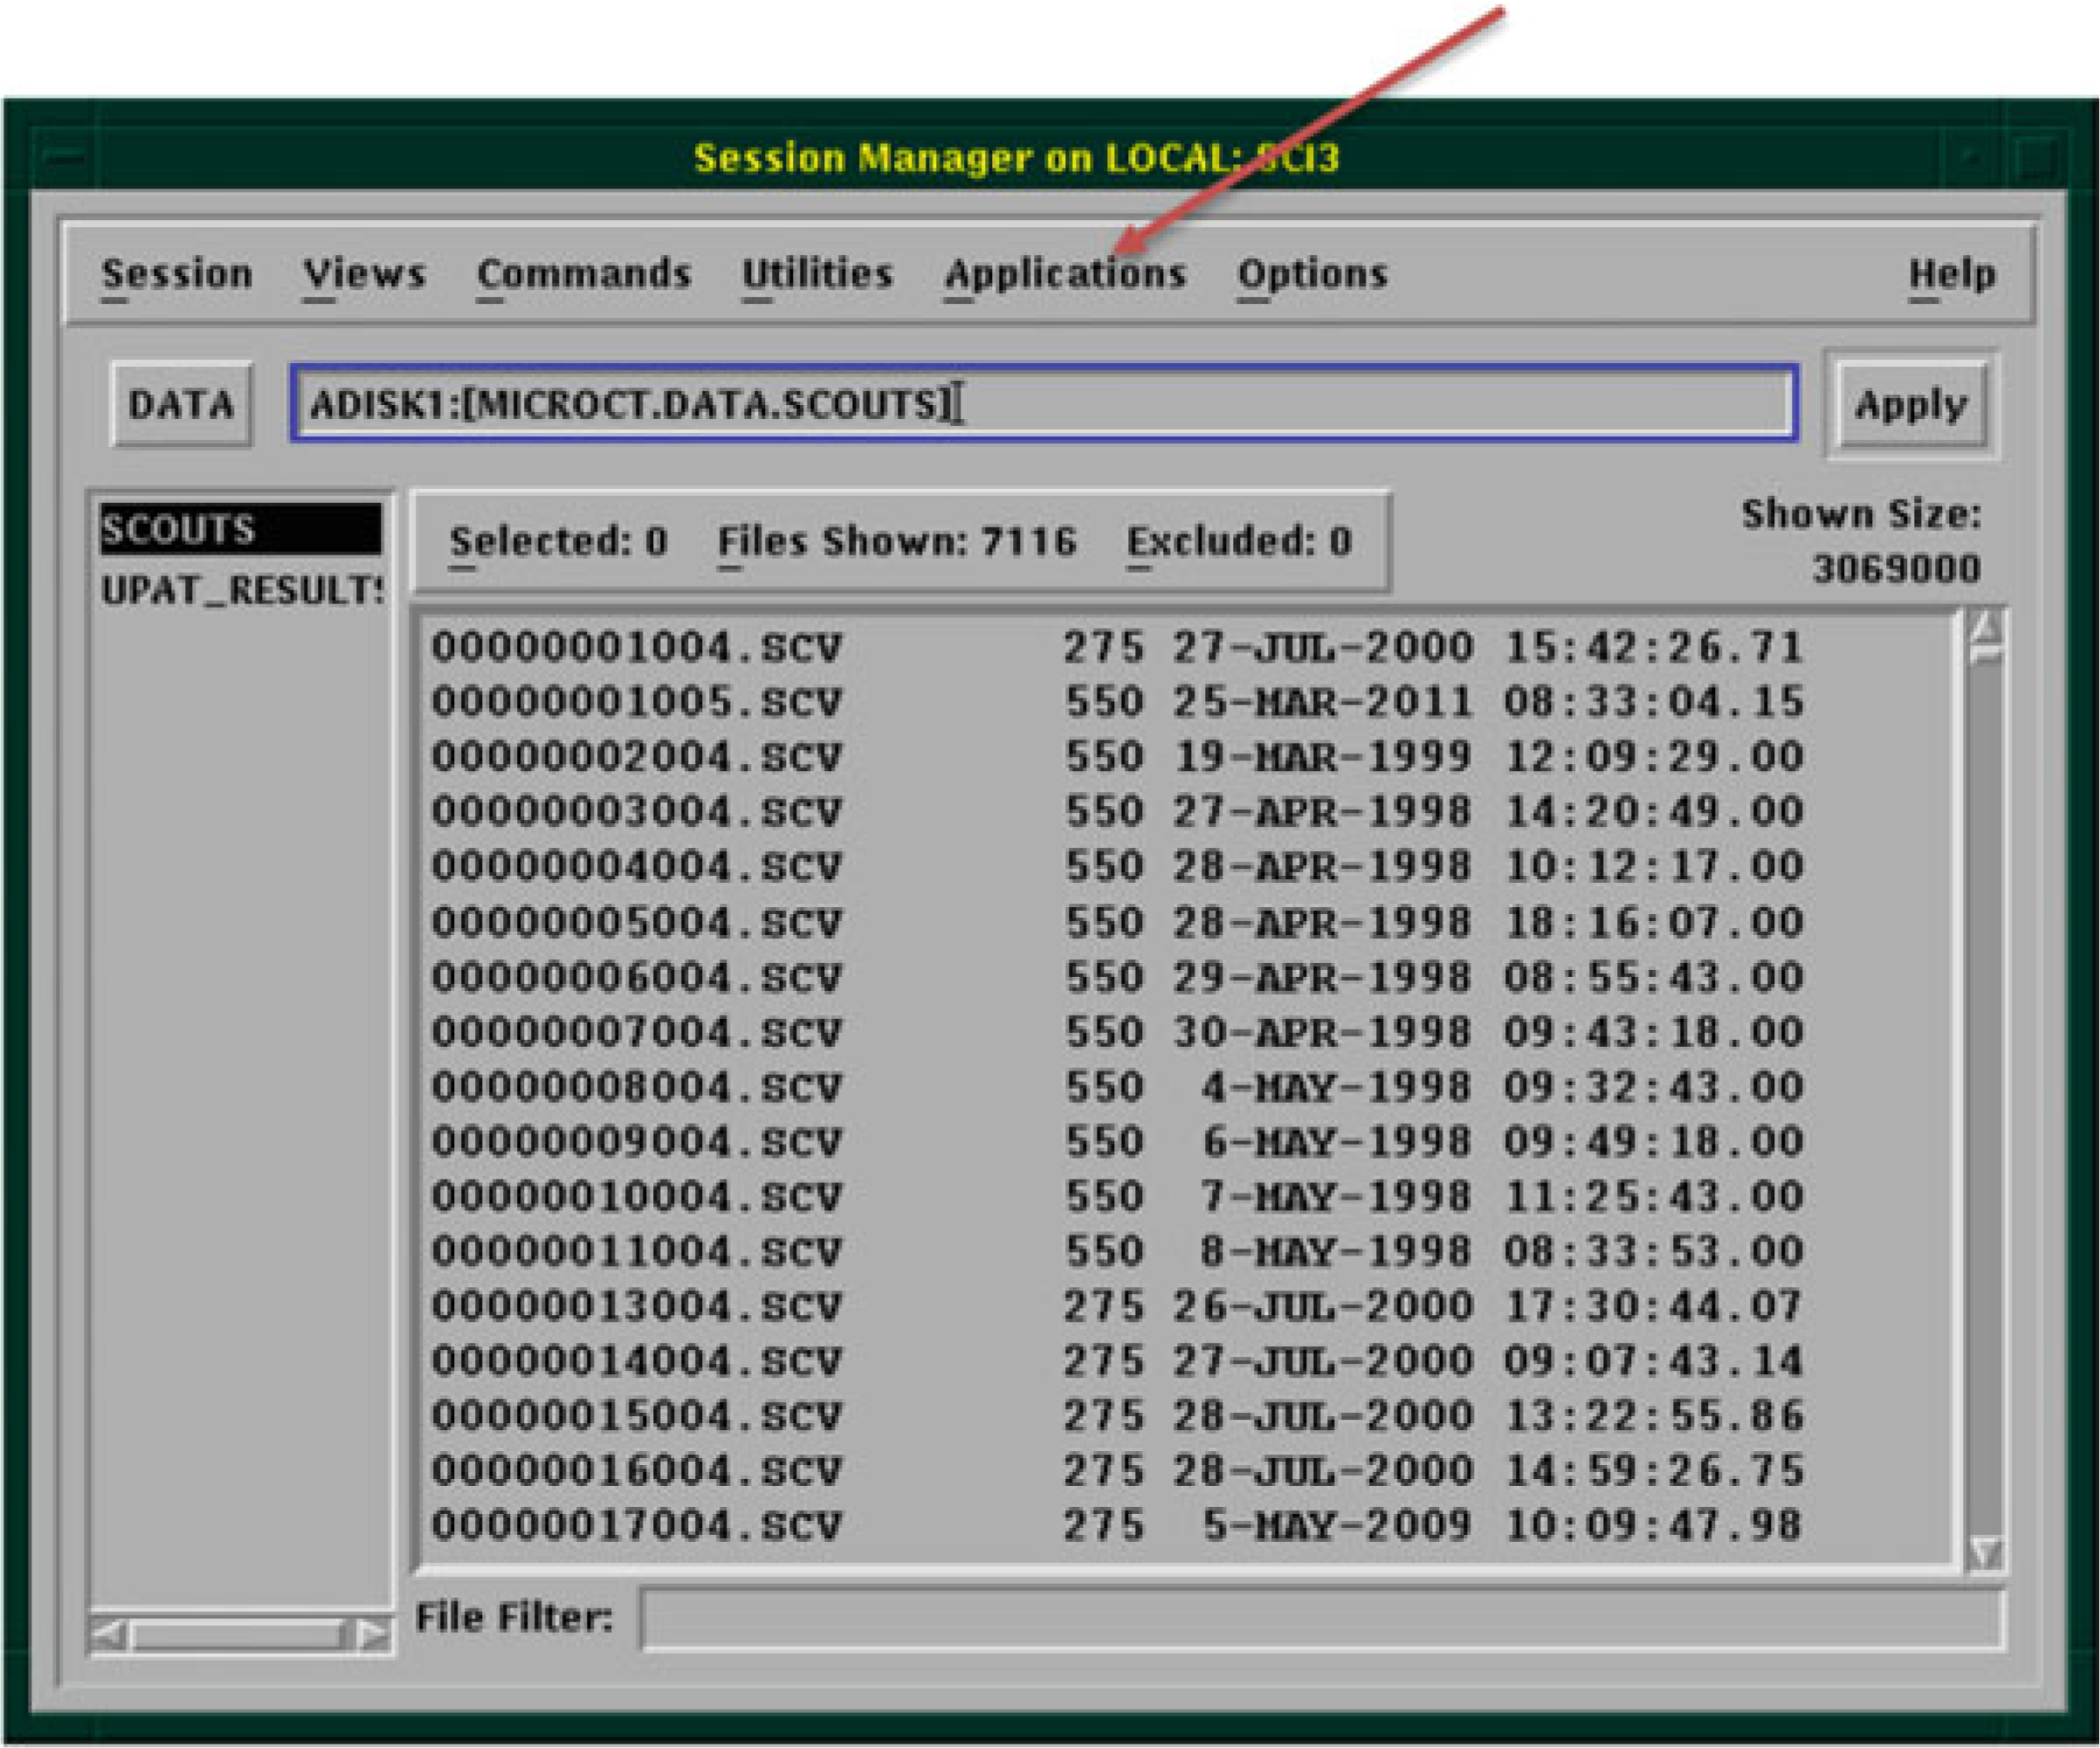
Session Manager Window
Fig. 27.
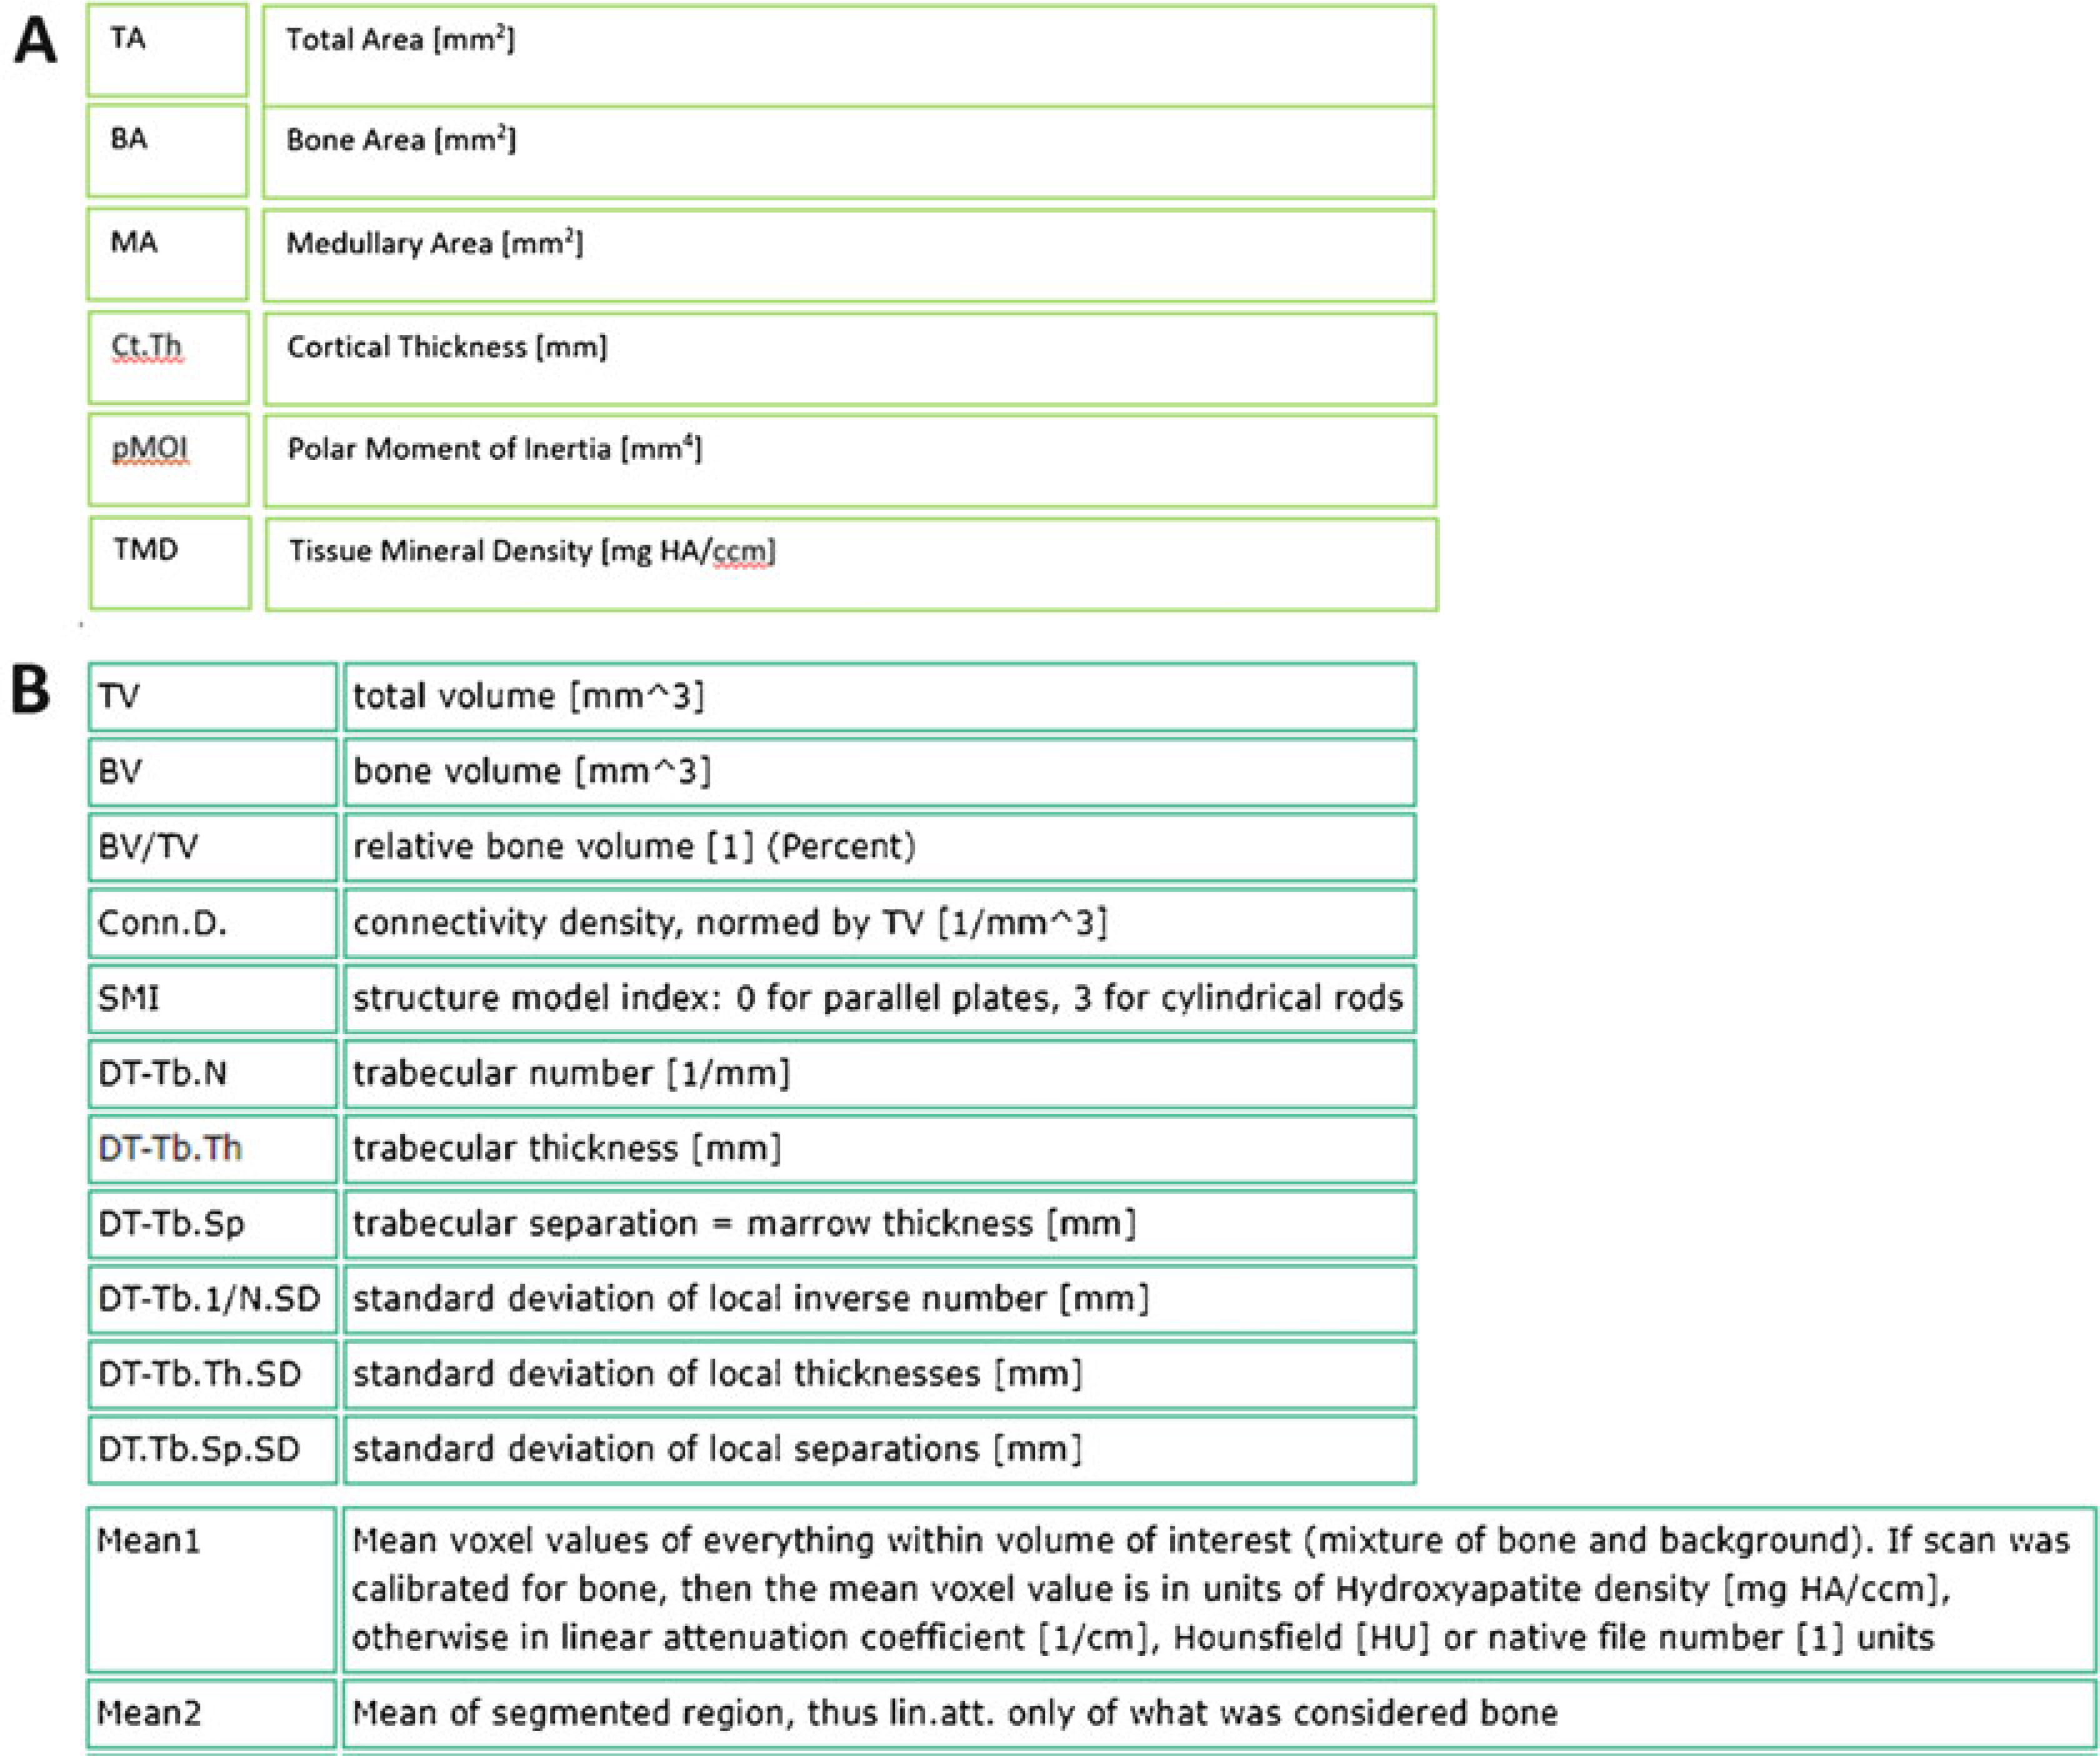
Structural and densitometric indices of bone from (a) Cortical bone analysis, and (b) Trabecular bone analysis. For trabecular analysis, the ‘VOX’ parameters are the most straightforward, as they are based simply on counting voxels; the ‘DT’ parameters are based on distance transformation analysis which is the only method recommended for these analyses. (Scanco Medical)
Fig. 29.
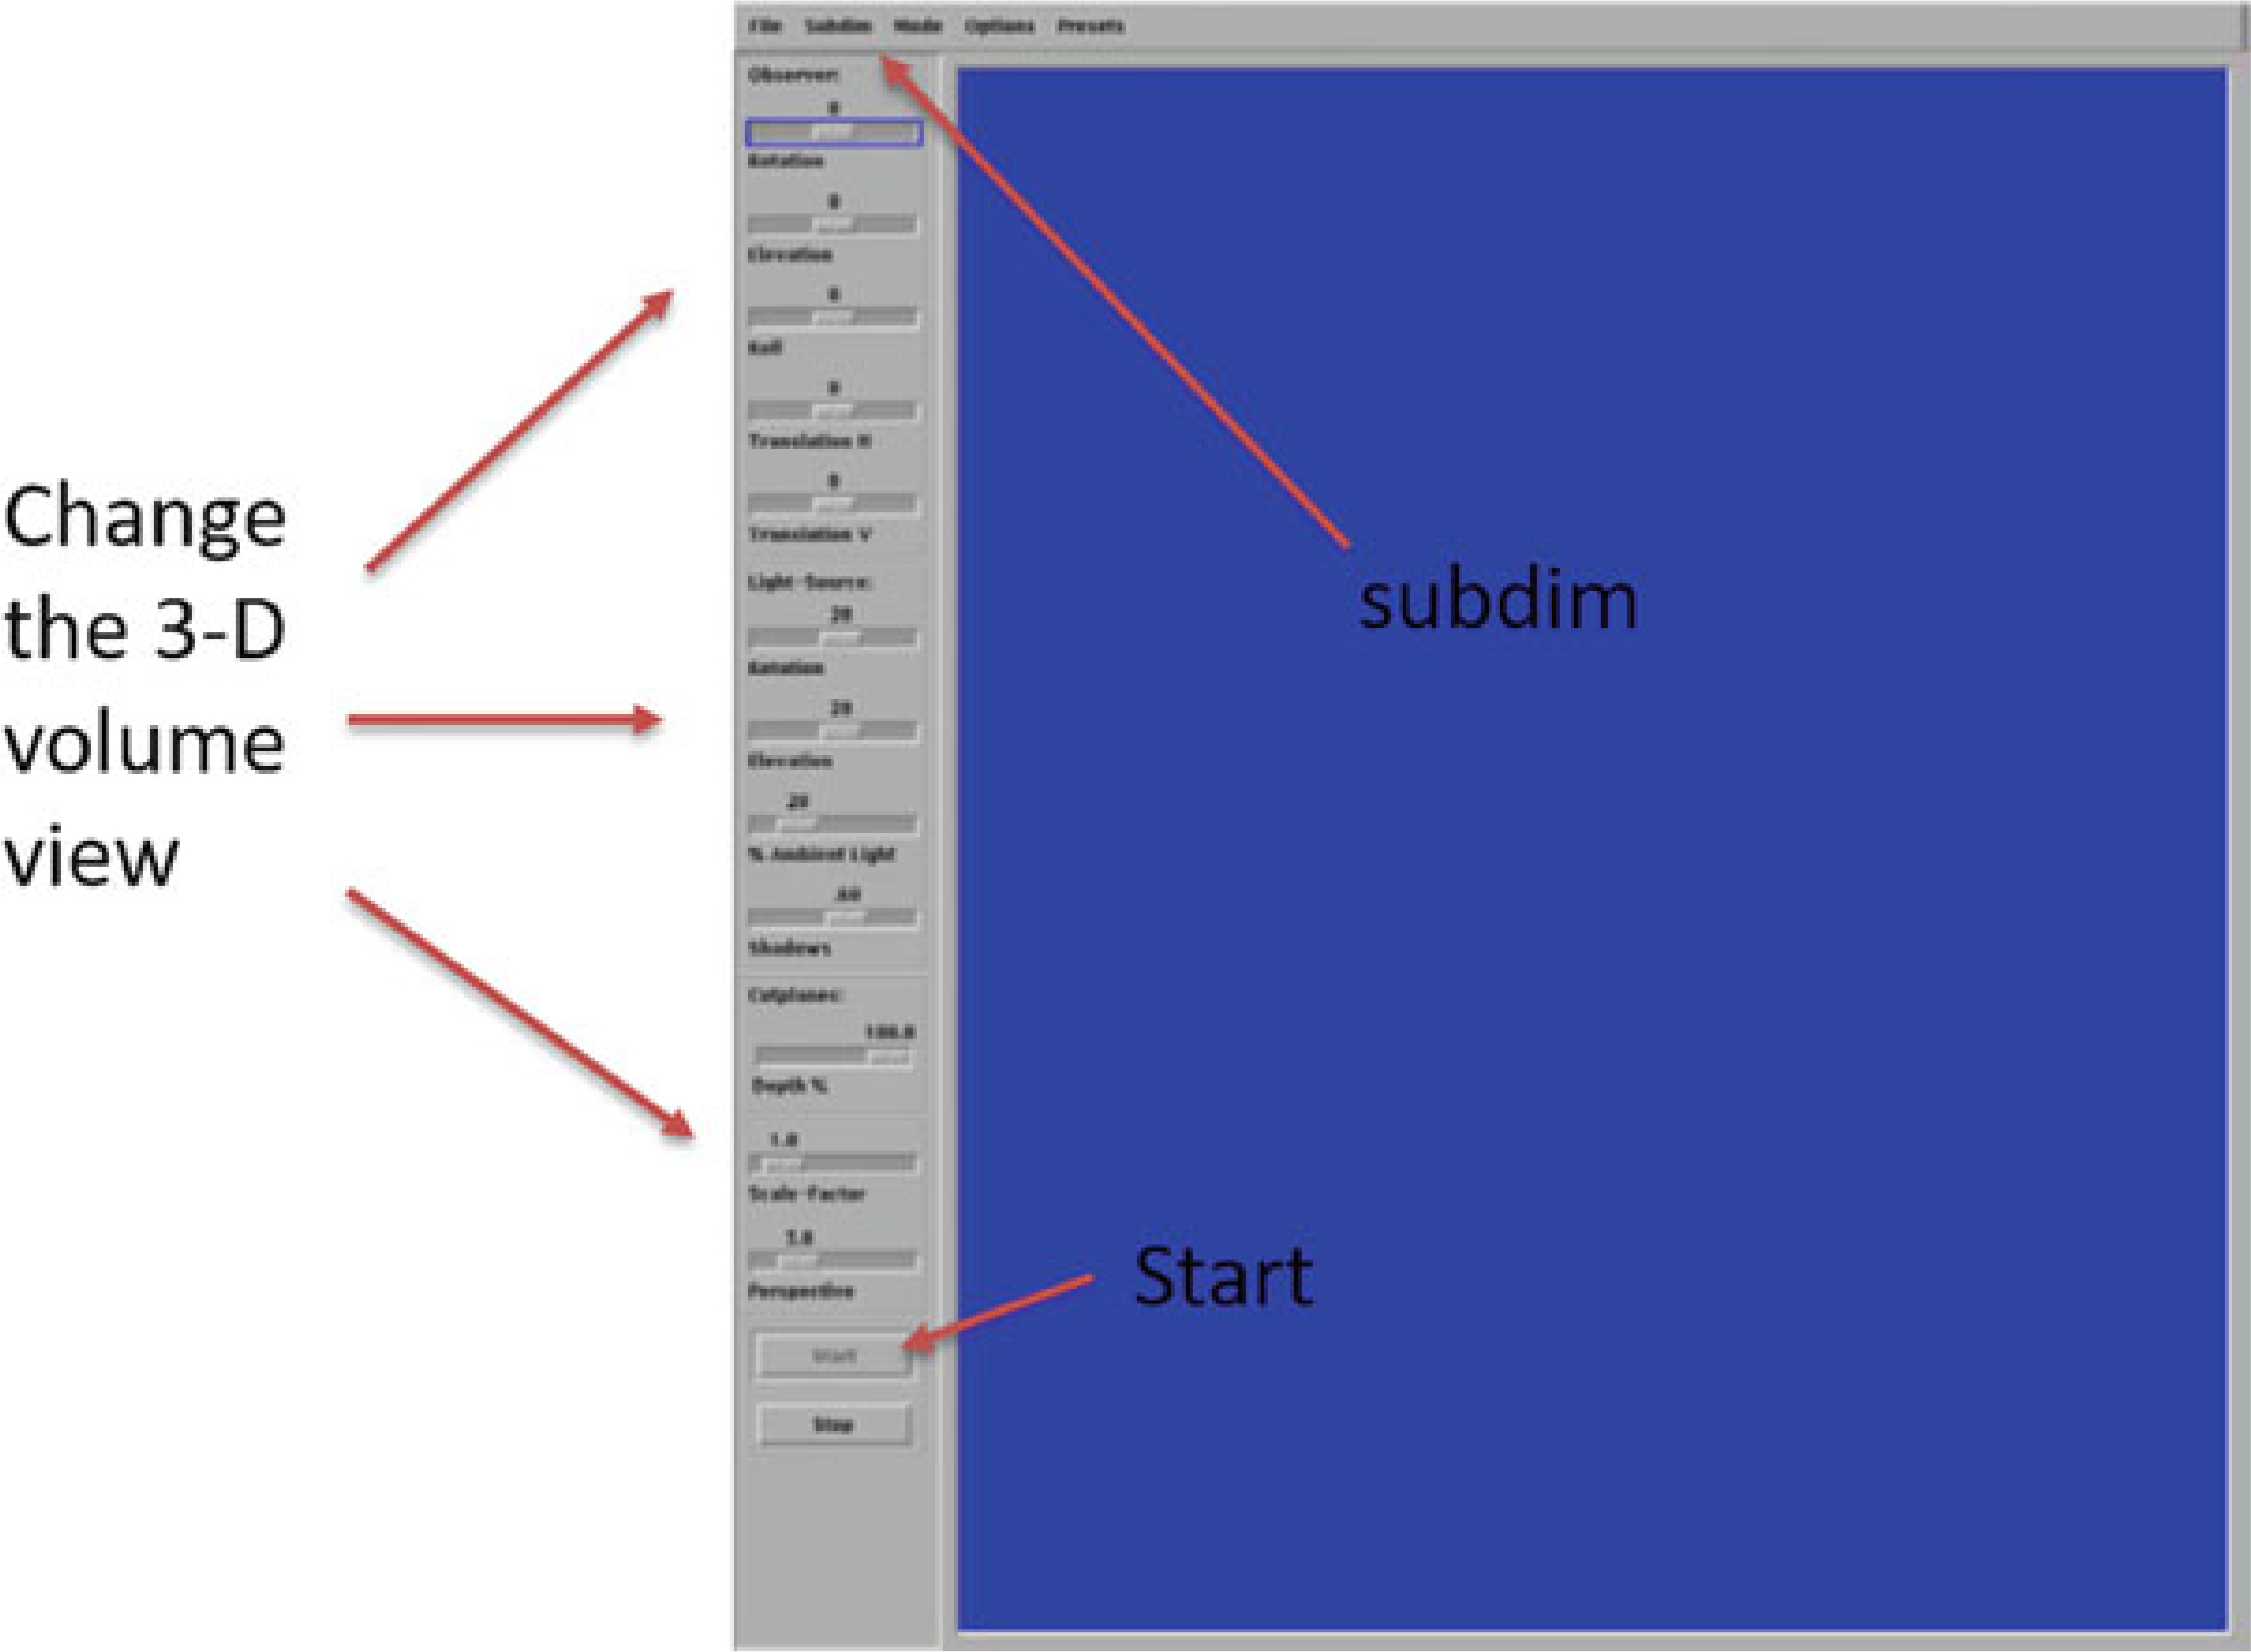
Main screen of 3D display
3.4. Third-Party Image Analysis Software
Users can export their images in DICOM (Digital Imaging and Communications in Medicine) file format and then use third party software for 3D image visualization (see Note 37).
3.5. Quality Control (QC)
System managers should perform weekly density calibration check (‘QC1’) using the Scanco provided phantom. This will confirm accuracy of mineral density values (Fig. 30) (see Note 38).
System managers should perform a monthly check of scanner alignment (geometry), also called “QC2.” This routine uses three fine aluminum wires in the phantom to check alignment.
Fig. 30.
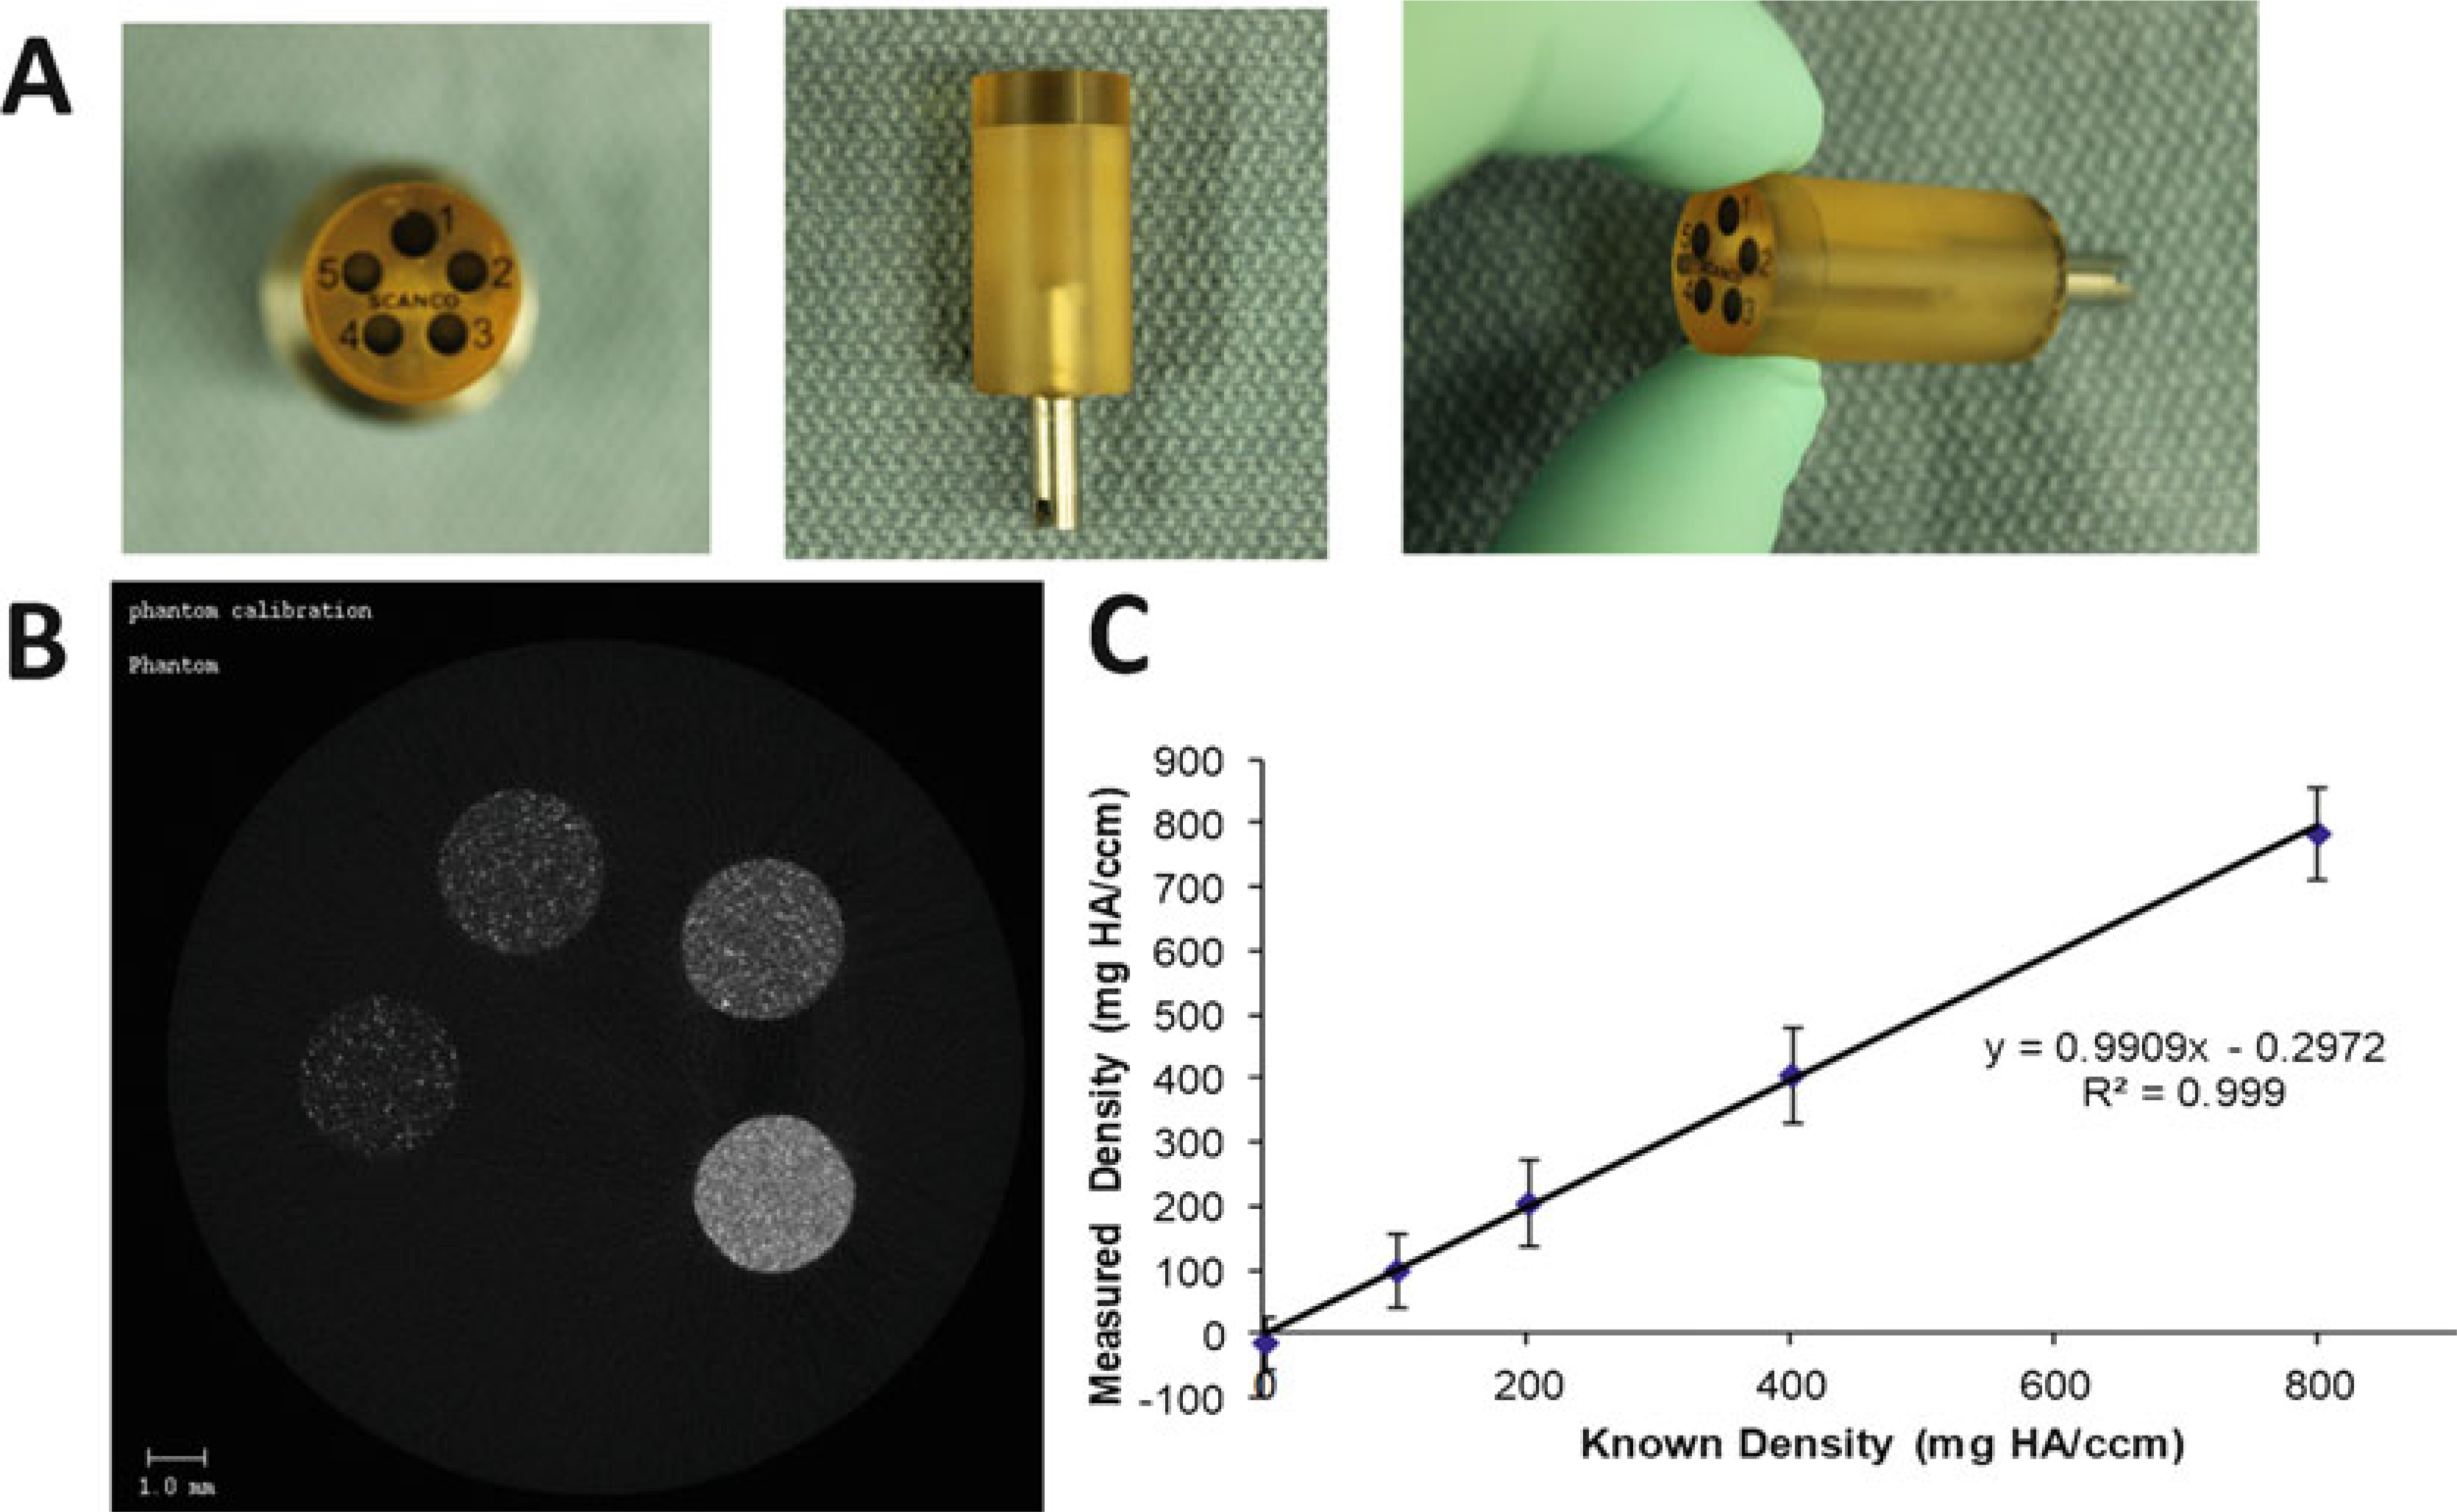
(a) Scanco Phantom Block. (b) CT slice of phantom shows the five rods of different densities. (c) Regression line from QC scan showing excellent agreement between known phantom density values, and values measured in the QC scan
Fig. 28.
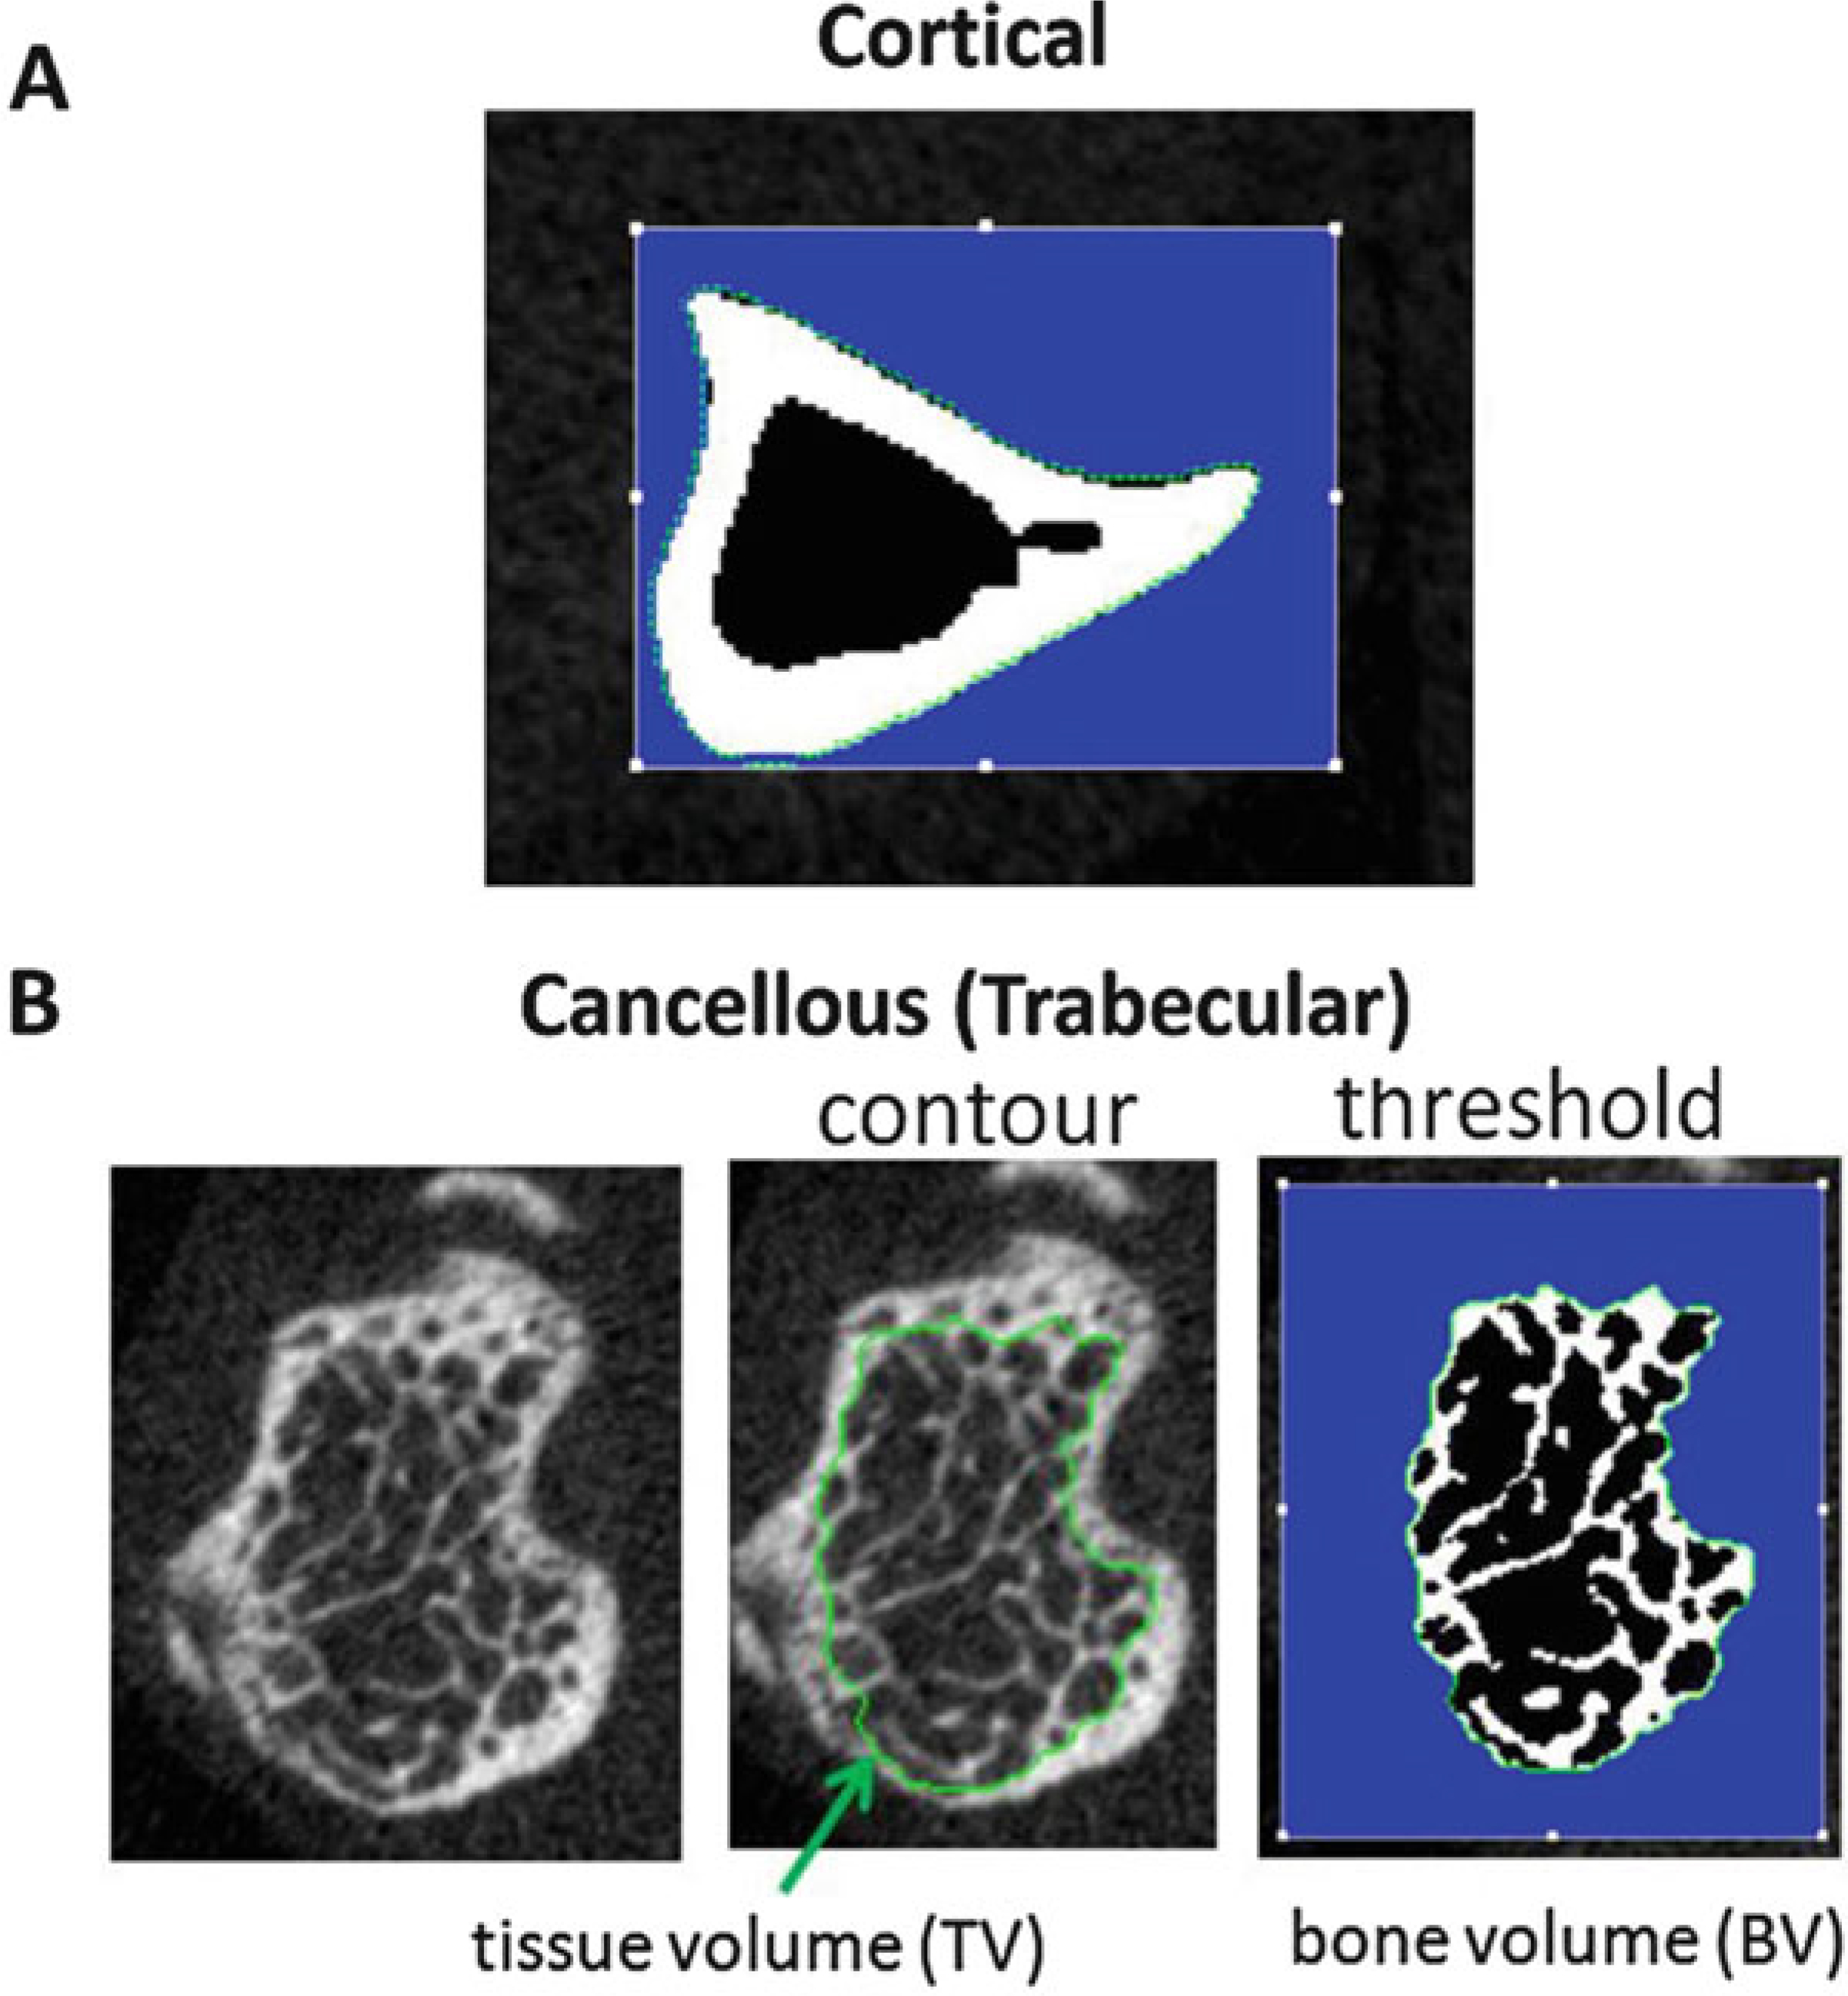
(a) Cortical Bone Slice. The green contour defines the periosteal surface. (b) Cancellous (Trabecular) Bone Slice. The green contour defines the cancellous region, inside the cortical shell. After thresholding/segmentation, the bone voxels are white, and the nonbone voxels (marrow) are black. The blue region is outside the contour and not part of the ROI
Acknowledgments
Washington University Musculoskeletal Research Center (NIH/-NIAMS P30 AR074992).
4 Notes
Do not use boiling or hot agarose. It causes damage to the sample and will negatively affect later histology or mechanical testing.
While the principles described here will be instructive for other systems, many of the details are specific to SCANCO microCT systems, and in particular to the system used in our lab (SCANCO μCT 40). At the time of this writing, we were running version 6.4 of the Scanco Tomography program, and version 6.6 of the Scanco Evaluation program.
For samples that will go to histology after microCT, minimizing the time from animal death to sample collection is important. The precise time window depends on the downstream staining protocols; the user should consult with histology personnel to determine what is recommended. For example, if immunostaining is planned a short time to dissection (<15 min) is important. But for doing analysis of bone mineralization (e.g., Calcein/alizarin labels, plastic embedding) a longer time may be acceptable. (We have dissected bones from mice stored in the −20 °C freezer for several months, and Calcein/alizarin labels were well preserved.) For samples that will go for mechanical testing, time to dissection is not as critical; <1 h should be fine. Or you may freeze the entire limb or mouse at −20 °C, and then dissect at a later date.
Dissection extent. The extent of muscle/soft tissue dissection prior to microCT depends on the downstream analysis, and may require some practice. For histology, if this is limited to endosteal/cancellous sites then aggressive muscle removal is fine. But if you want to look at periosteal sites, then preserving some muscle is essential to keeping the delicate periosteum intact. A limitation of having more muscle is that times for fixation and other histology processing may need to be increased. For mechanical testing, more aggressive removal of muscle is recommended so that loading fixtures are in direct contact with bone.
Specimen fixation. Protocols for specimen fixation can be found on the Histology & Morphometry Core page of the Washington University Musculoskeletal Research Center website: https://musculoskeletal.wustl.edu/cores/core-c/protocols/
Sample holder selection. Generally, choose the smallest Scanco sample holder that can hold your samples. Holders range in size from approximately 12–35 mm diameter and will allow for a range of nominal voxel sizes, as discussed in the Introduction (Table 1). The smaller the tube, the higher the resolution. We describe the use of a 20 mm tube, which allows for staging of five femurs in a single scan. If you prefer to scan one bone per scan, a 12 mm tube is recommended.
Recording bone locations. If you put multiple bones into a sample holder, it is essential to record the position of each of your samples in your lab notebook. The top panel of Fig. 8 shows a schematic of five bones, in positions A–E, along with a rubber band as a fiducial marker. We recommend drawing a sketch similar to this to record the specimen IDs of your bones. This sketch will allow you to identify which bone is which for the later analysis steps (Subheading 3.3).
It is essential that no excess Parafilm® or any other added material be on the outside of the specimen holder. The tube rotates during scanning and excess or loose material may contact and damage the interior of the scanner.
Sample naming. Start with PI LastnameFirstinitial, include sample/project information, and user name/initials (e.g., “SilvaM_FemurBmp2Mice_YK”).
Energy/Intensity. The scanner will have a number of preset options; our scanner has six, and for mouse femurs we choose 70 kVp, 114 μA, 8 W. Note that X-ray tubes operate at discrete powers (watts, W). Voltage, current and power are related by this simple equation: Voltage [V] × Current [A] = Power [W]. Our tube operates at either 4 or 8 W. So, once we decide on a kVp value, there are only two possible μA values to choose from. As described in the Introduction (Table 2), 70 kVp is a good selection for cortical bone, especially if scanning multiple bones in a single scan. We choose a higher current (114 μA) to get better signal-to-noise than a lower current.
Resolution. Choosing “High” is recommended here because the combination of a 20 mm sample holder and a 2048 × 2048 matrix will result in 10 μm nominal voxel size (Table 1). This is a good value for mouse femur scanning. If you are scanning rat bone or do not need high spatial resolution, you can choose “Standard” or “Medium” resolution, both of which will double the voxel size, with the benefit of smaller image file size and faster image reconstruction time.
FOV/Diameter [mm]. Typically you should choose the size that matches the sample holder size. It is possible to choose a field-of-view FOV/Diameter that is larger than the sample holder size, although we rarely use this option. Choosing a smaller FOV is not allowable, as there must be air at the boundaries of the FOV.
Integration Time [ms]. Typical value for bone scanning is 300 ms. Choose a longer time to get improved signal-to-noise, or choose a shorter time to reduce scan acquisition time.
Average Data (Frame averaging). Values range from 1 to 10. Our default is 1. Choose a larger value to improve signal-to-noise, although scan time increases proportionately.
The Cortical/Diaphyseal region entails 50 slices above and 50 slices below the Mid-point (50% of length); total 100 slices = 1 mm (if 10 μm voxel size). The Cancellous/Trabecular/Metaphyseal region entails 600 slices = 6 mm (if 10 μm voxel size), starting from the distal (knee) end of the femur. The precise length of the cancellous scan region is not critical, as long as it includes enough slices for analysis and includes landmarks for defining the ROI.
Reference Lines/Scout View: By default the Scout View shows the entire sample holder (e.g., 80 mm). But the region of interest for each scan is usually much smaller than this. To zoom in, you can change the start and end position in Scout View window (Fig. 16b), which may allow for more precise positioning of reference lines.
Image acquisition and reconstruction. The system will create one. RSQ and one. ISQ file for each scan (measurement). The .RSQ contains the raw image data; the .ISQ contains the reconstructed image files that are used for analysis.
Contouring trabecular regions. This is a subjective process. New users should perform duplicate or triplicate analysis of a set of samples to check for intra-observer repeatability. We recommend that the same operator perform the trabecular analysis for all samples within an experiment. Training new users on a reference set of scans is recommended for producing consistent results within a lab.
Segmentation. The objective of segmentation is to partition the grayscale digital image into a binary image, with only two regions: “bone” and “not bone.” This is a critical step for accurately determining the 3D structure of your bones. Filtering and thresholding are part of the segmentation process.
Gaussian Filter. Generally, we recommend using a “Gauss Sigma” value of 0 and a “Gauss Support” value of 0. Another good combination is the Scanco default of Sigma = 0.5 and Support = 1. Adjust the settings if you need to reduce noise or minimize an artifact (e.g., ring artifact). Poor filter settings will yield a blurry image.
Thresholding. This is a critical step for accurately determining the 3D structure of your bones. It is important to check that the threshold value looks good for several different slices of a particular bone, and for several bones. Once you have chosen a good value for the study, we recommend you use the same threshold across all samples and groups. Because the grayscale values will differ between systems, and between scans done with different energy/intensity settings, it is important to confirm the threshold value for each study you do.
Histogram. To help select a threshold, you may display the histogram for the grayscale image; the histogram should display two peaks, a lower density one which is background voxels and a higher density one which is bone pixels; select a value at the midpoint between the two peaks as your threshold value.
Acquiring Quantitative Data. The quantitative data is displayed for the current bone and contours in the measurement. Advanced users may choose to draw contours for multiple bones and/or measurements before analyzing and collecting the results. Contours are stored as .GOBJ files in the order that they were defined and saved. Additional details for evaluating and saving data from multiple bones and measurements is beyond the scope of this chapter.
Bone Structural and Densitometric Indices. Quantitative analysis produces a number of metrics to describe the bone structure (a.k.a., morphology, geometry) and bone density. Next we describe the ones that are most relevant for cortical bone (Fig. 27a, seeNotes 25–30), and cancellous bone (Fig. 27b; seeNotes 31–35).
Total Area (TA, or Tt.Ar [mm2]): This value represents the total area: bone plus medullary areas (contained inside the green contour on the periosteal surface in Fig. 28a). It is a planar (2D) measure, computed as the average over the CT slices in the cortical region (Fig. 17). A larger total area usually correlates with a stiffer and stronger bone.
Bone Area (BA, or Ct.Ar [mm2]): This value represents the amount of the TA which is occupied by bone, calculated from the voxels that are above the lower threshold value (white region in Fig. 28a). A larger bone area usually correlates with a stiffer and stronger bone.
Medullary Area (MA, or Ma.Ar [mm2]): The amount of the TA not occupied by bone (black region inside the bone in Fig. 28a).
Cortical Thickness (Ct.Th [mm]): This represents the thickness of the cortical shell of bone calculated by applying the distance transformation (DT) method (sphere fitting) to the thresholded voxels [6, 7]. The output is an average cortical thickness. (To assess the variation in thickness, check the standard deviation (SD)). This parameter is often reported as measure of cortical bone mass. It reflects net bone resorption and formation activities on periosteal and endocortical surfaces.
Polar moment of inertia (pMOI [mm4]): Reflects the amount of bone and how it is distributed; wider bones have greater pMOI. We recommend reporting the polar moment of inertia as it is independent of the orientation of the bone in the scanner. Moments of inertia in specific directions (A-P and M-L) are sensitive to this orientation.
Tissue Mineral Density (TMD [mg HA/cm3]): (a.k.a., Mean2) The average of the mineral density of the bone voxels, that is, the voxels above the threshold (displayed in white in Fig. 28a). This calculation is independent of the amount of bone.
Bone Volume Fraction (BV/TV [dimensionless = mm3/mm3]): This is a simple ratio of bone volume (BV, the number of bone voxels in the ROI (white in Fig. 28b) multiplied by voxel volume) over total volume (TV, the total number of voxels in the analysis ROI (inside green contour in Fig. 28b) multiplied by voxel volume). It is a measure of the spatial density of bone (independent of bone mineral density) and is generally the single most important trabecular structural parameter.
Trabecular Thickness (Tb.Th [mm]). The average thickness (width) of the trabeculae within the ROI. Computed using the distance transformation method (DT), as the average diameter of spheres that “fit inside” the bone trabeculae. (As with Cortical Thickness (see Note 28), to assess the variability in trabecular thickness you can examine the SD value.)
Trabecular Separation (Tb.Sp [mm]). The average distance between the edges of adjacent trabeculae. Computed using the distance transformation method (DT), as the average diameter of spheres that “fit inside” the marrow spaces.
Trabecular Number (Tb.N [1/mm]). The average number of trabeculae per linear distance. Computed using the distance transformation method (DT), as the inverse of the average distance between the midlines of each adjacent trabecula.
Volumetric Bone Mineral Density (vBMD, or Mean1 [mg HA/cm3]: The average mineral density of all voxels inside the TV, including bone and nonbone voxels. (All voxels have an assigned mineral density value based on their grayscale, even if they are not mineralized.) This value is usually strongly correlated with BV/TV.
3D Display. By changing the Rotation and Elevation of the observer, you can change the orientation of the displayed object (Fig. 29). Also, you can change the effect of shading the object by adjusting the rotation and elevation of the light source. By using “Subdim,” you can crop the image and view a section inside the bone. Whenever you change any setting, click on the screen to update the image with changed settings.
DICOM Export. You can export your reconstructed image file (.ISQ) to DICOM files format for acquiring high quality visualization by third party image analysis software (e.g., Dragonfly, ImageJ). However, we recommend that users use the Scanco analysis software for bone microstructural analyses; in our experience, it is the most reliable and conforms with standards in the field of bone morphometry.
Weekly Calibration (QC1 scan). Perform weekly QC1 scan to ensure that the micro CT measures density correctly. By scanning a phantom block (Fig. 30) containing a range of known densities, it can be determined if the output of grayscale values from the instrument is consistent. If output values are not within acceptance range, contact SCANCO.
References
- 1.Bouxsein ML, Boyd SK, Christiansen BA, Guldberg RE, Jepsen KJ, Muller R (2010) Guidelines for assessment of bone microstructure in rodents using micro-computed tomography. J Bone Miner Res 25(7):1468–1486. 10.1002/jbmr.141 [DOI] [PubMed] [Google Scholar]
- 2.Alexander JM, Bab I, Fish S, Muller R, Uchiyama T, Gronowicz G, Nahounou M, Zhao Q, White DW, Chorev M, Gazit D, Rosenblatt M (2001) Human parathyroid hormone 1–34 reverses bone loss in ovariectomized mice. J Bone Miner Res 16(9):1665–1673. 10.1359/jbmr.2001.16.9.1665 [DOI] [PubMed] [Google Scholar]
- 3.Bonnet N, Laroche N, Vico L, Dolleans E, Courteix D, Benhamou CL (2009) Assessment of trabecular bone microarchitecture by two different x-ray microcomputed tomographs: a comparative study of the rat distal tibia using Skyscan and Scanco devices. Med Phys 36 (4):1286–1297. 10.1118/1.3096605 [DOI] [PubMed] [Google Scholar]
- 4.Christiansen BA (2016) Effect of microcomputed tomography voxel size and segmentation method on trabecular bone microstructure measures in mice. Bone Rep 5:136–140. 10.1016/j.bonr.2016.05.006 [DOI] [PMC free article] [PubMed] [Google Scholar]
- 5.Nazarian A, Snyder BD, Zurakowski D, Muller R (2008) Quantitative micro-computed tomography: a non-invasive method to assess equivalent bone mineral density. Bone 43 (2):302–311. 10.1016/j.bone.2008.04.009 [DOI] [PubMed] [Google Scholar]
- 6.Hildebrand T, Ruegsegger P (1997) A new method for the model-independent assessment of thickness in three-dimensional images. J Microsc 185(1):67–75. 10.1046/j.1365-2818.1997.1340694.x [DOI] [Google Scholar]
- 7.Hildebrand T, Laib A, Muller R, Dequeker J, Ruegsegger P (1999) Direct three-dimensional morphometric analysis of human cancellous bone: microstructural data from spine, femur, iliac crest, and calcaneus. J Bone Miner Res 14 (7):1167–1174. 10.1359/jbmr.1999.14.7.1167 [DOI] [PubMed] [Google Scholar]


