

Abstract
Metastasis is the main cause of death in individuals with cancer. Immune checkpoint blockade (ICB) can potentially reverse CD8+ cytotoxic T lymphocytes (CTLs) dysfunction, leading to significant remission in multiple cancers. However, the mechanism underlying the development of CTL exhaustion during metastatic progression remains unclear. Here, we established an experimental pulmonary metastasis model with melanoma cells and discovered a critical role for melanoma‐released exosomes in metastasis. Using genetic knockdown of nSMase2 and Rab27a, 2 key enzymes for exosome secretion, we showed that high levels of effector‐like tumor‐specific CD8+ T cells with transitory exhaustion, instead of terminal exhaustion, were observed in mice without exosomes; these cells showed limited inhibitory receptors and strong proliferation and cytotoxicity. Mechanistically, the immunosuppression of exosomes depends on exogenous PD‐L1, which can be largely rescued by pretreatment with antibody blockade. Notably, we also found that exosomal PD‐L1 acts as a promising predictive biomarker for ICB therapies during metastasis. Together, our findings suggest that exosomal PD‐L1 may be a potential immunotherapy target, suggesting a new curative therapy for tumor metastasis.
Keywords: exosomes, immune checkpoint blockade therapies, metastasis, predictive biomarker, tumor‐specific CD8+ T exhaustion
We demonstrate a crucial role for tumor‐released exosomes in promoting metastatic progression. We provide extensive evidence that exosomes from tumor cells act alone as contributors to driving tumor‐specific CD8+ T cell exhaustion in vivo. We also find that exosomal PD‐L1 acts as a promising predictive biomarker for ICB therapies during metastasis.
Abbreviations
- CFSE
carboxyfluorescein succinimidyl ester
- CTLs
cytotoxic T lymphocytes
- exo‐PDL1
exosomes carrying PD‐L1
- FCM
flow cytometry
- H&E
hematoxylin and eosin
- ICB
immune checkpoint blockade
- IFNs
interferons
- IL‐2
interleukin‐2
- KD
knocked down
- LLC
Lewis lung carcinoma
- metLNs
metastatic lymph nodes
- PD‐1
programmed cell death 1
- TCF‐1
T cell receptor 1
- TF
transcription factor
- TILs
tumor‐infiltrating lymphocytes
- TMB
tumor mutational burden
- TME
tumor microenvironment
- TNF
tumor necrosis factor
- Tregs
regulatory T cells
- WT B16
wild‐type B16.F10 cells
1. INTRODUCTION
Metastasis accounts for the majority of cancer‐related deaths and is a major obstacle for curative therapy.1 Research on metastasis has suggested that metastatic colonization has organ‐specific characteristics; for example, melanoma tends to migrate to the lung.2, 3 In fact, metastasis is an inefficient process, as most intravenously injected tumor cells that reach the lungs rapidly die.4 However, limited research has described how these disseminated tumor cells evade the immunologic defenses of the host after infiltration to the tissues.
CTLs play a critical role in the elimination of tumor cells. However, abundant CTLs become exhausted by persistent tumor antigen stimulation, which is characterized by high expression of inhibitory receptors, poor proliferative potential, loss of effector functions, and a distinct transcriptional and epigenetic program compared with that of effector or memory cells.5, 6, 7, 8, 9, 10, 11 Multiple inhibitory receptors, such as programmed cell death 1 (PD‐1),12 Tim‐3,13, 14 Lag‐3,15, 16 and TIGIT,17 are increased and sustained on exhausted CTLs and negatively regulate their activation and cytotoxicity. In addition, subsequent studies have shown that exhausted CD8+ T cells also lose the ability to produce effector cytokines, including IFNs, TNF, and interleukin‐2 (IL‐2).18, 19, 20, 21 Compared with effector CD8+ T cells, exhausted CD8+ T cells represent a distinct cell lineage, and the subsets were first distinguished by PD‐1 and CD44 markers, showing that PD‐1intCD44hi exhausted cells were less functionally exhausted than their PD‐1hiCD44int counterparts.22 Based on the expression of associated markers, such as PD‐1, CX3CR1, CD101, and the TF TCF‐1 (T cell receptor 1), recent studies have identified exhausted CD8+ T cells as distinct subpopulations of progenitor (or stem‐like), effector‐like transitory and terminally exhausted cells.23, 24 Furthermore, progenitor or transitory exhausted CD8+ T cells showed a better capacity to control tumor growth and can respond to ICB therapy, but terminally exhausted TILs cannot.25
The potential antitumor immune responses can be recovered by blocking these inhibitor receptor pathways. ICB therapy can indeed rescue exhausted CD8+ T cells, thereby resulting in tumor regression and a vertical shift in the survival curve of cancer patients.26, 27 Monoclonal antibodies that target CTLA‐4, PD‐1, and PD‐L1 have been approved for the treatment of multiple cancer types, such as non–small‐cell lung carcinoma, melanoma, head‐and‐neck cancer, and numerous other types of cancers.28 However, more than half of treated patients fail to respond to checkpoint blockade therapy; therefore, identification of predictive biomarkers for clinical efficacy is required. In addition to TMB, the balance of PD‐1 expression between CD8+ effector T cells and regulatory T cells (Tregs) in the tumor microenvironment (TME) is another potential predictive biomarker for successful treatment by ICB.29, 30
Exosomes are extracellular vesicles with a diameter of 30‐150 nm that act as important mediators in cell‐to‐cell interactions through their cargos, including proteins, DNA, and microRNAs.31 The secretion of exosomes relies on neutral sphingomyelinase 2 (nSMase2), which promotes budding of intravesicular vesicles, and RAB27A, which plays a critical role in multivesicular endosome docking at the plasma membrane.32, 33 Genetic manipulation or specific chemical inhibitors of these indispensable enzymes can lead to a significant reduction in exosomes. Previous studies have demonstrated that exosomes can be actively released through an exocytosis pathway in tumor conditions and modify lymphocyte activation.34, 35, 36 However, little information is known about the role of exosomes derived from tumor cells during metastatic progression. Experimental models have shown that tumor‐derived exosomes can induce vascular leakiness and inflammation to prepare a good microenvironment for invaded cancer cells with macrometastasis formation.37, 38 Recently, studies have shown that tumor cells release exosomes carrying PD‐L1 (exo‐PDL1), which can function as a systemic immunosuppressant in mice in vivo.39, 40, 41 In gastric cancer patients, higher levels of PDL1 carried by exosomes were correlated with decreased CD4+ and CD8+ T cell infiltration and a reduction in granzyme B (Gzmb).42 In addition, higher levels of exo‐PDL1 were found in patients with active disease and poorer survival.43
In this study, we discovered that increasing levels of melanoma cell‐released exosomes were detected during metastatic progression. By reducing exosomes through genetic knockdown of nSMase2 and Rab27a, we showed that exocytosis of exosomes promotes tumor growth by inducing tumor‐specific CD8+ T cell exhaustion. Furthermore, PD‐L1 is specifically secreted in the form of exosomes and mechanically mediates metastasis in the lung. Notably, exosomal PD‐L1 can act as a predictor biomarker for outcome within anti‐PD‐L1 blockade treatment in murine metastasis. These results have strong implications for immunotherapeutic approaches in cancer therapy.
2. MATERIALS AND METHODS
2.1. Mice
C57BL/6J and CD8−/− mice were purchased from the Jackson Laboratories. Approximately 6–10‐wk‐old mice of both sexes were engrafted with tumor cells without randomization or “blinding.” All mice were bred in pathogen‐free conditions. Mice dying for nonrelated cancer causes were excluded from the studies (ie, fights or infections). Mice were performed with the guidelines of the Institutional Animal Care and Use Committees at The HuaShan Hospital, Fudan University.
2.2. Tumor cell lines
Mouse melanoma B16 cells, B16‐luc cells (B16 stably transduced with firefly luciferase) and B16‐OVA cells (B16 cells stably expressing chicken OVA) were obtained from the ATCC.
Stable nSMase2 or Rab27a gene knockdown B16 cells (here referred to as B16nSMase2‐KD and B16Rab27a‐KD cells) and Rab27a gene knockdown B16‐OVA cells (here referred to as B16‐OVARab27a‐KD cells) were generated using lentivirus‐associated transfection. The shRNA sequence targeting mouse nSMase2 (GCCTCAGATCAAGATCTACAT), Rab27a (GCTTCTGTTCGACCTGACAAA) or scrambled shRNA‐control were packaged into lentiviral particles using 293T cells co‐transfected with the viral packaging plasmids. Lentiviral supernatants were harvested 48‐72 h after transfection. Tumor B16 cells and B16‐OVA cells were infected with filtered lentivirus and nSMase2 null and Rab27a null clones were selected by puromycin. All tumor cells were cultured in DMEM (Gibco) supplemented with 2 nmol/L l‐glutamine, 1 nmol/L penicillin/ streptomycin and 10% (v/v) FBS. All cell lines were tested routinely before use to exclude mycoplasma contamination.
2.3. Patients and specimen collection
Cancer patients information were provided in Table S1. Patients gave consent in writing for blood collection, and this study was approved by The Institutional Review Board of the HuaShan Hospital and was conducted in accordance with ethics guidelines. Peripheral blood from patients was obtained in sodium heparin tubes, then exosome was isolated in plasma in accordance with protocol seen as below. Blood samples from healthy donors were collected at The HuaShan Hospital after approval by the ethics committee and Institutional Review Board. Written consent was obtained from each healthy donor before blood collection.
2.4. Exosome isolation and in vitro label
For exosome isolation from cell culture supernatants, total melanoma cells from individual metastatic mice were selected and cultured in plate for 24 h. Cells were cultured in bovine exosome‐free medium (KSR, Gibco) to exclude contaminating proteins in the FBS. Exosome was purified by a standard differential centrifugation protocol.44 In brief, the culture medium was centrifuged at 2000 g for 20 min (Beckman Coulter, J2‐HS), followed by 10 000 g for 30 min to remove dead cells and dead debris. Supernatant was then centrifuged at 100 000 g for 90 min at 4°C (Beckman Coulter, Optima XPN‐100). The pelleted exosomes were suspended in PBS and collected by ultracentrifugation at 100 000 g for another 2 h.
For purification of exosome in plasma samples, peripheral blood from mouse or human (cancer patients and healthy donors) was centrifuged at 2000 g for 20 min to obtain cell‐free plasma. The obtained plasma was centrifuged at 10 000 g for 20 min at room temperature to remove debris. Exosomes were then purified from the supernatants using an exosome isolation kit (Thermo Fisher). The purified exosomes were intravenously injected (100 μg per time) to recipient mice.
To identify the physical interactions between tumor cell‐derived exosome and CD8+ T cells, the purified exosomes from lung metastasis mice were stained with CellTrace CFSE (Thermo Fisher) for 30 min at room temperature in the dark. The CFSE‐labeled exosomes were pelleted by ultracentrifugation after PBS washed. Total 1 × 10⁵ of CD8+ T cells purified from pulmonary lymph nodes (pLN) or lung tissues in tumor‐bearing mice were co‐culture with labeled or unlabeled (isotype control) exosomes (20 μg/mL) for 3 h, and test immunofluorescence level on CD8+ T cells using flow cytometry.
2.5. Experimental metastases
Pulmonary metastases were developed in accordance with a previous protocol.44 In brief, an inoculum dose of 4 × 10⁵ of melanoma cells in 0.5 mL PBS was injected intravenously through the tail vein. The number of lung nodules (black/opaque foci) was counted with the aid of a dissection microscope at the different indicated time. To ensure consistency, preparation of the cells, administration into the tail vein and counting of pulmonary metastatic foci were performed by the same individual. For histological analysis of micrometastatic lesions, lung tissues were fixed in buffered formalin and embed in paraffin for H&E stain. For primary tumor model development, recipient mice were injected with B16 cell suspension into the inguinal angle. Tumor cells are implanted at a dose of 5 × 10⁵ in RPMI medium. All subcutaneous and pulmonary tumor measurements were performed in a blinded manner. For stimulation with IFN‐γ in vivo, mice were treated with 100 ng/mL of recombinant mouse IFN‐γ (Peprotech) 3 times.
2.6. TILs isolation
To prepare cell suspensions in tumors, mice were intravenously injected with anti‐CD8 (APC‐Cy7, Biolegend) 2 μg per mouse before sacrifice to eliminate circulatory CD8+ T cells in the peripheral blood. The lungs were dissected out, and then washed quickly by cardiac perfusion with PBS. Then lungs were minced mechanically following digestion using type‐II collagenase (Sigma) for 30 min at 37°C. After this, TILs were harvested using a density gradient (2000 g, 40 min) with Percoll (GE Healthcare). Obtained cells were stained with anti‐CD8 (PercpCy5.5, BD Biosciences) and lung‐resident CD8+ T cells were referred to as PercpCy5.5 positive and APC‐Cy7 negative.
2.7. Adoptive transfer and treatment
For adoptive transfer of tumor‐specific (OT‐I, CD45.1+) cells, recipient mice were intravenously injected with B16‐OVA cells, on the next day a total of 5 × 10⁵ of splenic CD8+ T cells from wild‐type OT‐I transgenic mice were transferred to the recipient mice by injections into the tail vein. CD8+ T cells were purified using a mouse CD8+ T cell isolation kit (StemCell Technologies) in accordance with the manufacturer's protocol.
After OT‐I cells transfer, purified exosomes were pretreated with αPD‐L1 (50 μg, BioXCell) or isotype control antibody in vitro for 2 h and intravenously injected to recipient mice. Metastatic mice were intraperitoneally administrated with αPD‐L1 (200 μg, BioXCell) or rat IgG2b control antibody (200 μg, BioXCell) on days 6, 9, 12 for immunotherapy. For CD8+ T cell depletion in vivo, αCD8 (200 μg, BioXCell) was given to tumor‐bearing mice by intraperitoneal injection 5 times. To limit the secretion of exosome in vivo, an inhibitor of exosome, GW4869 (2.5 μg/g, MCE), was intraperitoneally injected with mice at days 6, 9, 12, and 15 for tumor inoculation.
2.8. Dot blot and western blot
Purified exosome samples from mice were spotted onto nitrocellulose membranes. The blots were blocked with 5% BSA at room temperature for 1 h, followed by incubation with 2 μg/mL anti‐CD63 antibodies (Abcam) for 30 min at room temperature. After washing, HRP‐conjugated secondary antibody (Cell Signaling Technology) was added and samples were incubated for another 1 h. The blots on the membranes were developed with ECL detection reagents (Thermo Fisher). For western blot analysis, whole cell lysates and/or purified exosomes were collected and were separated using SDS‐PAGE, and then samples were transferred onto nitrocellulose membranes. The blots were incubated with corresponding primary antibodies (anti‐CD63, anti‐PDL1) and secondary antibodies following the recommended protocol.
2.9. Flow cytometry analysis
For surface staining, cells were firstly stained with anti‐CD16/CD32 antibody (Thermo Fisher) on ice for 30 min, after washing twice with FACS (0.05% NaN3, 2% BSA in PBS), cells were stained with LIVE/DEAD dye (Thermo Fisher) and surface marker antibodies on ice for 30 min. For cytokine production test, lymphocytes were stimulated in the presence of the OVA257‐264 peptide and PMA, ionomycin (Sigma) supplemented with GolgiPlug (BD Biosciences) for 4 h at 37°C. The lymphocytes were then harvested followed by surface staining and intracellular cytokine staining with Cytofix/Cytoperm Fixation/permeabilization kit (BD Biosciences). Intracellular and intranuclear antibodies were incubated for 30 min at room temperature. Counting beads (Thermo Fisher) were added to the samples to determine the absolute number of cells. The following antibodies were used in experiments as listed: anti‐CD8α (PercpCy5.5, BD Biosciences), anti‐CD44 (BV510, Biolegend), anti‐CD45.1 (FITC, Biolegend), anti‐PD1 (BV421, Biolegend), anti‐Tim3 (PE, BD Biosciences), anti‐2B4 (FITC, BD Biosciences), anti‐Lag3 (PercpCy5.5, Thermo Fisher) anti‐Tigit (APC, BD Biosciences), anti‐IFN‐γ (BV421, BD Biosciences), anti‐TNFα (APC, BD Biosciences), anti‐Gzmb (PE, Thermo Fisher), anti‐CD101 (PE‐Cy7, Thermo Fisher), anti‐CX3CR1 (PE, Thermo Fisher), anti‐TCF‐1 (APC, Biolegend), anti‐KLRG1(PE, Thermo Fisher), anti‐Ki67(PE, Thermo Fisher), anti‐caspase3 (PE, BD Biosciences), anti‐CD146 (APC, Biolegend). Flow cytometry data were collected with a FACSCanto II (BD Biosciences) and analyzed using FlowJo software (TreeStar).
2.10. Quantitative reverse‐transcription PCR
Mice were injected with B16‐OVA cells or B16‐OVARab27a‐KD cells on day 0 and then were adoptively transfer with OT‐I cells on next day. The infiltrated OT‐I (CD45.1+ CD44+) cells were sorted on day 12 using a FACS Aria III (BD Biosciences). Total RNA was isolated from OT‐I cells using RNeasy Mini Kit (Qiagen), and reverse transcribed into first‐strand complementary DNA (cDNA) with a PrimeScript™ RT reagent kit (TaKaRa). Then, the samples were analyzed in the Applied Biosystems QuantStudio 3 Real‐Time PCR system (Thermo Fisher). Information on primers is listed in Table S2.
2.11. Luciferin
For detection of metastasis progression without sacrifice mice, recipient mice were intraperitoneally treated with 3 mg d‐luciferin K+ salt (Goldbio) before gaseous anesthesia. A luciferin image was obtained and analyzed using the IVIS LuminaII system (Xenogen).
2.12. ELISAs
For detection of exosome or exosome‐derived PDL1, 96‐well ELISA plates (Corning) were coated with exosome samples purified from culture media or plasma overnight at 4°C. To exclude non‐specific reactions, wells were blocked with blocking buffer (Thermo Fisher) for 2 h at room temperature. Next, monoclonal antibodies against CD63 (0.5 μg/well, Thermo Fisher) or PD‐L1 (0.2 μg/well, Cell Signaling Technology) were added to each well and incubated for 1.5 h at room temperature. Finally, plates were developed with HRP‐conjugated secondary antibodies (Cell Signaling Technology) and stopped with 0.5 N H2SO4. The concentration of exosome or PD‐L1 was calculated based on the linear range of the ELISA assay data.
2.13. Statistical analysis
For normally distributed data, significance of mean differences was determined using one‐way ANOVA or unpaired t tests. Pearson correlation was used to test for statistical significance. Survival data were measured using Kaplan‐Meier survival curves with the log rank test. Error bars shown in graphical data represent mean ± SD. A two‐tailed value of P < .05 was considered statistically significant. All statistical analyses were performed using GraphPad Prism v.8.0 software.
3. RESULTS
3.1. Tumor‐released exosomes are significantly enhanced in the late stage of metastasis
We established experimental pulmonary metastasis using intravenous injection of wild‐type B16.F10 (from this point forwards WT B16) mouse melanoma cells, as described by a previous study.45 Melanotic metastases were clearly observed on the lungs after 12 d of incubation. Increased numbers of black foci and larger sizes were observed after 20 d (Figure S1A). Increased levels of circulating exosomes in the mouse plasma were detected during metastatic progression (Figure S1B). To analyze the in vivo exosomes specifically secreted by tumor cells in metastasis, we selected Ter119−CD31−CD45−CD146+ melanoma cells using flow cytometry, followed by in vitro culture. Exosomes can be separated into other vesicles based on their density using gradient centrifugation. We enriched exosomes from the supernatant of the cell cultures and identified them by transmission electron microscopy (Figure 1A). Next, we investigated the accumulation of exosomes derived from melanoma cells in different periods of pulmonary metastasis. Analysis by ELISAs revealed that the level of exosomes was very low until day 12 but sharply increased in the late stage of metastasis (Figure 1B), indicating high exosome production due to increased metastases. Indeed, based on these data, receiver operating characteristic (ROC) curves showed that the level of tumor‐released exosomes positively correlated with tumor burden (Figure 1C). IFN‐γ is typically considered critical in the generation of an antitumor immune response in the TME.46 Therefore, we investigated whether additional IFN‐γ can enhance the tumor‐released exosomes. Isolated melanoma cells were administered recombinant IFN‐γ protein in vitro, followed by exosome enrichment and ELISAs. We found that the levels of exosomes were slightly increased following IFN‐γ treatment, indicating that tumor exosome secretion had a limited response to IFN‐γ (Figure 1D). Furthermore, a slight increase in the exosome level was detected in the plasma samples of metastatic mice upon IFN‐γ administration in vivo (Figure S1C); however, in comparison, we did not find significant systemic exosome release in the solid tumor model, even with IFN‐γ treatment (Figure S1C). These results showed that during metastatic progression, the level of exosomes secreted by melanoma cells was significantly higher in the late stage than the early stage, which was due in part to IFN‐γ.
FIGURE 1.
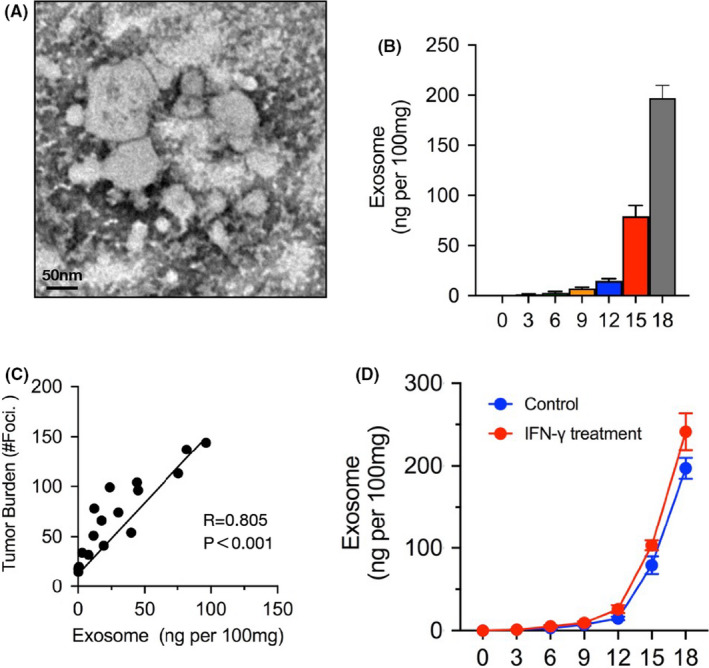
Melanoma‐released exosome is significantly increased as metastasis progression. To analysis the tumor‐released exosomes in metastasis, lung tissues were dissected out, digest, and then sorting melanoma cells for Ter119−CD31−CD45−CD146+ using flow cytometry. These cells were cultured in vitro for 24 h followed with exosome purification by gradient centrifugation. A, Electron microscopy images of purified exosomes. B, ELISA to measure the levels of exosome isolated from mice (n = 5) on days 0, 3, 6, 9, 12 15, or 18. The levels shown are ng per 100 mg weight of lung tissue. C, Pearson correlation between the exosome level and tumor burden (number of metastases foci) in mice (n = 20). D, Sorted melanoma cells were treated with or without IFN‐γ, and then the levels of exosome were measured by ELISA on different days. In (B) and (D), the experiments were performed at least twice with similar results. Error bars, SEM
3.2. Exosomes deficient in melanoma can lead to significant suppression of metastasis
We next sought to investigate the role of tumor‐released exosomes in metastatic progression. To address this question, we used a genetic approach to reduce exosomes in melanoma cells. The nSMase2 and Rab27 genes, critical factors that mediate exosome release, were KD (termed B16nSMase2‐KD and B16Rab27‐KD) using short hairpin (sh)RNA in B16 cells. Western blot analysis showed a dramatic decrease in endogenous CD63 expression on the exosomes purified from the B16nSMase2‐KD and B16Rab27‐KD cells (Figure 2A). Next, we used electron microscopy to further evaluate the effect of knockdown of these 2 target genes. The resultant image showed that very few exosome‐like particles existed in samples from both mutated B16 cells compared with the WT B16 cells (Figure 2B), indicating a critical role for these 2 genes in exosome biogenesis and secretion. Knockdown of the Rab27a and nSMase2 genes did not impair the proliferation of B16 cells (Figure S2A); furthermore, the engraftment ability of the 2 silenced B16 cell lines was the same as that of the WT B16 cell line, indicating comparable arrival of CFSE‐positive cells in the lung 2 h after tail vein administration (Figure 2C). Naive mice were intravenously injected with the WT, Rab27a‐KD, or nSMase2‐KD B16 cells on day 0. After 16 d, melanoma cells were sorted, and exosomes were enriched, followed by ELISAs. As shown in Figure 2D, a significant decrease in accumulation on exosomes was observed in the B16 knockdown cells compared with their WT counterparts. In addition, based on dot blot analysis, there was an obvious reduction in exosomes in the plasma samples from the mice injected with the B16nSMase2‐KD and B16Rab27‐KD cells (Figure S2B), suggesting that the majority of circulatory exosomes were derived from melanoma cells in murine metastasis. All mice injected with the WT B16 cells had severe metastatic formation in the lungs by approximately 16 d (Figure S2C); in contrast, the B16Rab27‐KD mice failed to form palpable tumor foci in the same time period (Figures 2E and S2C). To identify whether Rab27a deficiency can lead to inhibition of tumor growth through its role in exosome biogenesis, we repeated the experiments using the B16nSMase2‐KD cells. As expected, the mice injected with the B16nSMase2‐KD cells showed notably fewer metastases than their WT counterparts (Figures 2E and S2C).
FIGURE 2.
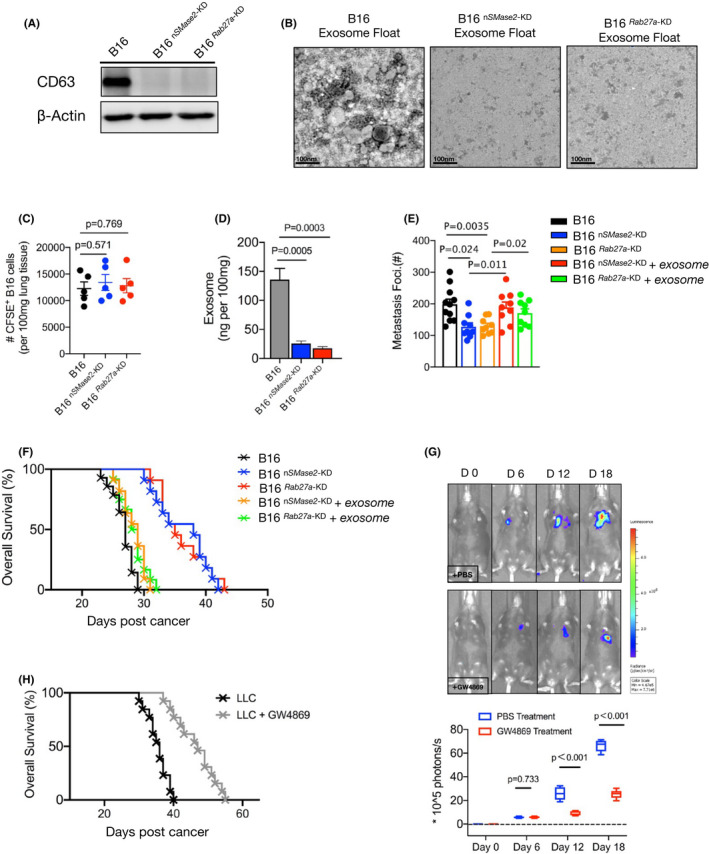
Tumor‐released exosome was critical promotor for metastasis. A, Western blot analysis of exosomes from WT, 2 mutated (Rab27a‐KD and nSMase2‐KD) B16 cells. B, Electron microscopy images of WT and Rab27a‐KD and nSMase2‐KD B16 cells, purified by gradient centrifugation. C, Number of CFSE‐labeled WT and Rab27a‐KD and nSMase2‐KD B16 cells present in the lungs of mice 2 h after administration. D, Melanoma cells were sorted from metastatic mice and were cultured in vitro, also shown as Figure 1. The levels of exosome purified from cultured supernatant were measured by ELISA (n = 4), shown as ng per 100 mg weight of lung tissue. E, WT B16 were injected with C57BL/6J mice, after 16‐18 d, exosomes were isolated from peripheral blood using an isolation kit. On days 6, 10, or 14, the purified exosomes were adoptively transferred to mice bearing knockdown B16 cells. The numbers of metastases foci of mice were counted under a dissection microscope on day 16. See also Figure S2C. F, Survival curve of control or metastatic mice treated with or without additional purified exosomes. WT vs Rab27a‐KD, P < .001; WT vs nSMase2‐KD, P < .001; WT vs Rab27a‐KD plus exosomes, P = .068; WT vs nSMase2‐KD plus exosomes, P = .062. log rank test was used. G, C57BL/6J mice were intravenously injected with B16‐luc cells. The inhibitor of exosome, GW4869, was performed as described in Materials and Methods from day 6 of tumor inoculation. Luciferin was administrated on days 0, 6, 12, and 18, and light emission was recorded. Representative bioluminescence images are shown; PBS, n = 7; GW4869, n = 9. Unpaired t test was used. H, Mouse survival curve following injection of LLC cells as in (F), control mice (n = 9) vs treated mice (n = 12), P < .001(log rank test). In (C‐E), one‐way ANOVA with Bonferroni correction was used. The experiments were performed at least twice with similar results. Error bars, SEM
Next, to verify whether exosomes influence metastatic progression, we injected the WT B16 cells into C57BL6/J mice. After 16‐18 d, circulatory exosomes were purified from the mouse plasma and then adoptively transferred to metastatic mice bearing silenced B16 cells. With additional exosomes, there was a dramatic increase in the number of metastatic foci in the recipient mice (Figures 2E and S2C), indicating a critical role for exosomes in promoting tumor metastasis. Notably, the majority of mice injected with the B16nSMase2‐KD and B16Rab27‐KD cells remained alive after 30 d, a significantly prolonged lifespan compared with that of their WT counterparts. However, these silenced B16‐bearing mice showed an obvious decrease in survival time after treatment with additional exosomes (Figure 2F). To confirm that loss of exosomes can suppress metastatic progression, we intravenously injected the mice with B16‐luc cells followed by administration of GW4869, a specific inhibitor for exosome secretion, in vivo beginning on day 6. Light emission was recorded in the mice to monitor metastatic formation over time. As shown in Figure 2G, the mice treated with GW4869 showed a substantially lower level of bioluminescence than the PBS control mice. The exosome inhibitor treatment was also repeated in a murine LLC model of metastasis. Similarly, the survival time of the GW4869‐treated mice was significantly extended, showing that nearly half of the recipient mice survived until 40 d. In contrast, all the control mice died before 40 d (Figure 2H). Indeed, based on H&E staining analysis, fewer metastatic foci were observed in the mice treated with GW4869 than in the control mice (Figure S2D). Taken together, these data demonstrated that blocking exosome biogenesis results in an obvious suppression of metastatic growth.
3.3. Melanoma‐released exosomes are critical promoters of tumor‐specific CD8+ T cell exhaustion
A recent study reported that exosome deficiency can control tumor growth through the immune response.39 Given that tumor‐infiltrating CD8+ T cells are considered the most important antitumor cell types, we investigated whether the effect of exosome deficiency relies on CD8+ T cells during metastatic progression. WT, Rab27a‐KD, or nSMase2‐KD B16 cells were intravenously injected into the CD8+ T cell‐depleted (CD8−/−) mice on day 0. On day 16, we found that all mice injected with B16 knockdown cells had comparable metastatic foci relative to those with the WT B16 cells (Figures 3A and S3A). Furthermore, the 3 groups of mice showed a similar survival rate (Figure 3B), indicating that loss of exosomes cannot prolong the mouse lifespan without CD8+ T cells. Similar effects were observed in the mice from which CD8+ T cells were depleted using an antibody against mouse CD8 (Figure S3B). These findings indicated that melanoma‐released exosomes promote tumor metastasis through the suppression of CD8+ T cells.
FIGURE 3.
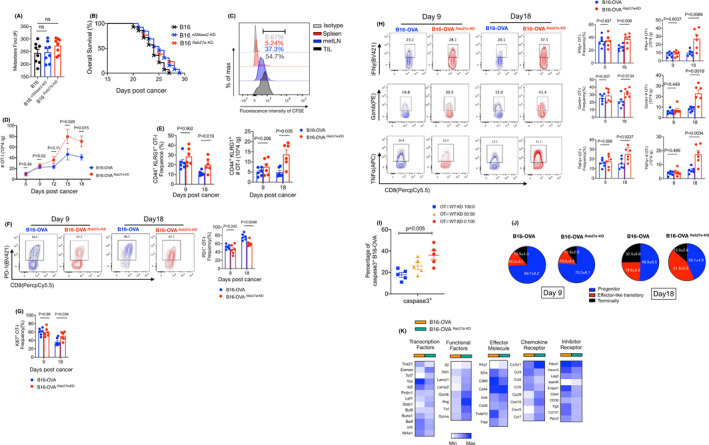
Exosomes derived from melanoma cells can induce tumor‐specific CD8+ T cell exhaustion. A, CD8−/− mice were injected with WT or Rab27a‐KD and nSMase2‐KD B16 cells. The numbers of metastases foci were counted on day 16, see Figure S3A. n = 8 for each group. One‐way ANOVA with Bonferroni correction was used. B, Survival curve of mice as shown in (A). WT vs Rab27a‐KD, P = .098; WT vs nSMase2‐KD, P = .104; log rank test was used. C, The fluorescence intensity of CFSE was measured in CD8+ T cells of spleen, metastatic lymph nodes (metLNs), and the tumor microenvironment (TME) by flow cytometry (FCM). For the schematic of experimental design see Figure S3C. D, In vivo underlying effect evaluation of the exosome in CD8+ T cells in a murine metastasis tumor model. C57BL/6J mice were intravenously injected with WT or Rab27a‐KD B16‐OVA cells following OT‐I cells adoptive transfer. The absolute numbers of OT‐I cells in TME were calculated on different days of tumor inoculation. E‐H, C57BL/6J mice were intravenously inoculated with WT or Rab27a‐KD B16‐OVA cells (4 × 10⁵) on day 0, and CD45.1+ OT‐I cells were adoptively transfer on the following day (n = 6 per group). On days 9 and 18, TILs were subjected to FCM. FCM quantification of percentage and absolute number of CD44+ KLRG1+ OT‐I cells (E); representative FCM staining (left) and summary (right) of PD‐1 expression by OT‐I cells (F); percentage of Ki67+ OT‐I cells (G); representative FCM staining (left) and summary (right) of granzyme B (Gzmb), tumor necrosis factor‐α (TNFα) and interferon‐γ (IFN‐γ) by OT‐I cells (H). I, OT‐I cells were sorted by FCM from mice, as described in (E), mixed with CFSE‐labeled B16‐OVA cells and adoptively transfer to CD8−/− mice. After 12 h, the levels of caspase3+ in tumor cells were measured by FCM. J, Pie chart of progenitor (TCF1+Tim3−CX3CR1−), effector‐like transitory (PD‐1+TCF1−CX3CR1+) and terminal (PD‐1+TCF1−CD101+) populations within OT‐I cells in TME in metastatic mice. K, Heatmap showing the differentially expressed genes of infiltrated CD44+ OT‐I cells derived from mice given WT or Rab27a‐KD B16‐OVA cells. The experiments were repeated at least twice with similar results. In (D‐H), an unpaired t test was used. Error bars, SEM
Exosomes carrying proteins can bind to the surface of target cells, thereby activating the downstream signaling pathway. We next wanted to determine whether exosome‐mediated immunosuppression is based on the direct interaction with the surface molecules of CD8+ T cells. We performed the experiment as shown in Figure S3C. The circulating exosomes were purified from the WT B16 cell‐bearing mice and labeled with CFSE. The CFSE‐labeled exosomes were then cocultured in vitro with CD8+ T cells isolated from the spleen, metastatic lymph nodes (metLNs) and TILs. Flow cytometry (FCM) analyses indicated that the fluorescence intensity of CFSE was detectable in TILs and metLNs but limited in splenic CD8+ T cells (Figure 3C). This finding suggests that exosomes can cause immunosuppression by directly binding to tumor‐infiltrated and/or lymph node CD8+ T cells during metastasis.
To precisely examine the effects of exosomes on tumor‐specific CD8+ T cells in the microenvironment of metastasis, we established a metastatic mouse model in C57BL/6 mice using WT B16‐OVA (B16 cells with the OVA peptide) and exosome‐mutated B16‐OVA cells in which Rab27a was specifically knocked down (termed B16‐OVARab27a ‐KD). The mice were adoptively transferred with CD45.1+ OT‐I cells (which specifically recognize the OVA peptide) for immunophenotyping analysis of TILs by FCM (Figure S3D). On day 15, significantly more OT‐I cells infiltrated the TME of the mice injected with B16‐OVARab27a ‐KD (Figure 3D), and a similar phenotype was also detected on day 18. In addition, we found that in the late stage, but not the early stage, of metastasis, activated OT‐I cells (identified as CD44+KLRG1+) showed a significantly higher frequency and absolute number in the B16‐OVARab27a ‐KD bearing mice. However, there was no significant difference in activated OT‐I cells in metLNs (Figures 3E and S3E).
In the TME, CD8+ T cells are prone to exhaustion, which is characterized by a reduced proliferative proportion, decreased effective cytokines, and upregulation of some inhibitory markers.47 We next evaluated the expression levels related to exhaustion and effector function on tumor‐specific CD8+ T cells. FCM analysis indicated that at 9 d post‐WT B16‐OVA incubation, approximately half of the TIL OT‐I cells were PD‐1 positive, which further increased to 80% on day 18 in the mice. However, the B16‐OVARab27a ‐KD‐bearing mice showed a much lower fraction of PD‐1+ OT‐I cells in the TME than the control mice (Figure 3F). Furthermore, the population of cells positive for the proliferative marker Ki67 was substantially higher among the OT‐I cells of the mice injected with Rab27a‐KD B16‐OVA than among their WT counterparts (Figure 3G). There was no difference in Bcl‐2 expression between these 2 populations of OT‐I cells (Figure S3F), indicating that exosomes can impair proliferation in vivo rather than antiapoptotic ability during metastasis. More importantly, deficiency of tumor‐released exosomes strongly promoted the cytotoxicity of cytokine production from OT‐I cells in the late stage of metastasis, as evidenced by the increased production of IFN‐γ, TNFα, and Gzmb in the B16‐OVARab27a ‐KD‐bearing mice (Figure 3H). This finding suggested that exosomes may impair the cytotoxic function of tumor‐specific CD8+ T cells against tumor cells. To verify this, we sorted these 2 groups of OT‐I cells from metastatic mice, mixed them with CFSE‐labeled WT B16‐OVA and adoptively transferred them to CD8−/− mice. In the mice that received OT‐I cells derived from the TME in the absence of exosomes, a significant increase in the number of tumor cells showing evidence of apoptosis was detected after 12 h (Figure 3I). These results suggested that the exhaustion of tumor‐specific CD8+ T cells in the TME of metastasis is important due to exosomes secreted by tumor cells, which limit proliferation and impair cytotoxicity‐cytokine production and killing function.
Recent studies have reported that exhausted CD8+ T cells can be differentiated into multiple subsets, mainly progenitor (or stem‐like), transitory and terminal cells, mediated by critical TFs, such as TCF1, Tox, and Eomes.23, 24, 25 We investigated whether tumor‐released exosomes can influence exhausted tumor‐specific CD8+ T cell differentiation in metastasis. Using FCM analysis, we divided tumor‐infiltrated OT‐I cells into TCF1+Tim3−CX3CR1− progenitor cells, PD‐1+TCF1−CX3CR1+ effector‐like transitory cells and PD‐1+TCF1−CD101+ terminal cells (whole cells were gated from CD44+ populations) (Figure S3G). We found that, in the early stage of metastasis, approximately 70% of OT‐I cells were progenitor cells, and only a few OT‐I cells developed transitory and terminal exhaustion states in the WT B16‐OVA‐bearing mice (Figure 3J). As metastasis progresses, a greater than 2‐fold increase in the fractions of terminally exhausted CD8+ T cells were generated, resulting in a reduction in progenitor cells. Conversely, in the late stage of metastasis, only approximately 15% of the terminally exhausted populations existed in total OT‐I cells, which was replaced by a much higher percentage of transitory cells in the B16‐OVARab27a ‐KD‐bearing mice (Figure 3J). This finding indicated that tumor‐released exosomes are a critical promoter of terminal exhaustion of tumor‐specific CD8+ T cells in metastasis. To further elucidate how the transcriptional states of these tumor‐specific CD8+ T cells were altered under exosome‐deficient conditions, we sorted the CD45.1+CD44+ OT‐I cells from the TME by FCM on day 16. Then, their genotypic expression was compared by real‐time qPCR analysis. As shown in Figure 3K, the OT‐I cells expressed higher levels of genes encoding exhaustion markers (Pdcd1, Havcr2, Entpd1, CD101, Tox) in the mice injected with WT B16; in contrast, the OT‐I cells showed higher transcript levels of genes encoding functional factors (Lamp1/2, Ifng, Tnf), effector molecules (klrg1, Icos) and survival/memory molecules (ccr7, Eomes) in the mice without exosomes. Taken together, these data are consistent with a degraded exhaustion and enhanced antitumor immune response of tumor‐specific CD8+ T cells in the absence of exosomes.
3.4. Exosomal PD‐L1 suppresses tumor‐specific CD8+ T cell function during metastasis
Inhibitor receptors are expressed at high and sustained levels on exhausted T cells and have deleterious effects on robust immune responses. The expression pattern of inhibitory receptors on CD8+ T cells during metastasis is still unclear. We measured multiple inhibitory receptors, including PD‐1, Tigit, Lag‐3, Tim‐3, and 2B4, expressed on tumor‐infiltrating CD8+ T cells of the metastatic mice bearing WT B16 cells. FCM analysis showed that approximately half of the CD8+ T cells expressed PD‐1 protein on day 12; notably, the level of PD‐1 was significantly higher than that of other inhibitory factors (Figure 4A). In addition, we found that exosomes derived from the WT B16 cells expressed exogenous PD‐L1, as shown by western blot analysis, although the level of PD‐L1 was substantially lower on both Rab27a‐KD and nSMase2‐KD B16 cells, suggesting that PD‐L1 is specifically secreted in the form of exosomes (Figure 4B). We next confirmed this finding in an experimental murine model of pulmonary metastasis in vivo. Plasma was collected from the mice for circulating exosome isolation and subsequent detection of PD‐L1 by ELISAs. The PD‐L1 level on circulating exosomes was significantly increased in the mice injected with WT B16 on days 12 and 18 (Figure 4C); however, the exosome‐deficient B16 cells failed to produce exosomal PD‐L1. Importantly, we collected plasma from patients with metastatic cancer cells and found significantly higher PD‐L1 protein levels in the patients than in the healthy donors (Figure 4D).
FIGURE 4.
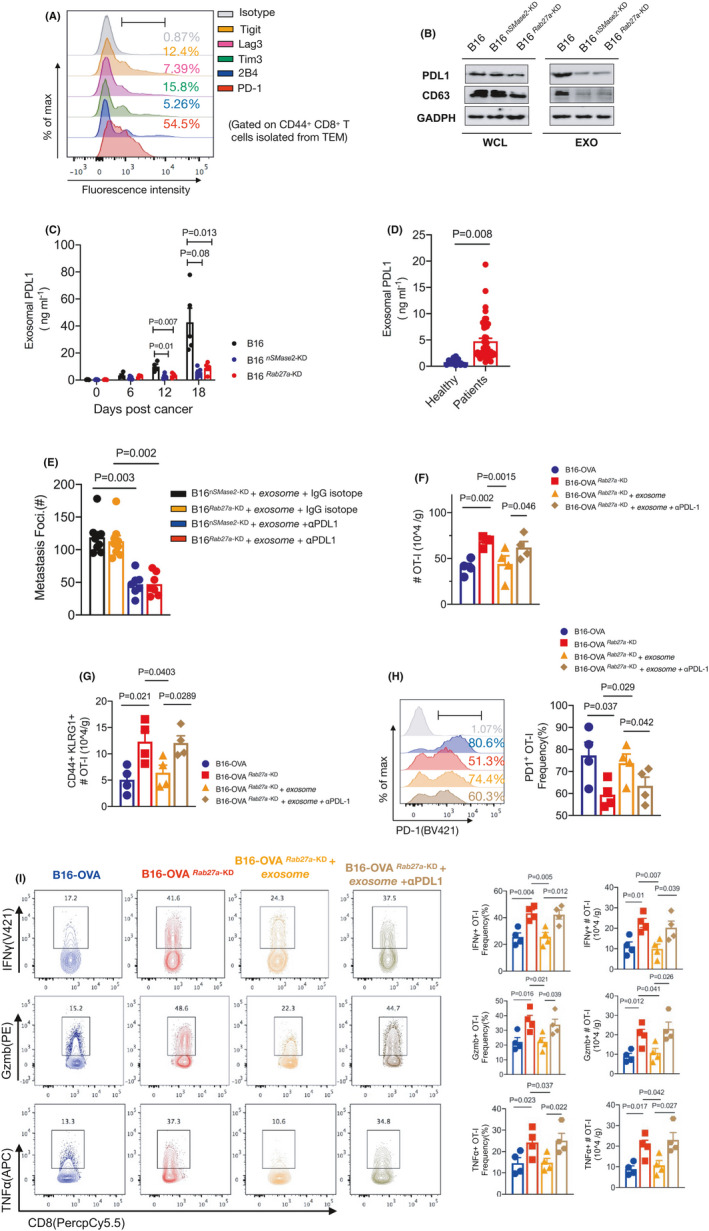
Exosomes drive tumor‐specific CD8+ T cell exhaustion through endogenous PD‐L1. A, Representative FCM staining for multiple inhibitor markers including Tigit, Lag‐3, 2B4, Tim‐3, PD‐1 on CD8+ T in TEM from B16 metastatic mice. B, Western blot analysis of CD63, PD‐L1 in the whole cell lysate (WCL) and purified exosomes (EOX) from WT, Rab27a‐KD, and nSMase2‐KD B16 cells. C, ELISA to measure the levels of exosomal PD‐L1 in plasma samples from metastatic mice (n = 5) on days 0, 6, 12, and 18. D, ELISA of PD‐L1 on exosomes in plasma samples from healthy people (n = 12) or patients with metastasis tumor (n = 47). Unpaired t test was used. E, Purified exosomes from tumor‐bearing mice were pretreated with isotype IgG or anti‐PD‐L1 antibodies (50 ng/well) in vitro, and then adoptively transfer to mice injected with nSMase2‐KD or Rab27a‐KD B16. A summary of metastases of mice on day 16 is shown. F‐I, C57BL/6J mice were intravenously inoculated with WT or Rab27a‐KD B16‐OVA cells (4 × 10⁵) on day 0, and CD45.1+ OT‐I cells were adoptively transfer on next day (n = 4 per group). On days 6, 9, 12, 15, pretreatment of purified exosomes as described in (E) and then administrated to mice in vivo. After 16 d, TILs were subjected to FCM. See also Figure S4B. FCM quantification of absolute numbers of total OT‐I (F) and CD44+KLRG1+ OT‐I (G); representative FCM staining (left) and summary (right) of PD‐1 expression by OT‐I T cells (H); representative FCM staining (left) and summary (right) of Gzmb, TNFα and IFN‐γ by OT‐I cells (I). The experiments were performed at least twice with similar results. In (C, E‐I), one‐way ANOVA with Bonferroni correction was used. Error bars, SEM
Given that exosomes can directly combine with surface molecules of cells, we hypothesized that exosomes exert immunosuppressive effects on CD8+ T cells by carrying PD‐L1, which targets PD‐1. The circulating exosomes from the WT B16 metastatic mice were purified followed by culture with an antibody against PD‐L1 or an isotype control in vitro for 2 h. Then, these pretreatment exosomes were transferred to mice that were administered B16 knockdown cells. We found that injection of circulating exosomes treated with an anti‐PD‐L1 blocking antibody, rather than with an IgG isotype, significantly prevented the formation of metastasis, showing a decrease in metastatic foci by half in the mice on day 16 (Figure 4E, Figure S4A). This finding indicated that exosomal PD‐L1 is a critical factor that promotes metastasis of melanoma cells. To examine the effects of exosomal PD‐L1 on tumor‐specific CD8+ T cells, we injected the B16‐OVARab27a ‐KD cells into mice following adoptive transfer of CD45.1+ OT‐I T cells; then, the mice were intravenously administered purified exosomes that were pretreated with the anti‐PD‐L1 antibody or isotype IgG in vitro before injection (Figure S4B). The mice injected with WT B16‐OVA tumor cells were used as controls. FCM analyses indicated that the absolute numbers of infiltrated OT‐I cells were significantly decreased in the mice receiving additional purified exosomes, whereas OT‐I cells showed an increasing trend after anti‐PD‐L1 pretreatment (Figure 4F). A similar cellular phenotype was also detected for the activated (CD44+ KLRG1+) OT‐I T cells, indicating a unique role of endogenous PD‐L1 in exosomes in the suppression of CD8+ T cells (Figure 4G). The exosomes also decreased the proportion of proliferating (Ki67+) OT‐I T cells during metastatic progression, which could be reversed by anti‐PD‐L1 antibody blockade (Figure S4C). The OT‐I cells from the control mice showed a deep exhausted state demonstrated by the very high levels of PD‐1 and the low levels of cytokine production, indicating significant remission induced by the exosome‐deficient B16 cells. Notably, exosome administration can largely re‐exhaust these tumor‐specific CD8+ T cells. However, pretreatment of circulating exosomes with PD‐L1 blockade resulted in an obvious decrease in PD‐1 levels; in addition to this finding, the percentages and absolute numbers of the IFN‐γ‐, TNFα‐, and Gzmb‐positive OT‐I cells were significantly increased compared with their isotype IgG counterparts (Figure 4H,I). These findings suggested that exosomes act through PD‐L1 to suppress tumor‐specific CD8+ T cell activation and cytotoxic functions in vivo, and this suppression can be rescued by anti‐PD‐L1 blockade.
3.5. Exosomal PD‐L1 acts as a potential biomarker for ICB therapy
Cancer immunotherapy involving ICB with PD‐1 or PD‐L1 monoclonal antibodies indeed rescued the dysfunction of cytotoxic effector CD8+ T cells, resulting in tumor regression and prolonged patient survival.26, 27, 28 We investigated whether metastatic mice can respond to ICB therapy. WT B16 cells were intravenously injected into WT mice following treatment with an anti‐PD‐L1 antibody. The number of metastatic foci in the mice was significantly lower after PD‐L1 blockade administration than that in the counterpart mice, suggesting that mice with pulmonary metastasis can respond well to ICB (Figure 5A). Notably, the level of circulating exosomal PD‐L1 positively correlated with the overall tumor burden, showing at least a 2‐fold lower level in the PD‐L1‐treated mice in the late stage of metastasis (Figure 5B).
FIGURE 5.
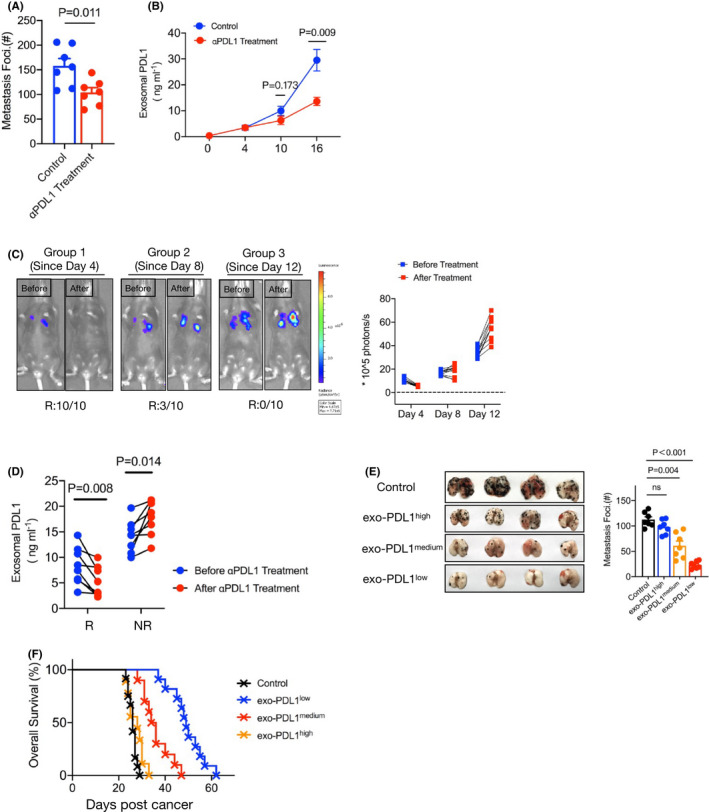
Exosomal PD‐L1 was a potential biomarker for predicting metastasis progression. A, C57BL/6J mice were treated with or without antibody targeted on PD‐L1 at 6, 9, and 12 d post‐WT B16 cells injection. A summary of metastases of mice is shown. n = 7 for each tumor group. B, Levels of PD‐L1 on exosomes in plasma samples of control or anti‐PD‐L1 antibody treatment mice, measured by ELISA. Unpaired t test was used in (A, B). Error bars, SEM. C, C57BL/6J mice were intravenously injected with B16‐luc cells on day 0. The anti‐PD‐L1 antibody was performed from day 4 (Group 1: on days 4, 7, 10), day 8 (Group 2: on days 8, 11, 14) or day 12 (Group 3: on days 12, 15, 17) of tumor inoculation. Luciferin was administrated on day 18, and light emission was recorded. Representative bioluminescence images are shown. The ratio of responder (R) or nonresponders (NR) for blockade was summary by bioluminescence intensity. n = 10 for each tumor group. D, Tumor‐bearing mice were treated with anti‐PD‐L1 antibody from day 8 (on days 8, 11, 14). ELISA to measure the levels of exosomal PD‐L1 in R and NR on day 7 and day 15 (paired t test). E, Images (left) and summary (right) of metastases of high (≥25 ng/mL), medium (between 5 and 25 ng/mL), and low PD‐L1 (≤5 ng/mL) on circulating exosomes. Each group of mice was administrated anti‐PD‐L1 blockade 3 times. One‐way ANOVA with Bonferroni correction was used. F, Mouse survival curve for high, medium, and low exosomal PD‐L1 of mice treated with anti‐PD‐L1 antibodies. Isotype antibody treatment mice served as the control. Control vs high, P = .874, Control vs medium, P = .004; Control vs low, P < .001(log rank test). The experiments were repeated at least twice with similar results
However, in the clinic, patients treated with PD‐1/PD‐L1 inhibitors showed significant individual differences. We next examined whether metastasis can be well controlled by ICB therapy among different periods of progression. Equal dosages of antibodies against PD‐L1 were administered to the mice 4, 8 and 12 d after WT B16 injection, which mimicked the early, middle, and late periods of therapy, respectively. The effective responses to therapy of the mice were confirmed by the levels of metastasis using bioluminescence analysis. We found that all mice that received early anti‐PD‐L1 treatment had a complete response (10/10), with fluorescence levels that tended to be low or even undetectable compared with those at the initial therapy. Furthermore, a partial response (3/10) was observed after treatment at the middle stage, whereas all mice failed to respond to anti‐PD‐1 treatment at the late stage of metastasis (0/10), showing stable tumors or progressive disease (Figure 5C). These data indicated that the efficiency of the response to ICB is largely dependent on the tumor burden in metastasis.
We next measured the level of circulating exosomal PD‐L1 by ELISAs in responder and nonresponder mice. As shown in Figure 5D and Figure S5A, the level of exosomal PD‐L1 was significantly reduced after treatment in the responder mice, although the nonresponders showed an increased level. Importantly, we found that the responder mice had relatively lower accumulation of exosomal PD‐L1 than the nonresponders. We then investigated whether circulating exosomal PD‐L1 acts as a potential biomarker for the prediction of the response rate to ICB therapy. Using ROC analysis (Figure S5B), we found a high ratio of response with a PD‐L1 level of ≤5 ng/mL in the exosomes (exo‐PD‐L1low), a low ratio of response with ≥5 ng/mL but ≤25 ng/mL (exo‐PD‐L1medium), and no response with ≥25 ng/mL (exo‐PD‐L1high). As expected, a high level of circulating exosomal PD‐L1 was associated with poorer outcomes in mice, whereas mice with a low level of exosomal PD‐L1 displayed a significantly better prognosis after therapy (Figures 5E,F and S5C). These results suggested that the level of circulating exosomal PD‐L1 prior to PD‐1/PD‐L1 blockade therapies appears to reflect a distinct state of antitumor immunity and may be an important predictive biomarker of ICB therapies.
4. DISCUSSION
Together, our results revealed a crucial role for exosomal PD‐L1 in enabling tumor‐specific CD8+ T cell exhaustion to promote metastatic progression. The role of tumor‐released exosomes in disease progression has been shown in multiple studies.48 Recent advances have demonstrated that exosomes are involved in tumor‐associated new blood vessel generation and the establishment of premetastatic niches, which promote tumor growth and invasion.49, 50, 51 However, further evidence has identified an immunosuppressive role for exosomes. For example, exosomes can inhibit the activation and function of multiple important lymphocytes, such as dendritic cells, natural killer (NK) cells, and CD8 T cells.52, 53, 54 However, the mechanisms underlying these immunosuppressive effects remain unclear. In this study, we present direct evidence showing that exosomes derived from melanoma cells specifically suppressed tumor‐specific CD8+ T cells in a PD‐L1‐dependent manner. PD‐L1 is well positioned to mediate PD1 crosslinking and immunosuppression in effector T cells by the recruitment of the tyrosine protein phosphatase SHP2 to the PD1 cytoplasmic domain, where it dephosphorylates proximal TCR and CD28 signals.55, 56 Genetically knocking down exosomes significantly decreased PD‐L1 expression in melanoma cells in vitro as well as in vivo; moreover, another possibility that causes the reduction of exosomal PDL1 in plasma is the decreased tumor‐released exosomes. In vivo, the injection of in vitro‐purified exosomes carrying PD‐L1 increased the levels of exhausted OT‐I cells and inhibited OT‐I cell activation, proliferation, and killing function, resulting in severe metastasis. However, the outcomes were reversed following pretreatment with αPD‐L1 antibody, suggesting that carrying PD‐L1 appears to be an important mechanism by which exosomes promote metastasis, at least in the B16 melanoma model.
IFN‐γ is an important component of the host in antitumor immunity. Accumulating evidence suggests that persistent IFN‐γ signaling can suppress CD8+ T cell activation by upregulated levels of PD‐L1 on the tumor cell surface, which causes “adaptive resistance” for the therapeutic outcome of checkpoint blockade.57, 58 A recent study demonstrated that after treatment with IFN‐γ, tumor cells can generate and present aberrant trans‐frame peptides at the cell surface,59 which suggested that immune stress can alter tumor cell heterogeneity. Therefore, we investigated whether IFN‐γ can induce B16 cells to secrete increased levels of exosomes. Interestingly, based on our analysis, there was only a marginal difference in the accumulation of exosomes after IFN‐γ treatment (Figure 1D), suggesting that exosomes are not sensitive to IFN‐γ.
In this study, we developed exosome‐null B16 cells by knocking down Rab27a and nSMNase2, which are 2 critical exosomal biogenesis genes. Deletion of both of these genes led to the loss of the majority of exosomes, which were detected by CD63 marker expression and electron microscopy. Notably, loss of exosomes reversed the severe metastasis in the lung and extended the survival of melanoma cell‐bearing mice. However, the phenotype was reversed by additional purified exosome treatment in vivo, strongly suggesting an important role for exosomes in promoting metastasis. In addition, this role for exosomes is not limited to the B16 melanoma model. Removal of exosomes using GW4869, a specific inhibitor of nSMNase2, in the LLC tumor model also significantly suppressed metastatic growth and prolonged mouse survival. Therefore, based on our findings, small molecule inhibitors targeting key enzymes, such as Rab27a and nSMNase2, or molecules presented at the exosome surface, such as PD‐L1, have the potential to act alone or in combination with current therapeutic strategies for cancer patients.
Notable regression of metastasis was detected in the WT mice, rather than the CD8+ T cell‐deficient mice, which were injected with exosome‐deficient B16 cells, indicating that the effect of exosomes relied on active CD8+ T cells. After in vitro culture, we found that melanoma cell‐released exosomes could directly combine on the surface of CD8+ T cells (Figure 3C). The level of recognition on TILs was higher than that in the metLNs and the spleen, which may be associated with the extent of inhibitory receptor expression in different organ‐sourced CD8+ T cells. In our study, we mainly focused on tumor‐specific CD8+ T cells, which are considered the major fraction that mediates antitumor immunity, although intratumoral CD4+ T cells have been shown to be important in killing autologous tumors and promoting CTL function60, 61 in recent studies. To elucidate how exosomes participate in the metastatic process through tumor‐specific CD8+ T cells, we used the OVA/OT‐I system. Our findings suggested that exosomes play an important role in inducing OT‐I cell exhaustion in the later but not in the early stage of metastasis. Nonetheless, there is no effect caused by exosome loss in metLNs, a critical pool of CTLs for antitumor therapy after immune therapy.62 This phenomenon may be caused by systemic dysfunction and plasticity of the immune macroenvironment in cancer models.63 Exhausted CD8+ T cells were first found in chronic inflection experiments using persistent antigen exposure and showed depletion of effector function.18, 21 In fact, exhaustion occurs early in the TME, and CD8+ T cell dysfunction is initially reversible but later irreversible.64 The mechanism involved in the initial development of CD8+ T cell exhaustion remain poorly understood. Previous studies have shown that CD8+ T cells primed during chronic infections can recover and differentiate into fully memory T cells if removed from persisting antigen stimulation early; however, longer exposure results in stable and irreversible exhaustion.65, 66, 67 Indeed, the duration of endogenous antigen exposure appears to contribute to driving CD8+ T cells exhaustion in cancer. Here, we provide extensive evidence that exosomes from tumor cells act as potential contributors to driving CD8+ T cell exhaustion in vivo.
Recent genomic profiling research has revealed the underlying transcriptional and epigenetic landscape of exhausted CD8+ T cells in cancer.68 Tox was reported as a critical TF for CD8+ T cell exhaustion69, 70, 71, 72, 73; moreover, multiple additional TFs, including NR4A1 (also known as Nur77)74, 75 and IFR4,76 can promote T cell exhaustion by modifying exhaustion‐specific genes. These genes encoding inhibitory receptors, TCR signaling pathways, and chemokines/chemokine receptors were significantly altered during T cell exhaustion.11, 77, 78 Importantly, after checkpoint blockade, the epigenetic landscapes of reinvigorated CD8+ T cells showed a relatively stable change.11, 79, 80 Here, we found that exosome deficiency in tumor cells indeed downregulated key TF‐mediated exhausted CD8+ T cell differentiation; for example, Tox was obviously expressed at lower levels. Similarly, CD39 (encoded by Entpd1) has been defined as a terminally exhausted molecule,81 similar to the majority of inhibitor receptors, showing a significantly decrease. In contrast, multiple genes encoding functional factors or effector molecules, including klrg1, ifng, Gzma/b, and Lamp1/2, showed a significant increase in the absence of exosomes. In other words, the presence of melanoma‐released exosomes can drive more severe exhaustion of tumor‐specific CD8+ T cells in metastasis. In chronic infection, the CD8+ T cells in the final stage of exhaustion retain a slightly better ability to kill targets82, 83; however, in a mouse model of cancer, progenitor and transitory exhausted populations, rather than terminally exhausted populations, play a critical role in controlling tumor growth and have the capacity to respond to checkpoint blockade.25 Here, according to our results, we showed that tumor cells drive more terminally exhausted CD8+ T cell development through exosome secretion, resulting in uncontrolled tumor progression. This phenomenon may explain why the mice injected with B16 cells with exosome loss showed a significantly longer survival time and regression of metastasis than the controls.
Immunotherapy, including checkpoint blockade, has shown striking results in clinical tumors resistant to traditional therapies, such as surgery, radiation, and chemotherapy.84, 85, 86, 87 An impressive outcome of immunotherapy for cancer is a significant extension of survival time. However, a larger population of patients cannot experience long‐term benefits. Patients may respond unpredictably to immunotherapy partly because of heterogeneity of the antitumor immune composition. Indeed, in this melanoma‐induced metastasis model, we found that if mice were treated with the anti‐PD‐L1 antibody in the early stage, they showed a substantially better outcome than their counterparts in the later stage. Several recent papers have suggested that exosomal PD‐L1 is a marker of poor outcome after surgery or chemotherapy and radiation in patients with gastric cancer and head‐and‐neck squamous cell carcinoma.43, 88 However, few studies have examined whether exosomal PD‐L1 is a predictive biomarker for the response to immunotherapy in patients with metastasis. Here, we found that exosomal PD‐L1 sharply decreased in responders to ICB, and importantly, the level of exosomal PD‐L1 may reflect the phenotypic profiles of TILs, which determine patients who are more likely to respond to therapy. Therefore, measuring the level of exosomal PD‐L1 in metastatic patient blood samples is a potential strategy for predicting the outcome of immunotherapy.
In summary, we showed that melanoma cell‐released exosomes play an immunosuppressive role through endogenous PD‐L1 to induce tumor‐specific CD8+ T cell exhaustion, resulting in the promotion of metastatic progression.
DISCLOSURE
The authors declare no conflicts of interest.
Supporting information
Figure S1
Figure S2
Figure S3
Figure S4
Figure S5
Table S1
Table S2
ACKNOWLEDGMENTS
This work was supported by the Science Foundation of Shanghai Science and Technology Commission, 201540044; Science Foundation of Shanghai Health Commission, 20204Y0484. The authors have no other relevant affiliations or financial involvement with any organization or entity with a financial interest in or financial conflict with the subject matter or materials discussed in the manuscript apart from those disclosed.
Chen J, Song Y, Miao F, et al. PDL1‐positive exosomes suppress antitumor immunity by inducing tumor‐specific CD8+ T cell exhaustion during metastasis. Cancer Sci. 2021;112:3437–3454. 10.1111/cas.15033
Ji Chen and Yang Song contributed equally to this work.
Contributor Information
Zhiming Chen, Email: chzm_md@163.com.
Xiaofeng Chen, Email: Dr_chenxiaofeng@126.com.
REFERENCES
- 1.Valastyan S, Weinberg RA. Tumor metastasis: molecular insights and evolving paradigms. Cell. 2011;147:275‐292. [DOI] [PMC free article] [PubMed] [Google Scholar]
- 2.Minn AJ, Gupta GP, Siegel PM, et al. Genes that mediate breast cancer metastasis to lung. Nature. 2005;436:518‐524. [DOI] [PMC free article] [PubMed] [Google Scholar]
- 3.Obenauf AC, Massague J. Surviving at a distance: organ‐specific metastasis. Trends Cancer. 2015;1:76‐91. [DOI] [PMC free article] [PubMed] [Google Scholar]
- 4.Wong CW, Lee A, Shientag L, et al. Apoptosis: an early event in metastatic inefficiency. Cancer Res. 2001;61:333‐338. [PubMed] [Google Scholar]
- 5.Simoni Y, Becht E, Fehlings M, et al. Bystander CD8(+) T cells are abundant and phenotypically distinct in human tumour infiltrates. Nature. 2018;557:575‐579. [DOI] [PubMed] [Google Scholar]
- 6.Li H, van der Leun AM, Yofe I, et al. Dysfunctional CD8 T cells form a proliferative, dynamically regulated compartment within human melanoma. Cell. 2019;176:775‐789.e18. [DOI] [PMC free article] [PubMed] [Google Scholar]
- 7.Baitsch L, Baumgaertner P, Devêvre E, et al. Exhaustion of tumor‐specific CD8(+) T cells in metastases from melanoma patients. J Clin Invest. 2011;121:2350‐2360. [DOI] [PMC free article] [PubMed] [Google Scholar]
- 8.Ahmadzadeh M, Johnson LA, Heemskerk B, et al. Tumor antigen‐specific CD8 T cells infiltrating the tumor express high levels of PD‐1 and are functionally impaired. Blood. 2009;114:1537‐1544. [DOI] [PMC free article] [PubMed] [Google Scholar]
- 9.Riches JC, Davies JK, McClanahan F, et al. T cells from CLL patients exhibit features of T‐cell exhaustion but retain capacity for cytokine production. Blood. 2013;121:1612‐1621. [DOI] [PMC free article] [PubMed] [Google Scholar]
- 10.Radoja S, Saio M, Schaer D, Koneru M, Vukmanovic S, Frey AB. CD8(+) tumor‐infiltrating T cells are deficient in perforin‐mediated cytolytic activity due to defective microtubule‐organizing center mobilization and lytic granule exocytosis. J Immunol. 2001;167:5042‐5051. [DOI] [PubMed] [Google Scholar]
- 11.Sen DR, Kaminski J, Barnitz RA, et al. The epigenetic landscape of T cell exhaustion. Science. 2016;354:1165‐1169. [DOI] [PMC free article] [PubMed] [Google Scholar]
- 12.Iwai Y, Ishida M, Tanaka Y, Okazaki T, Honjo T, Minato N. Involvement of PD‐L1 on tumor cells in the escape from host immune system and tumor immunotherapy by PD‐L1 blockade. Proc Natl Acad Sci U S A. 2002;99:12293‐12297. [DOI] [PMC free article] [PubMed] [Google Scholar]
- 13.Jin H‐T, Anderson AC, Tan WG, et al. Cooperation of Tim‐3 and PD‐1 in CD8 T‐cell exhaustion during chronic viral infection. Proc Natl Acad Sci U S A. 2010;107:14733‐14738. [DOI] [PMC free article] [PubMed] [Google Scholar]
- 14.Golden‐Mason L, Palmer BE, Kassam N, et al. Negative immune regulator Tim‐3 is overexpressed on T cells in hepatitis C virus infection and its blockade rescues dysfunctional CD4+ and CD8+ T cells. J Virol. 2009;83:9122‐9130. [DOI] [PMC free article] [PubMed] [Google Scholar]
- 15.Workman CJ, Dugger KJ, Vignali DA. Cutting edge: molecular analysis of the negative regulatory function of lymphocyte activation gene‐3. J Immunol. 2002;169:5392‐5395. [DOI] [PubMed] [Google Scholar]
- 16.Matsuzaki J, Gnjatic S, Mhawech‐Fauceglia P, et al. Tumor‐infiltrating NY‐ESO‐1‐specific CD8+ T cells are negatively regulated by LAG‐3 and PD‐1 in human ovarian cancer. Proc Natl Acad Sci U S A. 2010;107:7875‐7880. [DOI] [PMC free article] [PubMed] [Google Scholar]
- 17.Johnston R, Comps‐Agrar L, Hackney J, et al. The immunoreceptor TIGIT regulates antitumor and antiviral CD8(+) T cell effector function. Cancer Cell. 2014;26:923‐937. [DOI] [PubMed] [Google Scholar]
- 18.Zajac AJ, Blattman JN, Murali‐Krishna K, et al. Viral immune evasion due to persistence of activated T cells without effector function. J Exp Med. 1998;188:2205‐2213. [DOI] [PMC free article] [PubMed] [Google Scholar]
- 19.Gallimore A, Glithero A, Godkin A, et al. Induction and exhaustion of lymphocytic choriomeningitis virus‐specific cytotoxic T lymphocytes visualized using soluble tetrameric major histocompatibility complex class I‐peptide complexes. J Exp Med. 1998;187:1383‐1393. [DOI] [PMC free article] [PubMed] [Google Scholar]
- 20.Fuller MJ, Zajac AJ. Ablation of CD8 and CD4 T cell responses by high viral loads. J Immunol. 2003;170:477‐486. [DOI] [PubMed] [Google Scholar]
- 21.Wherry EJ, Blattman JN, Murali‐Krishna K, van der Most R , Ahmed R. Viral persistence alters CD8 T‐cell immunodominance and tissue distribution and results in distinct stages of functional impairment. J Virol. 2003;77:4911‐4927. [DOI] [PMC free article] [PubMed] [Google Scholar]
- 22.Blackburn SD, Shin H, Haining WN, et al. Coregulation of CD8+ T cell exhaustion by multiple inhibitory receptors during chronic viral infection. Nat Immunol. 2009;10:29‐37. [DOI] [PMC free article] [PubMed] [Google Scholar]
- 23.Hudson WH, Gensheimer J, Hashimoto M, et al. Proliferating transitory T Cells with an effector‐like transcriptional signature emerge from PD‐1(+) stem‐like CD8(+) T Cells during chronic infection. Immunity. 2019;51:1043‐1058.e4. [DOI] [PMC free article] [PubMed] [Google Scholar]
- 24.Beltra J‐C, Manne S, Abdel‐Hakeem MS, et al. Developmental relationships of four exhausted CD8(+) T Cell subsets reveals underlying transcriptional and epigenetic landscape control mechanisms. Immunity. 2020;52:825‐841.e8. [DOI] [PMC free article] [PubMed] [Google Scholar]
- 25.Miller BC, Sen DR, Al Abosy R, et al. Subsets of exhausted CD8(+) T cells differentially mediate tumor control and respond to checkpoint blockade. Nat Immunol. 2019;20:326‐336. [DOI] [PMC free article] [PubMed] [Google Scholar]
- 26.Zou W, Wolchok JD, Chen L. PD‐L1 (B7–H1) and PD‐1 pathway blockade for cancer therapy: mechanisms, response biomarkers, and combinations. Sci Transl Med. 2016;8:328rv4. [DOI] [PMC free article] [PubMed] [Google Scholar]
- 27.Dong H, Strome SE, Salomao DR, et al. Tumor‐associated B7–H1 promotes T‐cell apoptosis: a potential mechanism of immune evasion. Nat Med. 2002;8:793‐800. [DOI] [PubMed] [Google Scholar]
- 28.Topalian SL, Hodi FS, Brahmer JR, et al. Safety, activity, and immune correlates of anti‐PD‐1 antibody in cancer. N Engl J Med. 2012;366:2443‐2454. [DOI] [PMC free article] [PubMed] [Google Scholar]
- 29.Kumagai S, Togashi Y, Kamada T, et al. The PD‐1 expression balance between effector and regulatory T cells predicts the clinical efficacy of PD‐1 blockade therapies. Nat Immunol. 2020;21:1346‐1358. [DOI] [PubMed] [Google Scholar]
- 30.Rizvi NA, Hellmann MD, Snyder A, et al. Cancer immunology. Mutational landscape determines sensitivity to PD‐1 blockade in non‐small cell lung cancer. Science. 2015;348:124‐128. [DOI] [PMC free article] [PubMed] [Google Scholar]
- 31.Ela S, Mager I, Breakefield XO, Wood MJ. Extracellular vesicles: biology and emerging therapeutic opportunities. Nat Rev Drug Discov. 2013;12:347‐357. [DOI] [PubMed] [Google Scholar]
- 32.Kosaka N, Iguchi H, Yoshioka Y, Takeshita F, Matsuki Y, Ochiya T. Secretory mechanisms and intercellular transfer of microRNAs in living cells. J Biol Chem. 2010;285:17442‐17452. [DOI] [PMC free article] [PubMed] [Google Scholar]
- 33.Ostrowski M, Carmo NB, Krumeich S, et al. Rab27a and Rab27b control different steps of the exosome secretion pathway. Nat Cell Biol. 2010;12(1):19‐30. [DOI] [PubMed] [Google Scholar]
- 34.Clayton A, Mitchell JP, Court J, Mason MD, Tabi Z. Human tumor‐derived exosomes selectively impair lymphocyte responses to interleukin‐2. Cancer Res. 2007;67:7458‐7466. [DOI] [PubMed] [Google Scholar]
- 35.Huber V, Fais S, Iero M, et al. Human colorectal cancer cells induce T‐cell death through release of proapoptotic microvesicles: role in immune escape. Gastroenterology. 2005;128:1796‐1804. [DOI] [PubMed] [Google Scholar]
- 36.Valenti R, Huber V, Filipazzi P, et al. Human tumor‐released microvesicles promote the differentiation of myeloid cells with transforming growth factor‐beta‐mediated suppressive activity on T lymphocytes. Cancer Res. 2006;66:9290‐9298. [DOI] [PubMed] [Google Scholar]
- 37.Hoshino A, Costa‐Silva B, Shen T‐L, et al. Tumour exosome integrins determine organotropic metastasis. Nature. 2015;527:329‐335. [DOI] [PMC free article] [PubMed] [Google Scholar]
- 38.Peinado H, Alečković M, Lavotshkin S, et al. Melanoma exosomes educate bone marrow progenitor cells toward a pro‐metastatic phenotype through MET. Nat Med. 2012;18:883‐891. [DOI] [PMC free article] [PubMed] [Google Scholar]
- 39.Poggio M, Hu T, Pai C‐C, et al. Suppression of exosomal PD‐L1 Induces Systemic Anti‐Tumor Immunity And Memory. Cell. 2019;177:414‐427.e13. [DOI] [PMC free article] [PubMed] [Google Scholar]
- 40.Chen G, Huang AC, Zhang W, et al. Exosomal PD‐L1 contributes to immunosuppression and is associated with anti‐PD‐1 response. Nature. 2018;560:382‐386. [DOI] [PMC free article] [PubMed] [Google Scholar]
- 41.Daassi D, Mahoney KM, Freeman GJ. The importance of exosomal PDL1 in tumour immune evasion. Nat Rev Immunol. 2020;20:209‐215. [DOI] [PubMed] [Google Scholar]
- 42.Ricklefs FL, Alayo Q, Krenzlin H, et al. Immune evasion mediated by PD‐L1 on glioblastoma‐derived extracellular vesicles. Sci Adv. 2018;4:eaar2766. [DOI] [PMC free article] [PubMed] [Google Scholar]
- 43.Theodoraki MN, Yerneni SS, Hoffmann TK, Gooding WE, Whiteside TL. Clinical significance of PD‐L1(+) exosomes in plasma of head and neck cancer patients. Clin Cancer Res. 2018;24:896‐905. [DOI] [PMC free article] [PubMed] [Google Scholar]
- 44.Thery C, Amigorena S, Raposo G, Clayton A. Isolation and characterization of exosomes from cell culture supernatants and biological fluids. Current Protocols in Cell Biology. 2006;30(1):Chapter 3: Unit 3 22. [DOI] [PubMed] [Google Scholar]
- 45.Giavazzi R, Decio A. Syngeneic murine metastasis models: B16 melanoma. Methods Mol Biol. 2014;1070:131‐140. [DOI] [PubMed] [Google Scholar]
- 46.Mittal D, Gubin MM, Schreiber RD, Smyth MJ. New insights into cancer immunoediting and its three component phases–elimination, equilibrium and escape. Curr Opin Immunol. 2014;27:16‐25. [DOI] [PMC free article] [PubMed] [Google Scholar]
- 47.McLane LM, Abdel‐Hakeem MS, Wherry EJ. CD8 T Cell exhaustion during chronic viral infection and cancer. Annu Rev Immunol. 2019;37:457‐495. [DOI] [PubMed] [Google Scholar]
- 48.Iero M, Valenti R, Huber V, et al. Tumour‐released exosomes and their implications in cancer immunity. Cell Death Differ. 2008;15:80‐88. [DOI] [PubMed] [Google Scholar]
- 49.Guo Y, Ji X, Liu J, et al. Effects of exosomes on pre‐metastatic niche formation in tumors. Mol Cancer. 2019;18:39. [DOI] [PMC free article] [PubMed] [Google Scholar]
- 50.Vaksman O, Trope C, Davidson B, Reich R. Exosome‐derived miRNAs and ovarian carcinoma progression. Carcinogenesis. 2014;35:2113‐2120. [DOI] [PubMed] [Google Scholar]
- 51.Mears R, Craven RA, Hanrahan S, et al. Proteomic analysis of melanoma‐derived exosomes by two‐dimensional polyacrylamide gel electrophoresis and mass spectrometry. Proteomics. 2004;4:4019‐4031. [DOI] [PubMed] [Google Scholar]
- 52.Abusamra AJ, Zhong Z, Zheng X, et al. Tumor exosomes expressing Fas ligand mediate CD8+ T‐cell apoptosis. Blood Cells Mol Dis. 2005;35:169‐173. [DOI] [PubMed] [Google Scholar]
- 53.Liu C, Yu S, Zinn K, et al. Murine mammary carcinoma exosomes promote tumor growth by suppression of NK cell function. J Immunol. 2006;176:1375‐1385. [DOI] [PubMed] [Google Scholar]
- 54.Yu S, Liu C, Su K, et al. Tumor exosomes inhibit differentiation of bone marrow dendritic cells. J Immunol. 2007;178:6867‐6875. [DOI] [PubMed] [Google Scholar]
- 55.Yokosuka T, Takamatsu M, Kobayashi‐Imanishi W, Hashimoto‐Tane A, Azuma M, Saito T. Programmed cell death 1 forms negative costimulatory microclusters that directly inhibit T cell receptor signaling by recruiting phosphatase SHP2. J Exp Med. 2012;209:1201‐1217. [DOI] [PMC free article] [PubMed] [Google Scholar]
- 56.Hui E, Cheung J, Zhu J, et al. T cell costimulatory receptor CD28 is a primary target for PD‐1‐mediated inhibition. Science. 2017;355:1428‐1433. [DOI] [PMC free article] [PubMed] [Google Scholar]
- 57.Spranger S, Spaapen RM, Zha Y, et al. Up‐regulation of PD‐L1, IDO, and T(regs) in the melanoma tumor microenvironment is driven by CD8(+) T cells. Sci Transl Med. 2013;5:200ra116. [DOI] [PMC free article] [PubMed] [Google Scholar]
- 58.Taube JM, Anders RA, Young GD, et al. Colocalization of inflammatory response with B7–h1 expression in human melanocytic lesions supports an adaptive resistance mechanism of immune escape. Sci Transl Med. 2012;4:127ra37. [DOI] [PMC free article] [PubMed] [Google Scholar]
- 59.Bartok O, Pataskar A, Nagel R, et al. Anti‐tumour immunity induces aberrant peptide presentation in melanoma. Nature. 2021;590(7845):332‐337. [DOI] [PubMed] [Google Scholar]
- 60.Ahrends T, Spanjaard A, Pilzecker B, et al. CD4(+) T Cell help confers a cytotoxic T Cell effector program including coinhibitory receptor downregulation and increased tissue invasiveness. Immunity. 2017;47:848‐861.e5. [DOI] [PubMed] [Google Scholar]
- 61.Oh DY, Kwek SS, Raju SS, et al. Intratumoral CD4(+) T Cells mediate anti‐tumor cytotoxicity in human bladder cancer. Cell. 2020;181:1612‐1625.e13. [DOI] [PMC free article] [PubMed] [Google Scholar]
- 62.Dammeijer F, van Gulijk M , Mulder EE, et al. The PD‐1/PD‐L1‐checkpoint restrains T cell immunity in tumor‐draining lymph nodes. Cancer Cell. 2020;38:685‐700.e8. [DOI] [PubMed] [Google Scholar]
- 63.Allen BM, Hiam KJ, Burnett CE, et al. Systemic dysfunction and plasticity of the immune macroenvironment in cancer models. Nat Med. 2020;26:1125‐1134. [DOI] [PMC free article] [PubMed] [Google Scholar]
- 64.Schietinger A, Philip M, Krisnawan VE, et al. Tumor‐specific T Cell dysfunction is a dynamic antigen‐driven differentiation program initiated early during tumorigenesis. Immunity. 2016;45:389‐401. [DOI] [PMC free article] [PubMed] [Google Scholar]
- 65.Utzschneider DT, Charmoy M, Chennupati V, et al. T Cell Factor 1‐expressing memory‐like CD8(+) T Cells sustain the immune response to chronic viral infections. Immunity. 2016;45:415‐427. [DOI] [PubMed] [Google Scholar]
- 66.Brooks DG, McGavern DB, Oldstone MB. Reprogramming of antiviral T cells prevents inactivation and restores T cell activity during persistent viral infection. J Clin Invest. 2006;116:1675‐1685. [DOI] [PMC free article] [PubMed] [Google Scholar]
- 67.Angelosanto JM, Blackburn SD, Crawford A, Wherry EJ. Progressive loss of memory T cell potential and commitment to exhaustion during chronic viral infection. J Virol. 2012;86:8161‐8170. [DOI] [PMC free article] [PubMed] [Google Scholar]
- 68.Tirosh I, Izar B, Prakadan SM, et al. Dissecting the multicellular ecosystem of metastatic melanoma by single‐cell RNA‐seq. Science. 2016;352:189‐196. [DOI] [PMC free article] [PubMed] [Google Scholar]
- 69.Khan O, Giles JR, McDonald S, et al. TOX transcriptionally and epigenetically programs CD8(+) T cell exhaustion. Nature. 2019;571:211‐218. [DOI] [PMC free article] [PubMed] [Google Scholar]
- 70.Wang X, He Q, Shen H, et al. TOX promotes the exhaustion of antitumor CD8(+) T cells by preventing PD1 degradation in hepatocellular carcinoma. J Hepatol. 2019;71:731‐741. [DOI] [PubMed] [Google Scholar]
- 71.Alfei F, Kanev K, Hofmann M, et al. TOX reinforces the phenotype and longevity of exhausted T cells in chronic viral infection. Nature. 2019;571:265‐269. [DOI] [PubMed] [Google Scholar]
- 72.Scott AC, Dündar F, Zumbo P, et al. TOX is a critical regulator of tumour‐specific T cell differentiation. Nature. 2019;571:270‐274. [DOI] [PMC free article] [PubMed] [Google Scholar]
- 73.Seo H, Chen J, Gonzalez‐Avalos E, et al. TOX and TOX2 transcription factors cooperate with NR4A transcription factors to impose CD8(+) T cell exhaustion. Proc Natl Acad Sci U S A. 2019;116:12410‐12415. [DOI] [PMC free article] [PubMed] [Google Scholar]
- 74.Liu X, Wang Y, Lu H, et al. Genome‐wide analysis identifies NR4A1 as a key mediator of T cell dysfunction. Nature. 2019;567:525‐529. [DOI] [PMC free article] [PubMed] [Google Scholar]
- 75.Chen J, López‐Moyado IF, Seo H, et al. NR4A transcription factors limit CAR T cell function in solid tumours. Nature. 2019;567:530‐534. [DOI] [PMC free article] [PubMed] [Google Scholar]
- 76.Man K, Gabriel SS, Liao Y, et al. Transcription Factor IRF4 Promotes CD8(+) T Cell exhaustion and limits the development of memory‐like T Cells during chronic infection. Immunity. 2017;47(6):1129‐1141.e5. [DOI] [PubMed] [Google Scholar]
- 77.Doering TA, Crawford A, Angelosanto JM, Paley MA, Ziegler CG, Wherry EJ. Network analysis reveals centrally connected genes and pathways involved in CD8+ T cell exhaustion versus memory. Immunity. 2012;37:1130‐1144. [DOI] [PMC free article] [PubMed] [Google Scholar]
- 78.Wherry EJ, Ha S‐J, Kaech SM, et al. Molecular signature of CD8+ T cell exhaustion during chronic viral infection. Immunity. 2007;27:670‐684. [DOI] [PubMed] [Google Scholar]
- 79.Pauken KE, Sammons MA, Odorizzi PM, et al. Epigenetic stability of exhausted T cells limits durability of reinvigoration by PD‐1 blockade. Science. 2016;354:1160‐1165. [DOI] [PMC free article] [PubMed] [Google Scholar]
- 80.Mognol GP, Spreafico R, Wong V, et al. Exhaustion‐associated regulatory regions in CD8(+) tumor‐infiltrating T cells. Proc Natl Acad Sci U S A. 2017;114:E2776‐E2785. [DOI] [PMC free article] [PubMed] [Google Scholar]
- 81.Gupta PK, Godec J, Wolski D, et al. CD39 expression identifies terminally exhausted CD8+ T Cells. PLoS Pathog. 2015;11:e1005177. [DOI] [PMC free article] [PubMed] [Google Scholar]
- 82.Paley MA, Kroy DC, Odorizzi PM, et al. Progenitor and terminal subsets of CD8+ T cells cooperate to contain chronic viral infection. Science. 2012;338:1220‐1225. [DOI] [PMC free article] [PubMed] [Google Scholar]
- 83.Blackburn SD, Crawford A, Shin H, Polley A, Freeman GJ, Wherry EJ. Tissue‐specific differences in PD‐1 and PD‐L1 expression during chronic viral infection: implications for CD8 T‐cell exhaustion. J Virol. 2010;84:2078‐2089. [DOI] [PMC free article] [PubMed] [Google Scholar]
- 84.Topalian SL, Drake CG, Pardoll DM. Immune checkpoint blockade: a common denominator approach to cancer therapy. Cancer Cell. 2015;27:450‐461. [DOI] [PMC free article] [PubMed] [Google Scholar]
- 85.Ribas A, Wolchok JD. Cancer immunotherapy using checkpoint blockade. Science. 2018;359:1350‐1355. [DOI] [PMC free article] [PubMed] [Google Scholar]
- 86.Wolchok JD, Kluger H, Callahan MK, et al. Nivolumab plus ipilimumab in advanced melanoma. N Engl J Med. 2013;369:122‐133. [DOI] [PMC free article] [PubMed] [Google Scholar]
- 87.Balachandran VP, Łuksza M, Zhao JN, et al. Identification of unique neoantigen qualities in long‐term survivors of pancreatic cancer. Nature. 2017;551:512‐516. [DOI] [PMC free article] [PubMed] [Google Scholar]
- 88.Fan Y, Che X, Qu J, et al. Exosomal PD‐L1 retains immunosuppressive activity and is associated with gastric cancer prognosis. Ann Surg Oncol. 2019;26:3745‐3755. [DOI] [PubMed] [Google Scholar]
Associated Data
This section collects any data citations, data availability statements, or supplementary materials included in this article.
Supplementary Materials
Figure S1
Figure S2
Figure S3
Figure S4
Figure S5
Table S1
Table S2