Abstract
Tissue‐clearing technology is an emerging imaging technique currently utilized not only in neuroscience research but also in cancer research. In our previous reports, tissue‐clearing methods were used for the detection of metastatic tumors. Here, we showed that the cell cycles of primary and metastatic tumors were visualized by tissue‐clearing methods using a reporter system. First, we established cancer cell lines stably expressing fluorescent ubiquitination‐based cell cycle indicator (Fucci) reporter with widely used cancer cell lines A549 and 4T1. Fluorescence patterns of the Fucci reporter were investigated in various tumor inoculation models in mice. Interestingly, fluorescence patterns of the Fucci reporter of tumor colonies were different between various organs, and even among colonies in the same organs. The effects of antitumor drugs were also evaluated using these Fucci reporter cells. Of the three antitumor drugs studied, 5‐fluorouracil treatment on 4T1‐Fucci cells resulted in characteristic fluorescent patterns by the induction of G2/M arrest both in vitro and in vivo. Thus, the combination of a tissue‐clearing method with the Fucci reporter is useful for analyzing the mechanisms of cancer metastasis and drug resistance.
Keywords: antitumor drug, cell cycle, Fucci system, metastasis, tissue‐clearing technology
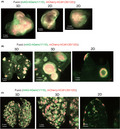
Monitoring the Fucci patterns in vivo with 4T1‐Fucci cells. A, B, 3D and 2D images of 4T1 cells inoculated orthotopically into the mammary fat‐pad. C, 3D and 2D images of 4T1‐Fucci cells in experimental lung metastasis.
Abbreviations
- 5‐FU
5‐fluorouracil
- CDDP
cisplatin (cis‐diamminedichloro‐platinum(II))
- CUBIC
clear, unobstructed brain/body imaging cocktails and computational analysis
- EdU
5‐ethynyl‐2′‐deoxyuridine
- Fucci
fluorescent ubiquitination‐based cell cycle indicator
- mAG
monomeric Azami Green
- mKO2
monomeric Kusabira Orange 2
- PFA
paraformaldehyde
- PTX
paclitaxel
- TGF
transforming growth factor
1. INTRODUCTION
Characteristics of cancer cells are considered to be determined by gene alterations in the cancer cells as well as by the effects of the surrounding tumor microenvironment.1 Uncontrolled cell proliferation is one of the important characteristics of cancer cells, and dormant cancer cells might contribute to relapse of cancer after antitumor drug treatments.2, 3 Therefore, controlling the cell cycle is important for cancer treatment, and various regulators of the cell cycle have been determined.4 However, the effects of the tumor microenvironment on the cancer cell cycle are yet to be fully understood.
Tissue‐clearing technology has developed dramatically during the last couple of decades in neuroscience research, and has recently started to be utilized in cancer research.5 We previously reported that the tissue‐clearing technology termed CUBIC is useful for monitoring cancer metastasis in various mouse tumor models.6 The CUBIC reagents are hydrophilic chemical‐based cocktails that provide high‐quality transparency of various organs in mice.7 The CUBIC technology enables us to quantify cancer metastasis with single‐cell resolution irrespective of depth. Thus, it is now possible to measure the volume and cell number of metastatic tumors at the whole‐organ level. Moreover, CUBIC can make it possible for us to observe patterns of metastasis using 3D images.6, 8 So far, we have focused on the visualization of cancer metastases themselves. By introducing some visualization methods, we thought that we could analyze cancer metastases in more detail.
Various reporter systems offer promising approaches to detect the characteristics of cancer cells, allowing us to investigate the mechanisms of metastasis and the effects of antitumor drugs. The Fucci reporter system that was developed by Sakaue‐Sawano et al is useful for visualizing cell‐cycle progression.9 The system harnesses the cell‐cycle‐dependent proteolysis of Cdt1 and Geminin. In the original system,9 the Fucci‐S/G2/M probe had mAG fused to the APCCdh1‐mediated ubiquitination domain (1‐110) of human Geminin (hGem(1/110)); the Fucci‐G1/G0 probe had mKO2 fused to residues 30‐120 of human Cdt1 (hCdt1(30/120)). Then mVenus and mCherry were substituted for mAG and mKO2, respectively, to generate the second generation, Fucci2.10 The Fucci technology has been utilized for in vitro analysis of the mechanism of apoptosis or the effects of antitumor drugs11, 12, 13 and in vivo cancer studies that locally visualized the cell cycle of primary tumors.14, 15, 16 However, comprehensive cell cycle analysis of metastasis in tumor‐bearing mice requires large‐scale but high‐resolution 3D imaging technology.
In this study, we aimed to visualize the cell cycle in tumor colonies of various mouse models, investigate the patterns of metastasis, and assess the effects of antitumor drugs on the cell cycle, by combining the CUBIC Cancer‐analysis and Fucci reporter system.
2. MATERIALS AND METHODS
2.1. Reagents
Cisplatin and 5‐FU were purchased from Wako (#033‐20091) and Nacalai Tesque (#16220‐01), respectively, and dissolved in ultra‐pure water. Paclitaxel (Taxol) was obtained from Bristol‐Myers Squibb. Recombinant human TGF‐β1 was purchased from R&D Systems (#240‐B).
2.2. Cells
Human lung adenocarcinoma A549 (ATCC) cells were maintained in DMEM (Gibco) supplemented with 10% FBS (Gibco), 50 U/mL penicillin, and 50 µg/mL streptomycin. Murine breast cancer 4T1 cells (ATCC) were cultured in RPMI‐1640 (Gibco) containing 10% FBS, 50 U/mL penicillin, and 50 µg/mL streptomycin. Cell images in cell culture were obtained using a microscope (BZ‐X710; Keyence).
2.3. Establishment of cancer cells stably expressing the Fucci reporter system
To establish cancer cells stably expressing the Fucci(SA) type reporter system, a lentiviral vector system was utilized as previously described.17 Fucci lentiviral vectors pCS‐EF‐mAG‐hGem(1‐110) and pCS‐EF‐mCherry‐hCdt1(30‐120) were kindly provided by Dr Miyawaki (RIKEN). The lentiviral system was kindly provided by Dr Miyoshi (deceased, formerly RIKEN). 293FT cells (Invitrogen) were transfected with the expression vector construct (pCS‐EF‐mAG‐hGem[1‐110] or pCS‐EF‐mCherry‐hCdt1[30‐120]), a VSV‐G‐ and Rev‐expressing construct (pCMV‐VSV‐G‐RSV‐Rev), and a packaging vector construct (pCAG‐HIVgp). The culture supernatant was concentrated and used as lentiviral particles. A549 or 4T1 cells were infected with mAG‐hGem(1‐110) and mCherry‐hCdt1(30‐120) inserted plasmids, and the infected cells were cloned by limiting dilution to obtain stable transfectants. Luciferase gene (Luc2; Promega) was also infected with a lentiviral vector system in A549 cells.
2.4. CUBIC procedure
Tissue‐clearing with CUBIC reagents was carried out as previously described.6, 18, 19 Briefly, mice were killed and perfused with PBS and 4% PFA (#162‐16065, Wako). Excised organs were post‐fixed with 4% PFA for one night at 4℃. Fixed organs were washed with PBS (>6 hours) and immersed in 50% CUBIC‐L (10 w% polyethylene glycol mono‐p‐isooctylphenyl ether/Triton X‐100 [#12967‐45; Nacalai Tesque] and 10 w% N‐butyldiethanolamine [#B0725; Tokyo Chemical Industry]) for delipidation at 37℃ (>6 hours). Thereafter, organs were immersed in 100% CUBIC‐L at 37℃ for 1‐5 days. After washing with PBS (>6 hours), organs were immersed in 50% CUBIC‐R (N) (30 w% nicotinamide [#N0078; Tokyo Chemical Industry] and 45 w% 2,3‐dimethyl‐1‐phenyl‐5‐pyrazolone/antipyrine [#D1876; Tokyo Chemical Industry]) at room temperature (>6 hours), and further immersed in 100% CUBIC‐R (N) at room temperature (>6 hours). All steps were carried out under gentle shaking. For bone samples, the decalcification step using EDTA‐based decalcification solution, such as Osteosoft (#101728; Merk Millipore), was added after the delipidation and decolorization process with CUBIC‐L, as previously described.7 The images of transparent samples were captured by light sheet fluorescence microscopy (custom‐made, Olympus) with 10 µm z‐step in observation oil (mixture of HIVAC‐F4 and mineral oil). The wavelengths of excitation laser were 488 nm (mAG) and 590 nm (mCherry). The emission filters were 495‐540 nm (Φ 32 mm, mAG) and 610‐640 nm (Φ 32 mm, mCherry). All raw image data were collected in a lossless 16‐bit TIFF format. The captured TIFF images were converted to Imaris files using software (Imaris File Converter). Imaris files were analyzed with Imaris software (version 8.4; Bitplane) and Free Imaris Viewer (version 9.5; Bitplane).
2.5. Cell proliferation assay with antitumor drugs
Cells were seeded into 96‐well plates (1 × 10⁴ cells/well) and treated with antitumor drugs. After 2 days of incubation, the number of living cells was determined by Cell Count Reagent SF (#07553‐44; Nacalai Tesque) as previously described.17 Absorbance at 450 and 595 nm (reference absorbance) was measured with a microplate reader (Model 680; Bio‐Rad).
2.6. Flow cytometry
Cells were harvested and washed with PBS. Thereafter, cells were passed through a cell strainer with 35‐µm mesh (Falcon). Flow cytometry analysis was carried out with SH800 (Sony) and the data analysis was undertaken with FlowJo software (Becton Dickinson).
2.7. Cell division assay by EdU labeling
Cell cycle status was assessed by the combination of Fucci system and EdU labeling. A549‐Fucci cells and 4T1‐Fucci cells were treated with or without TGF‐β1 (5 ng/mL) for 24 hours and labeled with EdU (10 µmol/L) for 2 hours. The cells were fixed with 3.7% formaldehyde (Wako) for 15 minutes and permeabilized with 0.5% Triton‐X 100 (Nacalai Tesque) for 20 minutes. Incorporated EdU was detected by using EdU‐Click 647 kit (#BCK‐EDU647; Merck Millipore). Nuclei of cancer cells were stained with VECTASHIELD Antifade Mounting Medium with DAPI (#H‐1200; Vector Laboratories). Cell images were captured with a BZ‐X710 microscope.
2.8. Treatment with antitumor drugs in vitro
4T1‐Fucci cells were seeded into 6‐well plates (0.8‐1.6 × 10⁵ cells/well) and cultured for one night. The next day, cells were treated with 5‐FU, CDDP, or PTX at the indicated concentration and cultured for the indicated periods. Cell images were captured using a BZ‐X710 microscope.
2.9. Experimental mouse models
All experiments were approved by and carried out according to the guidelines of the Animal Care and Use Committee of the Graduate School of Medicine, the University of Tokyo. BALB/c‐nu/nu (nude) mice (4‐6 weeks, female) or BALB/c mice (4‐6 weeks, female) were purchased from Sankyo Lab Service. As previously described,20 4T1‐Fucci cells were inoculated into the mammary fat‐pad orthotopically (BALB/c mice) under anesthesia with isoflurane (#095‐06573; Wako) using a 29‐G needle (1‐3 × 10⁵ cells/50 µL/mouse). Primary tumors were excised at 2 weeks after inoculation under anesthesia, and the lungs were excised after additional 1‐2 weeks. A549‐Fucci cells were inoculated orthotopically (BALB/c‐nu/nu mice) as previously described.21 Briefly, A549‐Fucci cells were mixed with Matrigel and inoculated in the left lung (1 × 10⁵ cells/10 µL/mouse) under anesthesia with isoflurane (#099‐06571; Wako). Ten to 14 days after inoculation, mice were killed and the lungs were excised. To induce bone and brain metastases with A549‐Fucci cells, cancer cells were inoculated into the left ventricle of nude mice with a 26‐G needle as previously described (5 × 10⁵ cells/200 µL/mouse).22 Mice were killed 1‐2 months after inoculation. In the experimental lung metastasis model, cancer cells were injected intravenously (4T1, 1 × 10⁵ cells/500 µL/mouse; A549, 5 × 10⁵ cells/500 µL/mouse). For antitumor drug treatment, 4T1‐Fucci cells were injected intravenously (1 × 10⁵ cells/500 µL/mouse) (day 0), and mice were treated with 5‐FU (35 mg/kg) or saline (Otsuka) intraperitoneally on days 3‐9. On day 10, mice were killed, and the lungs were extracted.
2.10. In vivo bioluminescence imaging
D‐luciferin potassium salt (Promega) was injected intraperitoneally. Ten to 15 minutes after injection, bioluminescence signals were measured using the NightOWL LB983 system (Berthold Technologies). Imaging analyses were undertaken with the IndiGO2 software (Berthold Technologies). All values are shown as photons per second.
2.11. Histological analysis
Transparent samples after CUBIC procedures were washed with PBS and then embedded in paraffin blocks as previously described.6 Samples were subjected to H&E staining, and immunohistochemistry with DAB staining was also carried out. Antigen retrieval was undertaken with the HIER reagent from Abcam (#ab208572). Anti‐Ki67 Ab (#KCL‐L‐Ki67‐MM1) was purchased from Novocastra. The second Ab conjugated with HRP (Envision) was obtained from Dako. The DAB staining was carried out with ImmPACT DAB (#SK4105; Vector Laboratories).
3. RESULTS
3.1. Establishment of cancer cells stably expressing Fucci reporter
Cancer cells stably expressing the Fucci reporter were established using a lentiviral vector system and limiting dilution. Human lung adenocarcinoma A549 cells and murine breast cancer 4T1 cells were used, as they are widely used cancer cells that often metastasize to various organs in mouse models.6, 20 In this study, we picked up mAG‐hGem(1‐110) from the original Fucci system9 and mCherry‐Cdt1(30‐120) from the Fucci2 system10 to generate a new Fucci derivative. This combination of fluorescent proteins, mAG and mCherry, can be excited best by the two laser lines (488 and 590 nm) and their emissions can be collected efficiently and specifically using our custom‐made microscope (see “Materials and Methods”). To determine whether the established stable transfectants worked, the cells were stimulated with TGF‐β1. Transforming growth factor‐β is a well‐known cytokine that has an ability to induce epithelial‐mesenchymal transition and suppress cell proliferation through induction of cyclin‐dependent kinase inhibitors and inhibition of the expression of proliferation factors.23 When A549‐Fucci cells were stimulated with TGF‐β1, cell morphology was changed from the epithelial type to the mesenchymal type, and the cells showing mCherry increased (Figure 1A). In addition, cell division assay with EdU labeling showed that cell division was suppressed by stimulation with TGF‐β1 (Figure 1A). To investigate their cell cycle precisely, flow cytometry analysis was also conducted. When A549‐Fucci cells were stimulated with TGF‐β1, the cells showing both mAG and mCherry (mAG/mCherry) and only mAG cells, which were in S, G2, and M phases, strongly decreased (Figure 1B). In contrast, the A549‐Fucci cells showing only mCherry, which were in G0 or G1 phase, increased (Figure 1B). Similar analysis was carried out using 4T1‐Fucci cells. The results showed that 4T1‐Fucci cells also changed their cell morphology and the mCherry‐showing cells increased with TGF‐β stimulation (Figure 1C). In addition, EdU+ cells decreased by the stimulation with TGF‐β in 4T1‐Fucci cells. Flow cytometry analysis showed that the cells showing mAG/mCherry and mAG decreased, and the cells showing only mCherry increased with TGF‐β stimulation (Figure 1D). The ratio of cells showing mAG in 4T1‐Fucci cells was higher than in A549‐Fucci cells with or without TGF‐β stimulation. The results of the colony formation assay showed that TGF‐β1 stimulation also suppressed the colony formation of A549‐Fucci cells and 4T1‐Fucci cells (Figure S1). When these colonies were monitored by a confocal microscopy, the patterns of Fucci were different in each colony, and most colonies with TGF‐β1 stimulation showed mCherry expression (Figure S1). These data indicated that we successfully established the A549‐Fucci and 4T1‐Fucci cells, in which expression patterns of fluorescent proteins reflected the cell cycle.
FIGURE 1.
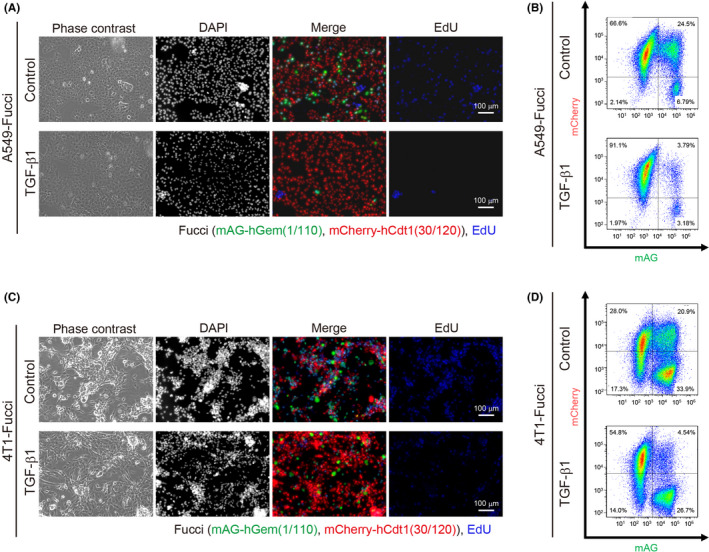
Establishment of stable transfectants expressing the fluorescent ubiquitination‐based cell cycle indicator (Fucci) reporter system. A‐D, Stable transfectants expressing the Fucci reporter system (A549‐Fucci cells [A, B] and 4T1‐Fucci cells [C, D]) were treated with or without transforming growth factor‐β1 (TGF‐β1; 5 ng/mL) for 1 d. The morphologies, DAPI staining, Fucci patterns, and 5‐ethynyl‐2′‐deoxyuridine (EdU) labeling of the cells are shown in (A) and (C). Cell cycle was analyzed by flow cytometry and shown in (B) and (D). hCdt1, human Cdt1; hGem, human Geminin; mAG, monomeric Azami Green
3.2. Patterns of Fucci reporter expression in various A549 tumor colonies
Next, the cell cycle of established cells was investigated in vivo using various tumor inoculation models. Bone and brain metastases were induced by intracardiac injection of cancer cells into the left ventricle of a mouse, as previously described.7, 22 When A549‐Fucci cells were injected intracardially in nude mice, bone and brain metastases were observed by in vivo bioluminescence imaging (Figure 2A). In these mice, brain and legs were excised and analyzed by CUBIC. The results showed that most A549‐Fucci metastatic colonies were small in the brain (Figure 2B). In contrast, A549‐Fucci cells could proliferate and formed bulky metastatic tumors in the leg (Figures 2C and S2), supporting the fact that the bone is a common site of cancer metastasis. Regarding the patterns of the cell cycle in these metastatic colonies, there was no specific pattern observed in the brain metastatic colonies. However, the metastatic tumors inside the bone showed the mAG+ area at the peripheral sites, surrounding the mCherry+ area (Figure 2B,C). We also investigated A549‐Fucci colonies using two other inoculation models, ie the orthotopic inoculation model and the experimental metastasis model with intravenous injection. When A549‐Fucci cells were inoculated orthotopically into the left lobe of the lung, cells showing mAG were observed at the peripheral sites of tumors, surrounding the cells showing mCherry, similar to bone metastasis (Figures 2D and S3A). When A549‐Fucci cells were injected intravenously, small metastatic foci were observed and the patterns of Fucci reporter expression were varied among each metastatic colony (Figure 2E). In the case of lung imaging, autofluorescent signals from cartilages of the trachea are quite high, especially at the short wavelength of green fluorescence (Figure 2D,E). These data suggested that patterns of metastasis and their cell cycle patterns are dependent on the surrounding tumor microenvironment.
FIGURE 2.
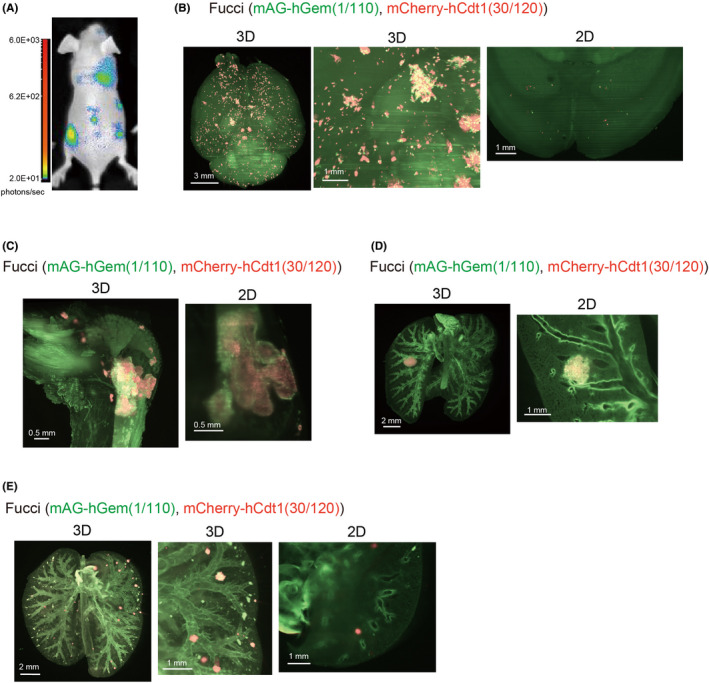
Monitoring the fluorescent ubiquitination‐based cell cycle indicator (Fucci) patterns in vivo with A549‐Fucci cells. A, A549‐Fucci cells were injected into mice intracardially and cancer progression was monitored using in vivo bioluminescence imaging. B, C, 3D and 2D images of experimental brain and bone metastases. A549‐Fucci cells were injected intracardially in BALB/c nu/nu mice. Mice were killed 1‐2 mo after inoculation and brains and legs were excised. 3D and 2D images of brain (B) and leg (C) are shown. D, 3D and 2D images of primary A549 tumors. A549‐Fucci cells with Matrigel were inoculated into the left lung orthotopically. Mice were killed 10‐14 d after inoculation and lungs were excised. 3D and 2D images of the lung are shown. E, 3D and 2D images of experimental lung metastasis. A549‐Fucci cells were injected intravenously. One month after injection, mice were killed and lungs were excised. 3D images of the lung are shown. In (B‐E), background signal from other components like lung trachea are also detected. hCdt1, human Cdt1; hGem, human Geminin; mAG, monomeric Azami Green
3.3. Patterns of Fucci reporter expression in various 4T1 tumor colonies
We also investigated the patterns of the cell cycle in various metastatic tumors using 4T1‐Fucci cells. When 4T1 cells were inoculated orthotopically into the mammary fat‐pad of BALB/c mice, spontaneous lung metastasis was often observed.20 Primary tumors and spontaneous lung metastasis in the mice inoculated with 4T1‐Fucci cells were investigated with CUBIC (Figure 3A,B). When primary tumors were analyzed using 3D images, mCherry‐showing areas existed in the center of the tumors, which were surrounded by mAG‐showing areas (Figure 3A). In addition, necrotic areas were observed in the center areas, and boundary areas showed green fluorescence (Figures 3A and S3B). The study of spontaneous lung metastasis with 4T1‐Fucci cells showed that proliferating cells, showing mAG, existed in the peripheral sites of most colonies (Figures 3B and S3C). The experimental lung metastasis model with intravenous injection was also used to analyze lung metastasis of 4T1‐Fucci cells (Figure 3C). In this case, the proliferating cells existed in the peripheral sites of colonies similar to spontaneous metastasis (Figure 3C). However, the shapes of metastatic colonies and their cell densities seemed to be different compared to the colonies from spontaneous lung metastasis. Thus, we successfully visualized the patterns of the Fucci reporter expression in both primary tumors and lung metastatic colonies with 4T1‐Fucci cells.
FIGURE 3.
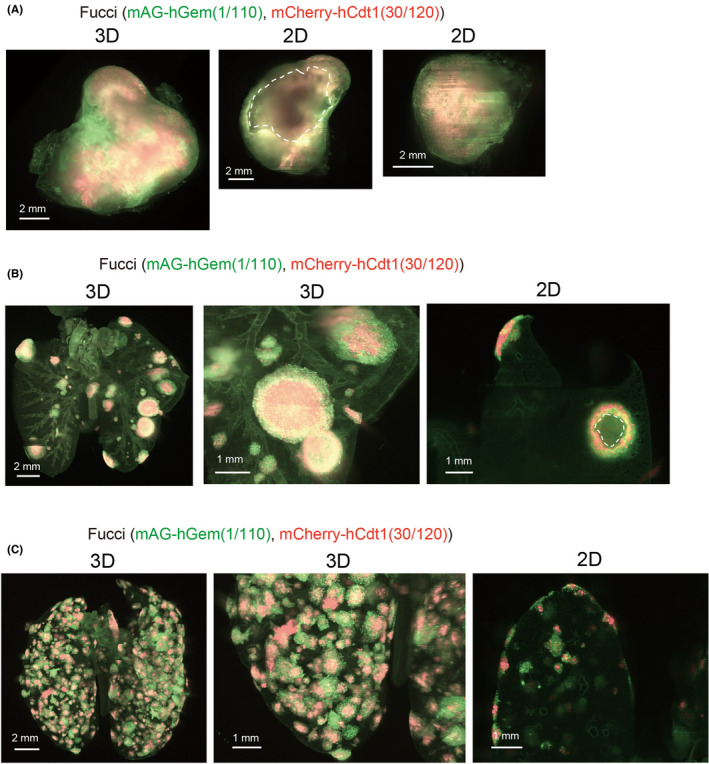
Monitoring the fluorescent ubiquitination‐based cell cycle indicator (Fucci) patterns in vivo with 4T1‐Fucci cells. A, B, 3D and 2D images of 4T1 tumors. 4T1‐Fucci cells were inoculated orthotopically into the mammary fat‐pad of mice. Two weeks after inoculation, primary tumors were excised and subjected to clear, unobstructed brain/body imaging cocktails and computational analysis (CUBIC) procedures. After an additional 1‐2 wk, mice were killed and lungs were excised. 3D and 2D images of the primary tumor (A) and lung (B) are shown. Necrotic areas of the primary tumor are indicated by white dotted line. C, 3D and 2D images of 4T1‐Fucci cells in experimental lung metastasis. 4T1‐Fucci cells were inoculated intravenously. Ten days after injection, mice were killed and lungs were subjected to CUBIC procedures. In (B, C), background signals from other components like lung trachea are also detected. hCdt1, human Cdt1; hGem, human Geminin; mAG, monomeric Azami Green
3.4. Effects of antitumor drugs on 4T1‐Fucci cells in vitro
To investigate the effects of antitumor drugs in vitro, 4T1‐Fucci cells were treated with 5‐FU, CDDP, and PTX at the indicated concentrations. The results showed that all the antitumor drugs killed 4T1‐Fucci cells in a concentration‐dependent manner (Figure 4A). To investigate the cell cycle, cells were treated with antitumor drugs at concentrations less prone to undergo apoptosis. We confirmed that most 4T1‐Fucci cells survived after 24 hours of treatment with antitumor drugs at lower concentrations except PTX (data not shown). Interestingly, 24‐hour treatment with 5‐FU or CDDP made 4T1‐Fucci cells green in correlation with the increase of drug concentrations (Figure 4B). These results suggested that 5‐FU and CDDP blocked the cell cycle at S, G2, or M phase. Paclitaxel treatment at 1 µmol/L also induced S, G2, M arrest and the mAG+ population of 4T1‐Fucci cells increased. However, when 4T1‐Fucci cells were treated with lower doses of PTX, the fluorescent signals from both mAG+ population and mCherry+ population increased slightly (Figure 4B). This indicates that the cell cycle was also blocked at the G1 phase under these conditions. Fragmented nuclear division was also observed in PTX‐treated cells, suggesting that apoptosis was induced (Figure 4C). To quantify the ratio of mAG‐ and/or mCherry‐showing cells, 4T1‐Fucci cells were also analyzed using flow cytometry. The treatment with 5‐FU or CDDP of 4T1‐Fucci cells increased the mAG+ population and decreased the number of mCherry+ and mAG/mCherry+ cells (Figure 5A,B). Treatment with PTX decreased the mAG/mCherry+ population and increased the mAG+ population (Figure 5C), indicating that the cell cycle was blocked at S, G2, or M phase. However, the mCherry+ population also increased, suggesting that G1 arrest also started to be induced. To confirm whether the cell cycle is arrested in certain phases or not, we assessed the effect of treatment with antitumor drugs on 4T1‐Fucci cells in time‐dependent manner. As a result, the number of mAG+ cells increased in time‐dependent manner with 5‐FU or CDDP treatment (Figure 6). In addition, the arrested state was sustained for certain periods (Figure S4). However, some cells shifted to mCherry+ after 48 or 72 hours of treatment when the concentrations of antitumor drugs were low, such as 1 µmol/L CDDP (Figure S4). Moreover, it is interesting that treatment with PTX increased the number of mAG+ cells, especially after 6 hours of treatment (Figure 6), whereas the mCherry+ population increased after 48 and 72 hours of treatment (Figure S4). These data suggested that treatment with 5‐FU, CDDP, or PTX exerted effects on survival of 4T1‐Fucci cells depending on their concentrations. They also showed that the effects of each drug on the cell cycle were varied with the drugs, their concentrations, and time in vitro.
FIGURE 4.
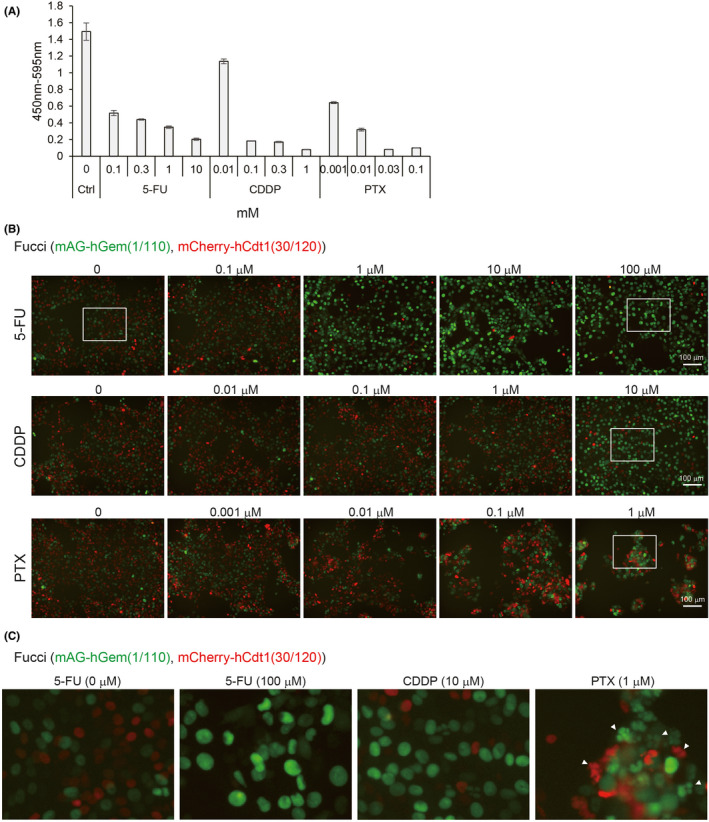
Effects of antitumor drugs on 4T1‐fluorescent ubiquitination‐based cell cycle indicator (Fucci) cells in vitro. A, Effect of antitumor drugs on 4T1‐Fucci cells. 4T1‐Fucci cells were treated with 5‐fluorouracil (5‐FU), cisplatin (CDDP), and paclitaxel (PTX) at the indicated concentrations for 2 d. Cell proliferation was evaluated by WST‐8 assay. The experiment was repeated three times and representative results are shown (average ± SD). B, C, Effect of antitumor drugs on cell cycle of 4T1‐Fucci cells. 4T1‐Fucci cells were treated with antitumor drugs at low concentrations for 24 h. Cell images are shown in (B). Enlarged images of white insets of (B) are shown in (C). Fragmented nuclear divisions are indicated by white arrowheads in (C). Ctrl, control; hCdt1, human Cdt1; hGem, human Geminin; mAG, monomeric Azami Green
FIGURE 5.
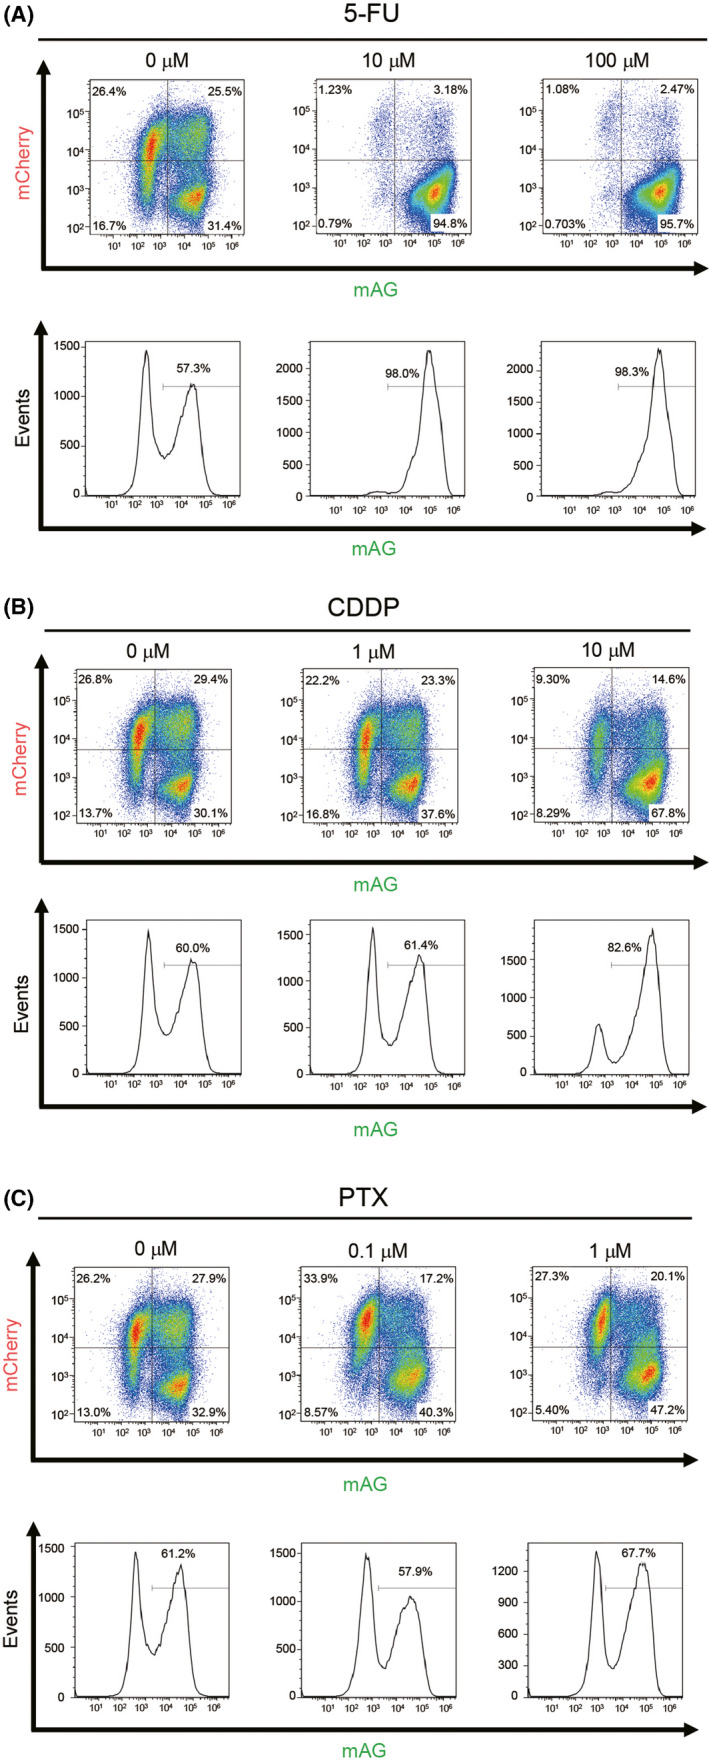
Analysis of antitumor drugs’ effects on 4T1‐fluorescent ubiquitination‐based cell cycle indicator (Fucci) cells in vitro by flow cytometry. A‐C, 4T1‐Fucci cells were treated with antitumor drugs (A) 5‐fluorouracil (5‐FU), (B) cisplatin (CDDP), and (C) paclitaxel (PTX) at indicated concentrations for 24 h. Cell cycle was analyzed by flow cytometry at indicated concentrations. Experiments were repeated three times and representative results are shown. mAG, monomeric Azami Green
FIGURE 6.
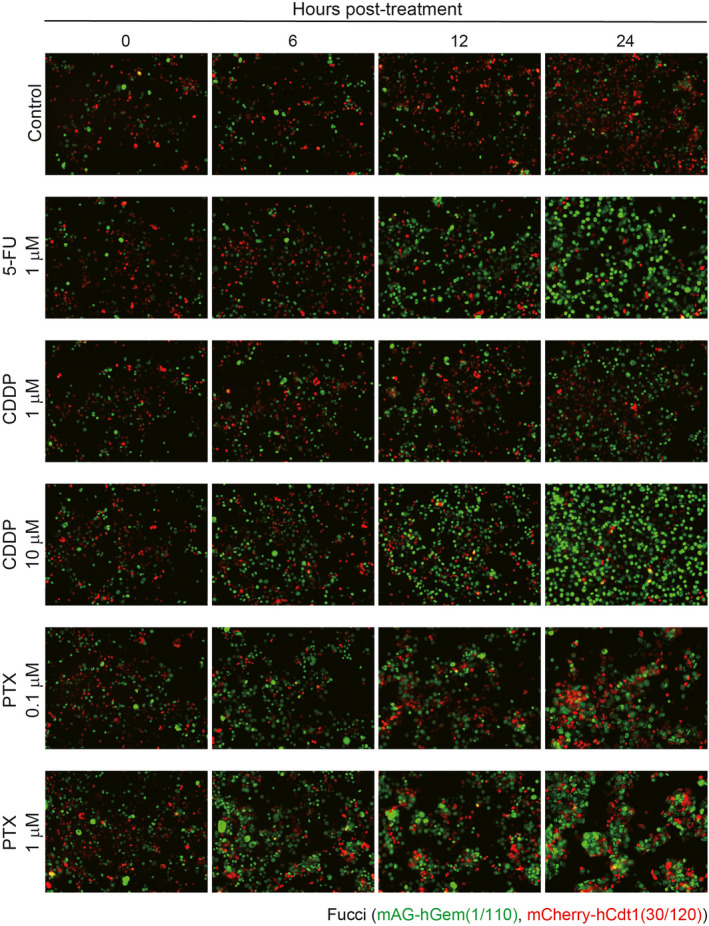
Time‐dependent effect of antitumor drugs on cell cycle of 4T1‐Fucci cells in vitro. 4T1‐Fucci cells were treated with antitumor drugs (5‐fluorouracil [5‐FU], cisplatin [CDDP], and paclitaxel [PTX]) at the indicated concentrations for 0, 6, 12, and 24 h. The experiment was repeated three times and representative images are shown. hCdt1, human Cdt1; hGem, human Geminin; mAG, monomeric Azami Green
3.5. Effects of antitumor drugs on 4T1‐Fucci cells in vivo
The effects of antitumor drugs were investigated in vivo using 4T1‐Fucci cells. Among the three antitumor drugs, 5‐FU was selected due to the clear effect on the cell cycle in vitro. 4T1‐Fucci cells were injected intravenously, and the mice were treated with 5‐FU intraperitoneally from day 3 to day 9 as previously described.24 Ten days after 4T1‐Fucci cell injection, these mice were killed and their excised lungs were subjected to CUBIC procedures. The results showed that 5‐FU made the 4T1‐Fucci colonies small in vivo and that the mAG+ cancer cells drastically increased in the lungs of 5‐FU‐treated mice compared to the lungs of saline‐treated mice (Figure 7A). After CUBIC procedures, immunohistochemistry analysis was also carried out (Figure 7B, C). Hematoxylin‐eosin analysis confirmed that treatment with 5‐FU decreased the growth of 4T1‐Fucci tumors (Figure 7B). We also investigated the expression of Ki‐67, which is a proliferation marker and highly expressed, especially in M phase of the cell cycle.25 Ki‐67 expression was observed in metastatic lung colonies in both saline‐treated and 5‐FU‐treated mice (Figure 7C). In the case of the 5‐FU‐treated mice, Ki‐67+ cancer cells were present in the peripheral sites of some metastatic colonies, supporting the notion that 5‐FU blocked the cell cycle at around G2/M phase in 4T1‐Fucci cells. These data suggested that, by combining CUBIC with the Fucci system, the effects of antitumor drugs not only on cell survival but also on the cell cycle in vivo could be analyzed.
FIGURE 7.
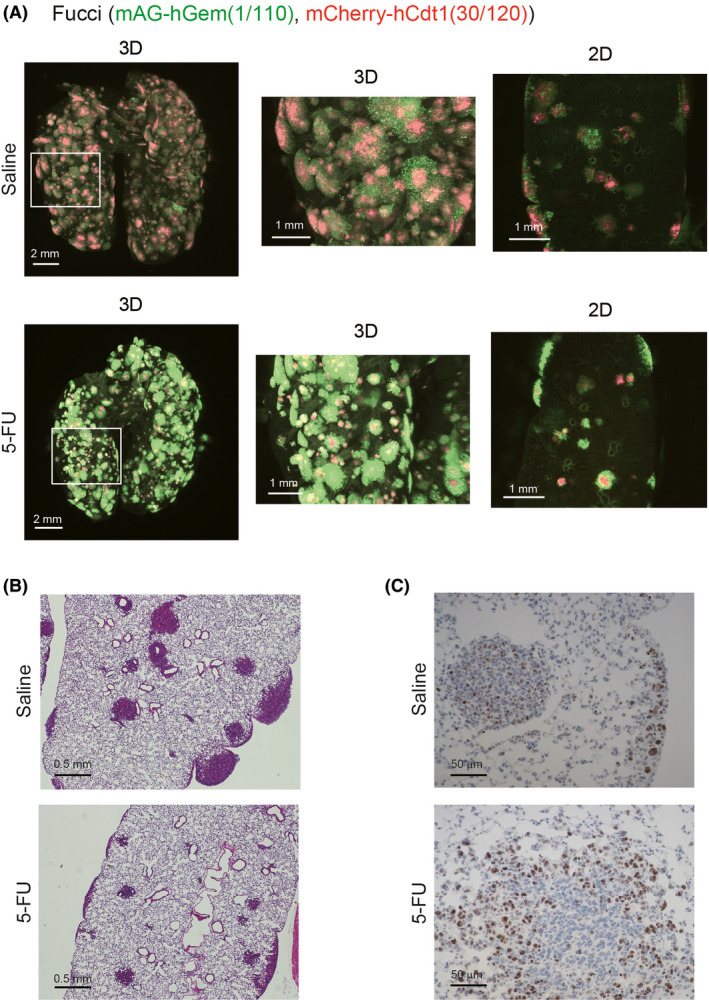
Effects of 5‐fluorouracil (5‐FU) on 4T1‐fluorescent ubiquitination‐based cell cycle indicator (Fucci) tumors in vivo. A, Effects of 5‐FU on 4T1‐Fucci tumors. 4T1‐Fucci cells were inoculated intravenously (day 0). On day 3 to day 9, mice were treated with 5‐FU (35 mg/kg) or control saline (n = 6 per group). On day 10, mice were killed and lungs were excised and subjected to clear, unobstructed brain/body imaging cocktails and computational analysis (CUBIC) procedures. Representative 3D and 2D images of lungs are shown. B, C, Transparent samples in (A) were washed with PBS and embedded in paraffin blocks. H&E staining and immunohistochemistry with anti‐Ki‐67 Ab was carried out. Representative images of the samples in saline and 5‐FU are shown; (B) H&E, (C) Ki‐67 staining. hCdt1, human Cdt1; hGem, human Geminin; mAG, monomeric Azami Green
4. DISCUSSION
Detecting the cancer cell cycle is important for investigating the mechanisms of metastasis or antitumor drug resistance. In this study, we showed the utility of tissue‐clearing technology in combination with the Fucci reporter system. Using CUBIC and the Fucci system, the cell cycle of cancer cells in metastatic tumors can be monitored with single‐cell resolution and 3D images at whole mouse organ level. We revealed that not only the size or shape of metastatic tumors but also their patterns of cell cycle were dependent upon each organ. In the case of A549‐Fucci cells, it is interesting that the size of metastatic colonies and their states of the cell cycle were quite different between brain and bone (Figure 2B,C). A549‐Fucci cells could not proliferate well in the mouse brain, and some cells seemed to enter into a dormant state. A recent study showed that astrocytes and the soft surrounding microenvironment suppressed DNA methyltransferase 1 and kept cancer cells in dormant states.26 These mechanisms could be related to our model. Moreover, our results showed that varied cell cycle patterns of metastatic tumors were observed in the same organ. For example, the metastatic colonies in spontaneous lung metastasis of 4T1‐Fucci cells or experimental lung metastasis of A549‐Fucci cells showed not only colonies surrounded by mAG+ cells but also colonies mostly covered by mCherry+ cells (Figures 2E and 3B). It is speculated that these heterogeneities of metastatic colonies between and within organs might contribute to the antitumor drug resistance.
It has already been reported that bone can be made transparent with CUBIC reagents by adding a decalcification process.7 Our current study supported the previous study showing that cancer metastasis can be detected inside the bone. Staining with H&E after CUBIC procedures and visualization of blood capillaries (2020) suggested that small blood vessels next to a growth plate were the most likely place for cancer cells to be arrested.
In our current tissue‐clearing method with CUBIC reagents (CUBIC‐L and CUBIC‐R (N)), a perfusion step with PBS and PFA is needed to reduce autofluorescence signals from red blood cells.18, 27, 28 Tainaka et al showed that CUBIC‐L reagent not only has the ability of delipidation but also a high ability to decolorize tissues, especially by removing heme.7 Here, we showed that primary tumors in the orthotopic model with 4T1‐Fucci cells were also visualized with 3D images using the CUBIC reagent (Figure 3A). In this model, mice were not killed when the primary tumor was excised; thus, the perfusion step could not be applied to these samples. Therefore, to reduce autofluorescence from red blood cells, incubation time with CUBIC‐L reagent was prolonged. As a result, the cell cycle of the primary tumor could be observed in clear 3D and 2D images similar to other samples with perfusion (Figure 3A). These findings suggested that perfusion might not always be necessary in tissue‐clearing methods with CUBIC reagents, depending on the samples. When primary tumors can be monitored with 3D images at single‐cell resolution, specific cell localization can be investigated inside the primary tumors. In addition, if perfusion is not needed, it is expected that circulating tumor cells inside the blood can be detected with 3D images in the future. Autofluorescent signals (eg from cartilages of trachea, fat tissues, and pigments) often become a problem, which can mask the positive signals. Depending on the cells used or imaging organs, there may be a limit for the reduction of autofluorescence signals. Therefore, for taking clear images with tissue‐clearing technologies, extracting positive signals by machine learning is another option, and we have recently succeeded in the extraction of positive signals from low quality data.19
Previous reports showed that antitumor drugs, including 5‐FU and CDDP, induce G2/M arrest before induction of apoptosis in various types of cells, including cancer cells.29, 30, 31, 32 Our results supported these data, and we showed that 5‐FU treatment induced G2/M arrest both in vitro and in vivo with 24 hour‐cycle treatment. Long‐term treatment with antitumor drugs in vitro resulted in 5‐FU and CDDP‐induced G2/M arrest at 24 hours; however, some cancer cells shifted to mCherry+ cells 48‐72 hours after treatment when the concentrations of antitumor drugs were not high enough. As previously described, Ki‐67 is highly expressed in G2 and M phases25, 33 and our results from Ki‐67 staining confirmed the data of G2/M arrest induction in 5‐FU‐treated 4T1 cells (Figure 7C). Regarding PTX treatment, G2/M arrest was observed after 6‐24 hours of treatment as previously described34, 35, 36; however, G1 arrest was observed after 48‐72 hours of treatment. Fragmented nuclei were observed not only in mAG+ cells but also in mCherry+ cells under treatment with PTX (Figure 4C). These data suggested that, under the PTX treatment, apoptosis was induced in some cancer cells through G2/M arrest, but other cells could not stop the mitosis completely and cells entered G1 phase with or without fragmented nuclei. Some previous studies reported that a low concentration treatment with PTX can induce cell cycle arrest not only at G2/M phase but also at G1 phase after mitosis.37, 38 These data also indicated the possibility that some of these cells arrested in G1 phase with PTX treatment might be viable, not apoptotic.37, 38 Various cell cycle proteins, including p53 and p21, are related to the response to antitumor drug treatment. Mitogen‐activated protein kinase and nuclear factor‐κB pathways are also involved in the cell cycle arrest at G1 and G2/M phases.35, 39, 40 Further investigation is needed to elucidate the detailed mechanisms.
In this study, we successfully monitored not only the size or shape of metastatic colonies but also the cell cycle, comprehensively at whole mouse organ level with high resolution, in combination with CUBIC and the Fucci reporter system. To our knowledge, this is the first report showing the application of CUBIC with the Fucci reporter system. Recently, a new version of Fucci has been developed and a new 3D staining protocol with CUBIC reagent is available.41, 42 These new methods will help us to investigate the characteristics of cancer cells more precisely. We believe that this new combination method with CUBIC and the Fucci reporter system will help us to understand the mechanisms of cancer metastasis and drug resistance.
DISCLOSURE
KM and SE were partly supported by Eisai, Co., Ltd. HRU is a co‐inventor of patent applications covering the CUBIC reagents (PCT/JP2014/070618 [pending], patent applicant is RIKEN, and PCT/JP2017/016410 [pending], patent applicant is RIKEN) and CUBIC‐HV reagents (PCT/JP2020/31840 [pending], patent applicant is CUBICStars) and a co‐founder of CUBICStars. The other authors have no conflict of interest. This work was partly done with technical support from Olympus Corporation.
Supporting information
Supplementary Material
ACKNOWLEDGMENTS
We thank Drs. Sakaue‐Sawano and Miyawaki (RIKEN) and Dr Miyoshi (deceased, formerly RIKEN) for providing plasmids, Dr Hayakawa (Toyama University) for his technical assistance on mouse inoculation models, and Drs. Susaki and Tainaka for their valuable advice on the tissue‐clearing method. We also thank Bitplane for instructions on operating the Imaris software. This work was supported by grants from KAKENHI (grants‐in‐aid for scientific research) on Innovative Area on Integrated Analysis and Regulation of Cellular Diversity (K. M., grant number 17H06326) from the Ministry of Education, Culture, Sports, Science, and Technology of Japan (MEXT), and KAKENHI (Grand‐in‐Aid for Early‐career Scientists to KT, grant number 19K16604, to SIK, grant number 20K16212) and KAKENHI (Grants‐in‐Aids for Scientific Research (S) and (A) to KM, grant number 15H05774 and 20H00513) from the Japan Society for the Promotion of Science (JSPS). This work was partly done with technical support from Olympus Corporation.
Takahashi K, Tanabe R, Ehata S, et al. Visualization of the cancer cell cycle by tissue‐clearing technology using the Fucci reporter system. Cancer Sci. 2021;112:3796–3809. 10.1111/cas.15034
Funding information
Ministry of Education, Culture, Sports, Science, and Technology of Japan KAKENHI, Grant/Award Number: 17H06326; Japan Society for the Promotion of Science KAKENHI, Grant/Award Numbers: 19K16604, 20K16212, 15H05774, 20H00513.
REFERENCES
- 1.Hanahan D, Coussens LM. Accessories to the crime: functions of cells recruited to the tumor microenvironment. Cancer Cell. 2012;21:309‐322. [DOI] [PubMed] [Google Scholar]
- 2.Housman G, Byler S, Heerboth S, et al. Drug resistance in cancer: an overview. Cancers. 2014;6:1769‐1792. [DOI] [PMC free article] [PubMed] [Google Scholar]
- 3.Phan TG, Croucher PI. The dormant cancer cell life cycle. Nat Rev Cancer. 2020;20:398‐411. [DOI] [PubMed] [Google Scholar]
- 4.Otto T, Sicinski P. Cell cycle proteins as promising targets in cancer therapy. Nat Rev Cancer. 2017;17:93‐115. [DOI] [PMC free article] [PubMed] [Google Scholar]
- 5.Ueda HR, Erturk A, Chung K, et al. Tissue clearing and its applications in neuroscience. Nat Rev Neurosci. 2020;21:61‐79. [DOI] [PubMed] [Google Scholar]
- 6.Kubota SI, Takahashi K, Nishida J, et al. Whole‐body profiling of cancer metastasis with single‐cell resolution. Cell Rep. 2017;20:236‐250. [DOI] [PubMed] [Google Scholar]
- 7.Tainaka K, Murakami TC, Susaki EA, et al. Chemical landscape for tissue clearing based on hydrophilic reagents. Cell Rep. 2018;24:2196‐2210.e9. [DOI] [PubMed] [Google Scholar]
- 8.Kok SY, Oshima H, Takahashi K, et al. Malignant subclone drives metastasis of genetically and phenotypically heterogenous cell clusters through fibrotic niche generation. Nat Commun. 2021;12:863. [DOI] [PMC free article] [PubMed] [Google Scholar]
- 9.Sakaue‐Sawano A, Kurokawa H, Morimura T, et al. Visualizing spatiotemporal dynamics of multicellular cell‐cycle progression. Cell. 2008;132:487‐498. [DOI] [PubMed] [Google Scholar]
- 10.Sakaue‐Sawano A, Kobayashi T, Ohtawa K, Miyawaki A. Drug‐induced cell cycle modulation leading to cell‐cycle arrest, nuclear mis‐segregation, or endoreplication. BMC Cell Biol. 2011;12:2. [DOI] [PMC free article] [PubMed] [Google Scholar]
- 11.Harada M, Morikawa M, Ozawa T, et al. Palbociclib enhances activin‐SMAD‐induced cytostasis in estrogen receptor‐positive breast cancer. Cancer Sci. 2019;110:209‐220. [DOI] [PMC free article] [PubMed] [Google Scholar]
- 12.Miwa S, Yano S, Kimura H, et al. Cell‐cycle fate‐monitoring distinguishes individual chemosensitive and chemoresistant cancer cells in drug‐treated heterogeneous populations demonstrated by real‐time FUCCI imaging. Cell Cycle. 2015;14:621‐629. [DOI] [PMC free article] [PubMed] [Google Scholar]
- 13.Hama H, Kurokawa H, Kawano H, et al. Scale: a chemical approach for fluorescence imaging and reconstruction of transparent mouse brain. Nat Neurosci. 2011;14:1481‐1488. [DOI] [PubMed] [Google Scholar]
- 14.Imamura T, Saitou T, Kawakami R. In vivo optical imaging of cancer cell function and tumor microenvironment. Cancer Sci. 2018;109:912‐918. [DOI] [PMC free article] [PubMed] [Google Scholar]
- 15.Kagawa Y, Matsumoto S, Kamioka Y, et al. Cell cycle‐dependent Rho GTPase activity dynamically regulates cancer cell motility and invasion in vivo. PLoS One. 2013;8:e83629. [DOI] [PMC free article] [PubMed] [Google Scholar]
- 16.Yano S, Hoffman RM. Real‐time determination of the cell‐cycle position of individual cells within live tumors using FUCCI cell‐cycle imaging. Cells. 2018;7:168. [DOI] [PMC free article] [PubMed] [Google Scholar]
- 17.Takahashi K, Ehata S, Miyauchi K, Morishita Y, Miyazawa K, Miyazono K. Neurotensin receptor 1 signaling promotes pancreatic cancer progression. Mol Oncol. 2021;15:151‐166. [DOI] [PMC free article] [PubMed] [Google Scholar]
- 18.Takahashi K, Kubota SI, Ehata S, Ueda HR, Miyazono K. Protocol for imaging and analysis of mouse tumor models with CUBIC tissue clearing. STAR Protoc. 2020;1:100191. [DOI] [PMC free article] [PubMed] [Google Scholar]
- 19.Kubota SI, Takahashi K, Mano T, et al. Whole‐organ analysis of TGF‐β‐mediated remodelling of the tumour microenvironment by tissue clearing. Commun Biol. 2021;4:294. [DOI] [PMC free article] [PubMed] [Google Scholar]
- 20.Takahashi K, Nagai N, Ogura K, et al. Mammary tissue microenvironment determines T cell‐dependent breast cancer‐associated inflammation. Cancer Sci. 2015;106:867‐874. [DOI] [PMC free article] [PubMed] [Google Scholar]
- 21.Fushiki H, Kanoh‐Azuma T, Katoh M, et al. Quantification of mouse pulmonary cancer models by microcomputed tomography imaging. Cancer Sci. 2009;100:1544‐1549. [DOI] [PMC free article] [PubMed] [Google Scholar]
- 22.Ehata S, Hanyu A, Fujime M, et al. Ki26894, a novel transforming growth factor‐β type I receptor kinase inhibitor, inhibits in vitro invasion and in vivo bone metastasis of a human breast cancer cell line. Cancer Sci. 2007;98:127‐133. [DOI] [PMC free article] [PubMed] [Google Scholar]
- 23.Miyazono K, Katsuno Y, Koinuma D, Ehata S, Morikawa M. Intracellular and extracellular TGF‐β signaling in cancer: some recent topics. Front Med. 2018;12:387‐411. [DOI] [PubMed] [Google Scholar]
- 24.Bao L, Haque A, Jackson K, et al. Increased expression of P‐glycoprotein is associated with doxorubicin chemoresistance in the metastatic 4T1 breast cancer model. Am J Pathol. 2011;178:838‐852. [DOI] [PMC free article] [PubMed] [Google Scholar]
- 25.Sun X, Kaufman PD. Ki‐67: more than a proliferation marker. Chromosoma. 2018;127:175‐186. [DOI] [PMC free article] [PubMed] [Google Scholar]
- 26.Hirata E, Ishibashi K, Kohsaka S, et al. The brain microenvironment induces DNMT1 suppression and indolence of metastatic cancer cells. iScience. 2020;23:101480. [DOI] [PMC free article] [PubMed] [Google Scholar]
- 27.Susaki EA, Tainaka K, Perrin D, Yukinaga H, Kuno A, Ueda HR. Advanced CUBIC protocols for whole‐brain and whole‐body clearing and imaging. Nat Protoc. 2015;10:1709‐1727. [DOI] [PubMed] [Google Scholar]
- 28.Tainaka K, Kubota S, Suyama T, et al. Whole‐body imaging with single‐cell resolution by tissue decolorization. Cell. 2014;159:911‐924. [DOI] [PubMed] [Google Scholar]
- 29.Chen H, Landen CN, Li Y, Alvarez RD, Tollefsbol TO. Enhancement of cisplatin‐mediated apoptosis in ovarian cancer cells through potentiating G2/M arrest and p21 upregulation by combinatorial epigallocatechin gallate and sulforaphane. J Oncol. 2013;2013:1‐9. [DOI] [PMC free article] [PubMed] [Google Scholar]
- 30.Huang L, Wong Y, Cai Y, Lung I, Leung C, Burd A. Low‐dose 5‐fluorouracil induces cell cycle G2 arrest and apoptosis in keloid fibroblasts. Br J Dermatol. 2010;163:1181‐1185. [DOI] [PubMed] [Google Scholar]
- 31.Mueller S, Schittenhelm M, Honecker F, et al. Cell‐cycle progression and response of germ cell tumors to cisplatin in vitro. Int J Oncol. 2006;29:471‐479. [PubMed] [Google Scholar]
- 32.Sarin N, Engel F, Kalayda GV, et al. Cisplatin resistance in non‐small cell lung cancer cells is associated with an abrogation of cisplatin‐induced G2/M cell cycle arrest. PLoS One. 2017;12:e0181081. [DOI] [PMC free article] [PubMed] [Google Scholar]
- 33.Miller I, Min M, Yang C, et al. Ki67 is a graded rather than a binary marker of proliferation versus quiescence. Cell Rep. 2018;24:1105‐1112. e1105. [DOI] [PMC free article] [PubMed] [Google Scholar]
- 34.Bacus SS, Gudkov AV, Lowe M, et al. Taxol‐induced apoptosis depends on MAP kinase pathways (ERK and p38) and is independent of p53. Oncogene. 2001;20:147‐155. [DOI] [PubMed] [Google Scholar]
- 35.Choi YH, Yoo YH. Taxol‐induced growth arrest and apoptosis is associated with the upregulation of the Cdk inhibitor, p21WAF1/CIP1, in human breast cancer cells. Oncol Rep. 2012;28:2163‐2169. [DOI] [PubMed] [Google Scholar]
- 36.Saunders DE, Lawrence WD, Christensen C, Wappler NL, Ruan H, Deppe G. Paclitaxel‐induced apoptosis in MCF‐7 breast‐cancer cells. Int J Cancer. 1997;70:214‐220. [DOI] [PubMed] [Google Scholar]
- 37.Blagosklonny MV, Darzynkiewicz Z, Halicka HD, et al. Paclitaxel induces primary and postmitotic G1 arrest in human arterial smooth muscle cells. Cell Cycle. 2004;3:1048‐1054. [PubMed] [Google Scholar]
- 38.Demidenko Z, Kalurupalle S, Hanko C, Lim C, Broude E, Blagosklonny M. Mechanism of G1‐like arrest by low concentrations of paclitaxel: next cell cycle p53‐dependent arrest with sub G1 DNA content mediated by prolonged mitosis. Oncogene. 2008;27:4402‐4410. [DOI] [PubMed] [Google Scholar]
- 39.Giannakakou P, Robey R, Fojo T, Blagosklonny MV. Low concentrations of paclitaxel induce cell type‐dependent p53, p21 and G1/G2 arrest instead of mitotic arrest: molecular determinants of paclitaxel‐induced cytotoxicity. Oncogene. 2001;20:3806‐3813. [DOI] [PubMed] [Google Scholar]
- 40.Patel NM, Nozaki S, Shortle NH, et al. Paclitaxel sensitivity of breast cancer cells with constitutively active NF‐κB is enhanced by IkappaBalpha super‐repressor and parthenolide. Oncogene. 2000;19:4159‐4169. [DOI] [PubMed] [Google Scholar]
- 41.Sakaue‐Sawano A, Yo M, Komatsu N, et al. Genetically encoded tools for optical dissection of the mammalian cell cycle. Mol Cell. 2017;68:626‐640.e625. [DOI] [PubMed] [Google Scholar]
- 42.Susaki EA, Shimizu C, Kuno A, et al. Versatile whole‐organ/body staining and imaging based on electrolyte‐gel properties of biological tissues. Nat Commun. 2020;11:1982. [DOI] [PMC free article] [PubMed] [Google Scholar]
Associated Data
This section collects any data citations, data availability statements, or supplementary materials included in this article.
Supplementary Materials
Supplementary Material


