Abstract
The long reads of Nanopore sequencing permit accurate transcript assembly and ease in discovering novel transcripts with potentially important functions in cancers. The wide adoption of Nanopore sequencing for transcript quantification, however, is largely limited by high costs. To address this issue, we developed a bioinformatics software, NovelQuant, that can specifically quantify long‐read‐assembled novel transcripts with short‐read sequencing data. Nanopore Direct RNA Sequencing was carried out on three hepatocellular carcinoma (HCC) patients’ tumor, matched portal vein tumor thrombus, and peritumor to reconstruct the HCC transcriptome. Then, based on the reconstructed transcriptome, NovelQuant was applied on Illumina RNA sequencing data of 59 HCC patients’ tumor and paired peritumor to quantify novel transcripts. Our further analysis revealed 361 novel transcripts dysregulated in HCC and that 101 of them were significantly associated with prognosis. There were 19 novel prognostic transcripts predicted to be long noncoding RNAs (lncRNAs), and some of them had regulatory targets that were reported to be associated with HCC. Additionally, 42 novel prognostic transcripts were predicted to be protein‐coding mRNAs, and many of them could be involved in xenobiotic metabolism. Moreover, the tumor‐suppressive roles of two representative novel prognostic transcripts, CDO1‐novel (lncRNA) and CYP2A6‐novel (protein‐coding mRNA), were further functionally validated during HCC progression. Overall, the current study shows a possibility of combining long‐ and short‐read sequencing to explore functionally important novel transcripts in HCC with accuracy and cost‐efficiency, which expands the pool of molecular biomarkers that could enhance our understanding of the molecular mechanisms of HCC.
Keywords: CDO1, CYP2A6, hepatocellular carcinoma, Nanopore sequencing, novel transcript
We used Nanopore RNA sequencing to discover novel transcripts in hepatocellular carcinoma (HCC), and developed NovelQuant to specifically quantify novel transcripts. Many of these novel transcripts were further found to be predictive of prognosis and have functional roles in HCC.
1. INTRODUCTION
Hepatocellular carcinoma (HCC), representing the majority of primary liver cancers, is one of the world’s leading malignancies. Despite several therapies available for HCC,1 patients still have a relatively poor prognosis with a 5‐year survival rate of only 18%.2 Hence, a more comprehensive understanding about the molecular mechanism of initiation, progression, and metastasis of HCC is urgently needed to improve its clinical treatments.
Aberrant expression of some transcript isoforms could activate oncogenes or inactivate tumor suppressors, which further leads to carcinogenesis.3 The in‐depth cancer research at the RNA level is largely dependent on the precision and completion of reference transcriptomes. However, many novel transcript isoforms could still remain unidentified in the current releases of reference transcriptomes due to the constraints of conventional Illumina short‐read sequencing in transcript assembly, as the short‐read length (~150 bp) often fails to capture the connectivity between all exons in a transcript.4
Long‐read sequencing, as an alternative to Illumina short‐read sequencing, can continuously sequence a complete strand of polynucleotide, and hence produce long‐read length with more than 15 kbp in RNA sequencing (RNA‐seq).5 Thus, long‐read sequencing has potential to capture the whole length of most of the transcripts in human (median length, ~2500 bp),6 which allows more accurate transcript assembly and the discovery of novel transcripts that are not able to be detected by short reads. Therefore, there is the potential of using the long‐read sequencing to discover novel functional transcripts that can promote our understanding of cancer molecular mechanisms. However, one challenge is that long‐read sequencing, as a nascent sequencing technology, is more costly than Illumina sequencing, so using the long‐read sequencing alone to quantify novel transcripts on a large scale of samples might not be economically feasible.
In this study, in order to achieve cost efficiency, we developed a bioinformatics software, NovelQuant (https://github.com/robinycfang/NovelQuant) that can quantify accurate long‐read‐assembled novel transcripts with cheap Illumina short reads. To investigate novel transcripts in HCC, we first used Nanopore RNA‐seq to obtain long reads from three HCC patients’ tumor, matched portal vein tumor thrombus (PVTT), and peritumor, followed by a reconstruction of the HCC reference transcriptome, which included novel transcripts. NovelQuant was then used to quantify the novel transcripts using Illumina RNA‐seq data of 59 HCC patients’ tumor and paired peritumor. Finally, we discovered two novel prognostic transcripts, one long noncoding RNA (lncRNA) of cysteine dioxygenase type 1 (CDO1‐novel) and one protein‐coding mRNA, of cytochrome P450 family 2 subfamily A member 6 (CYP2A6‐novel), that showed functionalities in HCC.
2. MATERIALS AND METHODS
2.1. Patients enrolled and tissue preparation
In total, 104 HCC patients who underwent surgical resection at Mengchao Hepatobiliary Hospital of Fujian Medical University were enrolled in this study. Tumor (PVTT if present) and peritumor were collected during hepatectomy. RNA was extracted from collected tissues using TRIzol reagent (TransGen Biotech). The collection and usage of human tissues were in accordance with the Declaration of Helsinki and approved by the Institutional Review Board of Mengchao Hepatobiliary Hospital of Fujian Medical University. Informed consent was obtained from all patients enrolled.
2.2. Illumina and Nanopore sequencing of tissues
Illumina RNA sequencing (paired end, 150 bp) was applied to 59 HCC patients’ tumor and paired peritumor. Illumina RNA‐seq and Nanopore Direct RNA Sequencing were applied to another three HCC patients’ tumor, matched PVTT, and peritumor. Details of sequencing and data processing are shown in Document S1.
2.3. Transcript assembly using Nanopore long reads
FLAIR (version 1.4)7 was used to undertake transcript assembly, with the GENCODE annotations (GRCh38 version 32)8 as a reference, applied to only primary alignments in the Nanopore BAM files (Figure 1A, details in Document S1). Alternative splicing events were analyzed using SUPPA2.9
FIGURE 1.
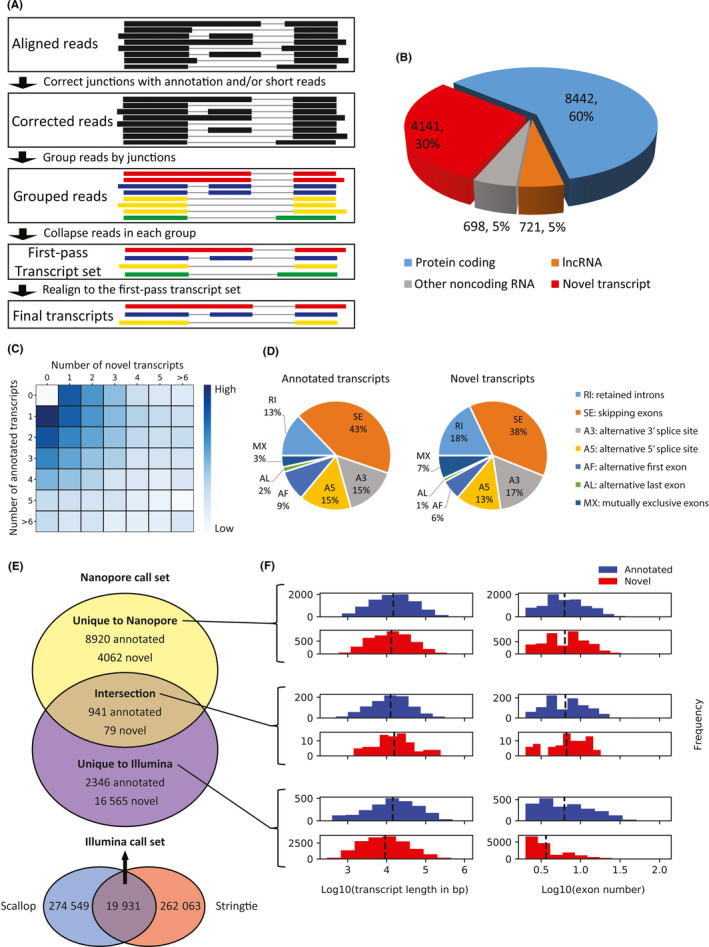
Transcript assembly of hepatocellular carcinoma tissues by Nanopore sequencing. A, Schematics of transcript assembly by FLAIR. B, Distribution of annotated and novel transcripts. lncRNA, long noncoding RNA. C, Number of annotated and novel transcripts in identified expressed genes. D, Distribution of alternative splicing events in annotated and novel transcripts. E, Comparison of identified annotated and novel transcripts between Nanopore and Illumina call sets, and (F) corresponding distribution of transcript length and exon number
2.4. Quantification of novel transcripts using NovelQuant
NovelQuant was developed (detailed schematics in Figure 2 and Document S1) and used to quantify the novel transcripts assembled with Nanopore sequencing data by FLAIR on the Illumina RNA‐seq data of 59 HCC patients’ tumor and paired peritumor. Expression fold change (FC) of novel transcripts in tumor relative to peritumor was calculated in the cohort. Expression of annotated and novel transcripts was normalized by NovelQuant, followed by calculations of the expression percentage of individual transcript in each gene, and hence the expression percentage difference (Δ exp %) between tumor and peritumor. The Wilcoxon signed‐rank test was used to assess the significance of FC and Δ exp %, and the Benjamini‐Hochberg false discovery rate (FDR) was used for multiple testing correction. An FDR‐adjusted P < .05 (|log2FC| > 0.58, ie, FC > 1.5 or < 2/3, in the case of differential expression analysis) were considered to be significant.
FIGURE 2.
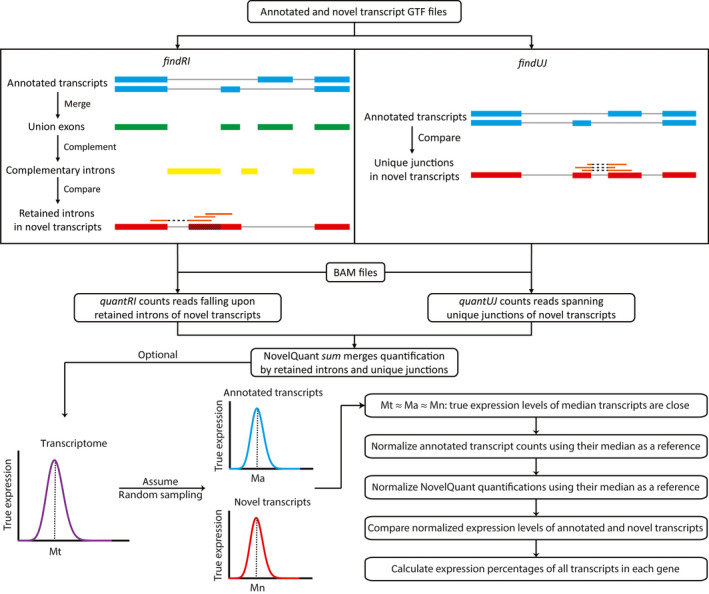
Schematics of NovelQuant. findRI first merges exons of all transcripts (blue) in each gene to form union exons (green), and accordingly finds the complementary introns (yellow) that are then compared with the novel transcript (red) to discover the retained introns (shaded). findUJ compares all the exon‐exon junctions between annotated (blue) and novel (red) transcripts to find the junctions that are uniquely present in the novel transcript. Finally, quanRI and quanUJ count reads (orange) on the retained introns and unique junctions for input BAM files, and the sum mode merges the read counts that are then corrected for the total sequencing depth of each sample. Optionally, NovelQuant can be used to calculate expression percentages of transcripts in each gene. The annotated and novel transcript expression data are assumed to be two random samplings from the transcriptome, so they follow similar distribution and the corresponding medians are close (Mt ≈ Ma ≈ Mn), and hence median transcripts are selected as references for normalization. Once annotated transcript counts and NovelQuant quantifications are normalized separately for their references, the normalized expression levels of annotated and novel transcripts can be compared, and the expression percentages in each gene can be calculated. GTF, gene transfer format
2.5. Clinical associations of novel transcripts
Hepatocellular carcinoma patients were categorized into two groups based on the median expression of each novel transcript in tumor. Using the “survival” (version 3.1.8)10 R package, the association between patient groups and prognosis (overall survival [OS] and recurrence free survival [RFS]) was assessed in a univariate Cox proportional hazard model. Kaplan‐Meier survival curves were constructed with log‐rank P. Fisher’s exact test was used to analyze the association between patient groups and clinicopathological features.
2.6. Coding potentials of novel prognostic transcripts
Coding potentials of the novel prognostic transcripts were predicted by three tools with default arguments: Coding Potential Calculator 2 (CPC2, version 1.0.1),11 Predictor of Long Noncoding RNAs and Messenger RNAs based on K‐mer Scheme (PLEK, version 1.2),12 and Coding‐Noncoding Index (CNCI, version 2).13 Only the novel prognostic transcripts that were predicted to be noncoding or coding simultaneously by all three tools were considered as final noncoding RNA or protein‐coding mRNA candidates, respectively. The novel prognostic noncoding RNAs were used to construct gene regulatory networks (GRNs) (detailed in Document S1). Gene Ontology14 enrichment and Kyoto Encyclopedia of Genes and Genomes15 pathway analyses were undertaken on the parent genes of the novel prognostic mRNAs using R packages “org.Hs.eg.db” (version 3.10.0)16 and “clusterProfiler” (version 3.14.3).17
2.7. Functional validation of representative novel transcripts
To silence the novel transcripts, siRNAs targeting their specific retained intronic regions were designed and synthesized (Table S1). Hep3B cells were transfected with siRNA negative control (si‐NC), si‐CDO1‐novel and si‐CYP2A6‐novel using Lipofectamine 3000 for 48 hours (or 24 hours otherwise indicated), and were further subjected to Illumina RNA‐seq and used in functional assays (detailed in Document S1).
2.8. Statistical analysis
All the statistical analyses were undertaken in R (version 3.6.1) or Python (version 3.7.3). Data are presented as mean ± SEM. Levels of statistical difference are *P < .05, **P < .01, and ***P < .001.
3. RESULTS
3.1. Transcript assembly by Nanopore sequencing and comparison with Illumina sequencing
To comprehensively profile the HCC transcriptome, Nanopore Direct RNA Sequencing was applied on three HCC patients’ tumor, matched PVTT, and peritumor, which resulted in approximately 6.6 million long reads in these nine samples and mapping rates up to approximately 95% in the BAM files (Table S2). FLAIR was then applied on the aligned Nanopore long reads to assemble transcripts (Figure 1A). Single‐exon transcripts were excluded in the downstream analysis due to a potential algorithmic bias of FLAIR in assembling single‐exon transcripts. Ultimately, 14 002 transcripts were successfully identified, of which approximately 60% and 10% were protein‐coding and noncoding transcripts, respectively, that have been previously documented in the GENCODE annotations, whereas approximately 30% were novel multiexon transcripts derived from annotated genes (Figure 1B). Although many genes only expressed one or two annotated transcripts, there were also a great number of genes either expressed only novel transcripts or a combination of the two, which indicates the capacity of Nanopore sequencing to identify more novel alternative splicing (AS) events (Figure 1C). By comparison, the percent of skipping exons in novel transcripts was approximately 5% lower than that in annotated transcripts, while that of retained introns was approximately 5% higher than that in annotated transcripts (Figure 1D). These results indicate that Nanopore sequencing managed to identify a great number of novel transcripts that showed some difference in characteristics from annotated transcripts.
We then compared transcript assemblies between using long and short reads, using the same nine tissue samples (Figure 1E). There was poor agreement in annotated transcripts discovered between Nanopore and Illumina (the intersection between Scallop18 and Stringtie19) call sets, with only 941 identified in both, and there were more annotated transcripts uniquely identified by Nanopore sequencing (8920) than by Illumina sequencing (2346). There was also poor agreement in novel transcripts, with only 79 identified in both call sets. Despite more novel transcripts uniquely found by Illumina (16 565) than Nanopore (4062), we suspect that the Illumina call set might suffer from more false positives, because short reads have limitations in transcript assembly, and even the two Illumina representatives, Stringtie and Scallop, showed poor in‐group agreement. Compared to novel transcripts unique to Illumina, we found that the ones unique to Nanopore were slightly longer, and more interestingly, had many more exons, which implies that Nanopore’s long reads have more advantages in identifying longer transcripts with more complexity in exonic structure (Figure 1F).
3.2. Quantification and clinical associations of novel transcripts
We developed NovelQuant to specifically quantify novel transcripts (Figure 2), and to assess its performance in novel transcript quantification, we ran NovelQuant, Kallisto,20 Salmon,21 and RSEM22 on three simulated RNA‐seq samples with predetermined expression levels of the identified novel transcripts (Table S3). NovelQuant had higher relative difference between estimated and true expression levels than the state‐of‐the‐art quantification software; however, the runtime of NovelQuant for a standard RNA‐seq sample was only approximately 3 minutes, which is only approximately 1% of that used by RSEM, suggesting only a few computational resources are required by NovelQuant.
NovelQuant was then applied on Illumina RNA‐seq of 59 HCC patients’ tumor and paired peritumor (Figure S1), which successfully quantified 773 in a total of 1577 novel transcripts. We examined the expression profiles of novel transcripts in the 59 HCC patients, along with seven human blood cell (GSE15128223) and five human duodenal (GSE14619024) samples (data obtained from Gene Expression Omnibus25) (Figure 3A). The expression profiles of the novel transcripts were divergent between liver, blood cells, and duodena, suggesting that the expression levels of some novel transcripts are tissue‐specific. The novel transcripts also showed distinctly different expression profiles between HCC tumor and peritumor, which suggests that some of the novel transcripts could be potential biomarkers in HCC; however, the expression profiles did not classify the HCC subtypes (whether infected with hepatitis B virus [HBV]). Finally, there were 148 and 213 novel transcripts significantly up‐ and down‐regulated in HCC, respectively (Figure 3B).
FIGURE 3.
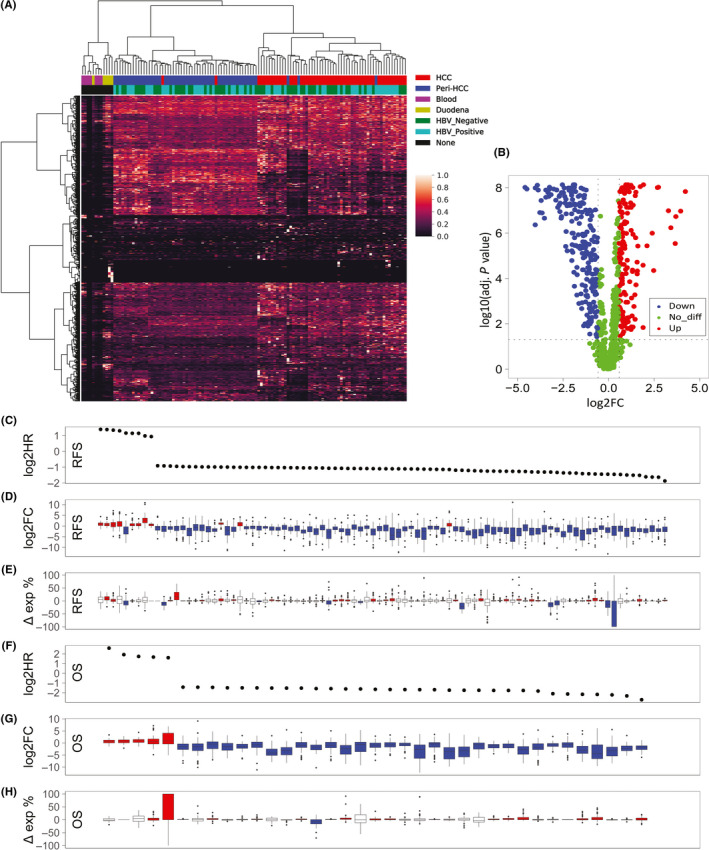
Novel transcript profiling identified in hepatocellular carcinoma (HCC). A, Expression profiles of 874 novel transcripts identified in tumor and paired peritumor from 59 HCC patients, along with seven human blood cell and five human duodenal samples obtained from Gene Expression Omnibus. HBV, hepatitis B virus. B, Differential expression analysis of novel transcripts in tumor and paired peritumor from 59 HCC patients. C, F, Association of novel transcript expression in tumor with prognosis. HR, hazard ratio. D, G, Fold change (FC) of novel transcript expression in tumor relative to peritumor. E, H, Difference of expression percentages (Δ exp %) of novel transcripts between tumor and peritumor. OS, overall survival; RFS, recurrence free survival. Blue, downregulation; red, upregulation; white, no significant difference
We next examined the clinical association of individual dysregulated novel transcripts (Figure 3C‐H; Table S4). In total, there were 101 novel prognostic transcripts (the Wald test, P < .05) and 26 of them were simultaneously associated with both RFS and OS, and the novel transcripts with hazard ratio (HR) greater than 1 and less than 1 were mostly up‐ and downregulated in HCC, respectively. If novel transcript expression is converted to expression percentage in each corresponding parent gene, the expression percentages of the novel prognostic transcripts varied widely from minuscule to 100%, indicating that some novel transcripts were able to exhibit functionalities even with a relatively low percent expression (eg, regulatory noncoding RNAs). Interestingly, the change of expression percentage from peritumor to tumor (Δ exp %) of the novel prognostic transcripts was not correlated to prognosis and FC, which suggests interactive regulation in the expression between annotated and novel transcripts in the same parent gene (ie, sharing regulatory mechanisms).
3.3. Novel prognostic lncRNAs
Some of these identified novel prognostic transcripts could be important noncoding RNAs that regulate other cancer‐associated genes. Our further bioinformatics analysis on the 101 novel prognostic transcripts revealed 19 novel prognostic lncRNA candidates (all longer than 200 bp) (Figure 4A). We than developed a pipeline to establish GRNs involved with these lncRNAs to visualize their potential regulatory targets in HCC (Figures 4B and S2). Finally, there were eight novel prognostic lncRNAs involved in GRNs, and each was found to potentially regulate more than one target mRNAs directly or indirectly through intermediate miRNAs (Figure 4C).
FIGURE 4.
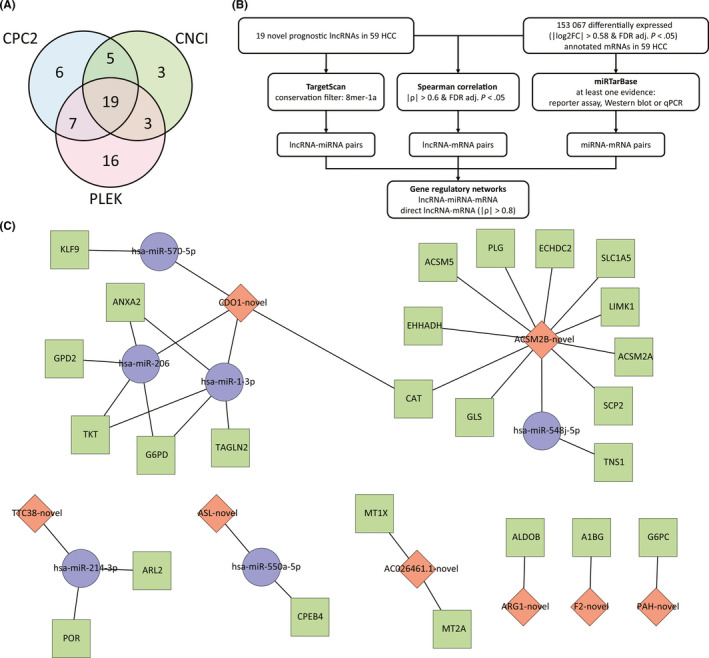
Gene regulatory networks of novel long noncoding RNAs (lncRNAs) identified in hepatocellular carcinoma (HCC). A, Prediction of novel noncoding RNAs using Coding Potential Calculator 2 (CPC2), Coding‐Noncoding Index (CNCI), and Predictor of Long Noncoding RNAs and Messenger RNAs based on K‐mer Scheme (PLEK). B, Schematics of establishment of gene regulatory networks involved with novel lncRNAs. FC, fold change; FDR, false discover rate. C, Gene regulatory networks involved with novel lncRNAs. Blue circle, annotated miRNA; green square, annotated mRNA; red rhombus, novel lncRNA
CDO1‐novel (sequence provided in Table S5) is one of the hubs in GRNs, indicating that it might have important roles in HCC, so we representatively selected CDO1‐novel for further analysis. Three exons in the canonical CDO1 transcript are skipped in CDO1‐novel and a fraction of the intronic region is retained at the 5′‐end, which was verified by Sanger sequencing (Figure 5A). Suggested by ENCODE databases,26 the different transcription start site of CDO1‐novel could be verified by its upstream enriched epigenetic marks, indicating an alternative promoter region. CDO1‐novel was downregulated in HCC based on NovelQuant quantification, and in an independent cohort of HCC patients, quantitative RT‐PCR (qRT‐PCR) again validated the downregulation of CDO1‐novel in tumor, and identified a further downregulation in PVTT relative to tumor, which implies a strong metastatic effect of CDO1‐novel suppression (Figure 5B). Next, we studied the clinical associations of CDO1‐novel using data from the cohort of 59 HCC patients (Table S6), and found that the low‐expression group had a significantly shorter RFS (log‐rank, P = .007) (Figure 5C), a higher chance of vascular invasion (P = .003) (Figure 5D), and poorly differentiated HCC (P = .028) (Figure 5E).
FIGURE 5.
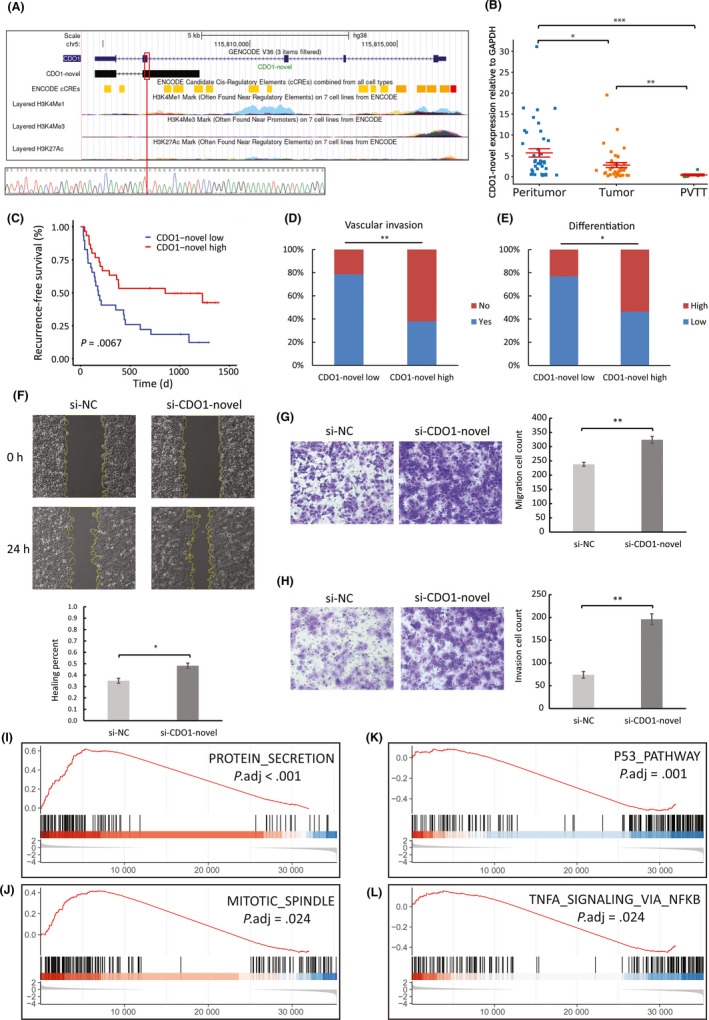
Expression profiling and biological functions of CDO1‐novel in hepatocellular carcinoma (HCC). A, Comparison between annotated and novel CDO1 transcripts, and associated epigenetic data obtained from ENCODE. The novel exon‐retained‐intron junction is denoted by a red vertical line and was validated by Sanger sequencing. B, Quantitative RT‐PCR analysis of CDO1‐novel expression in peritumor (n = 41), tumor (n = 39), and portal vein tumor thrombus (PVTT) (n = 7) of a different cohort of 42 HCC patients (one‐way ANOVA and Tukey’s post‐hoc test). C‐F, Association of CDO1‐novel expression in tumor with prognoses and clinicopathological features using data of the 59 patients. F, Wound healing migration assays of negative control (si‐NC) and CDO1‐novel silenced (si‐CDO1‐novel) cells (n = 3). Transwell migration (G) and invasion (H) assays of si‐NC and si‐CDO1‐novel cells (n = 3). I‐L, Selection of the top enriched hallmark gene sets from Molecular Signatures Database (MSigDB) analyzed with Gene Set Enrichment Analysis (GSEA). The y axis indicates enrichment scores, hits, and ranking metric scores from top to bottom. *P < .05, **P < .01, ***P < .001
In order to verify the functional roles of CDO1‐novel in HCC, we undertook experimental assays comparing negative control (si‐NC) and CDO1‐novel silenced (si‐CDO1‐novel) Hep3B cells (Figure S3). There was no difference in cell proliferation between si‐NC and si‐CDO1‐novel cells (Figure S4). Transwell assays showed that silencing CDO1‐novel significantly promoted tumor cell migration (t test, P = .004) (Figure 5G), which was also validated by wound healing assays (t test, P = .014) (Figure 5F), as well as tumor cell invasion (t test, P = .002) (Figure 5H). Gene Set Enrichment Analysis (GSEA)27, 28 using hallmark gene sets from the Molecular Signatures Database (MSigDB)29 undertaken on silenced cells (si‐CDO1‐novel vs si‐NC) revealed significant hallmarks in response to CDO1‐novel silencing (Figure S5). The top activated hallmarks, including protein secretion (Figure 5I) and mitotic spindle (Figure 5J), indicate activated tumorigenesis, whereas the top suppressed ones, including P53 pathway (Figure 5K) and TNFA signaling via NFKB (Figure 5L), indicate compromised immune response. These results suggest that CDO1‐novel might have regulatory effects, while its downregulation could lead to aberrant expression of the regulatory targets, which could be associated with carcinogenesis and metastasis, and hence eventually result in poor prognosis of HCC patients.
3.4. Novel prognostic protein‐coding mRNAs
Other novel prognostic transcripts might be translated into novel proteins that have functional roles in HCC. From the 101 novel prognostic transcripts, we identified 42 novel prognostic mRNA candidates with protein‐coding potentials (Figure 6A). The novel protein isoforms may interact with the canonical transcript/protein isoforms of their parent genes, so to predict the functions and pathways that novel transcripts might be associated with, we undertook enrichment analysis using parent genes of the 42 novel prognostic mRNAs, and found that many novel prognostic mRNAs could be associated with metabolism of xenobiotics (Figure 6B,C).
FIGURE 6.
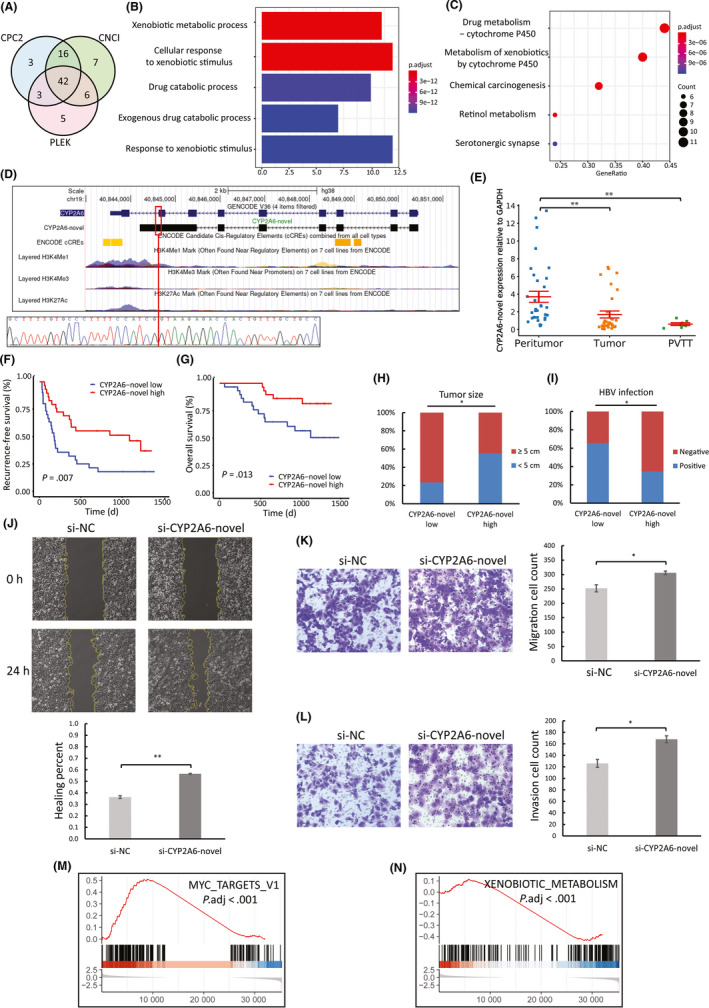
Expression profiling and biological functions of CYP2A6‐novel in hepatocellular carcinoma (HCC). A, Prediction of novel protein‐coding mRNAs using Coding Potential Calculator 2 (CPC2), Coding‐Noncoding Index (CNCI), and Predictor of Long Noncoding RNAs and Messenger RNAs based on K‐mer Scheme (PLEK). B, C, Gene Ontology and Kyoto Encyclopedia of Genes and Genomes analyses of the 42 novel prognostic mRNAs. D, Comparison between annotated and novel CYP2A6 transcripts, and associated epigenetic data obtained from ENCODE. The novel exon‐retained‐intron junction is denoted by a red vertical line and was validated by Sanger sequencing. E, Quantitative RT‐PCR analysis of CYP2A6‐novel expression in peritumor (n = 33), tumor (n = 32), and portal vein tumor thrombus (PVTT) (n = 7) of a different cohort of 42 HCC patients (one‐way ANOVA and Tukey post‐hoc). F‐I, Association of CYP2A6‐novel expression in tumor with prognosis and clinicopathological features using data of 59 HCC patients. J, Wound healing migration assays of negative control (si‐NC) and CYP2A6‐novel silenced (si‐CYP2A6‐novel) cells (n = 3). Transwell migration (K) and invasion (L) assays of si‐NC and si‐CYP2A6‐novel cells (n = 3). M, N, Selection of the top enriched hallmark gene sets from Molecular Signatures Database (MSigDB) analyzed with Gene Set Enrichment Analysis (GSEA). The y axis indicates enrichment scores, hits, and ranking metric scores from top to bottom. *P < .05, **P < .01
CYP2A6, one of the CYP family enzymes, is highly expressed in liver and is responsible for metabolizing xenobiotics and a wide range of therapeutic drugs.30 We speculate that the novel protein‐coding mRNA transcribed from CYP2A6, CYP2A6‐novel (sequence provided in Table S5), might also have important functions in HCC, and therefore, selected for further investigations. The canonical CYP2A6 protein has 494 amino acids (aa) in total, while some 3′ intronic regions of the annotated CYP2A6 transcripts are retained in CYP2A6‐novel (verified by Sanger sequencing), which alters some of the 3′ aa sequence, induces a premature stop codon and hence shortens the novel CYP2A6 protein to 443 aa (Figure 6D and Table S7). According to ENCODE databases, the different transcription end site of CYP2A6‐novel may be supported by its downstream enriched epigenetic marks, which implies a potential alternative binding site for transcription termination factors. In an independent cohort of HCC patients, qRT‐PCR validated downregulation of CYP2A6‐novel in tumor (previously observed in NovelQuant analysis) and PVTT relative to peritumor (Figure 6E). Next, we studied the clinical associations of CYP2A6‐novel using data from the cohort of 59 HCC patients (Table S8), and found that the low‐expression group had shorter RFS (log‐rank, P = .007) (Figure 6F) and OS (log‐rank, P = .013) (Figure 6G), a larger tumor size (P = .017) (Figure 6H), and more HBV infection cases (P = .032) (Figure 6I).
In order to verify the functional roles of CYP2A6‐novel in HCC, we undertook experimental assays comparing si‐NC and si‐CYP2A6‐novel Hep3B cells (Figure S3). There was no difference in cell proliferation between si‐NC and si‐ CYP2A6‐novel cells (Figure S4). Transwell assays showed that silencing CYP2A6‐novel significantly promoted tumor cell migration (t test, P = .018) (Figure 6K), which was also validated by wound healing assays (t test, P < .001) (Figure 6J), as well as tumor cell invasion (t test, P = .01) (Figure 6L). In addition to similar oncogenic hallmarks observed in CDO1‐novel silenced assays, GSEA on silenced cells (si‐CYP2A6‐novel vs si‐NC) showed (Figure S6), in response to CYP2A6‐novel silencing, activated MYC Targets V1 (Figure 6M), indicating tumorigenesis, and interestingly suppressed Xenobiotic Metabolism (Figure 6N), which may again verify that the CYP2A6‐novel protein isoform is also responsible for metabolizing xenobiotics. Tegafur is an oral chemotherapeutic drug that is metabolized to 5‐fluorouracil (5‐FU) by the canonical CYP2A6 protein.31 Interestingly, our assays indicate that si‐CYP2A6 cells were less sensitive to tegafur treatments than si‐NC cells, implying that the CYP2A6‐novel protein isoform could still retain some of the xenobiotic metabolism functions of the canonical CYP2A6 protein (Figure S6). These results suggest that downregulation of CYP2A6‐novel could have oncogenic and metastatic effects, and impair cellular efficiency in metabolizing xenobiotic drugs.
4. DISCUSSION
Identification of transcripts following RNA‐seq has shown some limitations with conventional Illumina sequencing due to its short reads, which can be overcome by long‐read sequencing as its long reads have a higher chance to represent the whole length of transcripts. Indeed, our data suggest that transcript assemblies by short reads might suffer from many false positives, whereas long reads have more advantages in identifying structurally complex long novel transcripts. The GENCODE consortium has started to implement long reads to polish and expand their reference annotations,8, 32 and we have also seen many other studies successfully discover a great number of novel transcripts in human using long‐read sequencing.3, 6, 33, 34 Together, these suggest that long‐read sequencing is a potent tool for accurate transcript assemblies and capable of identifying more novel transcripts.
Short reads might not uniquely map to one single transcript due to high sequence similarity between transcript isoforms of a gene, which poses challenges to transcript quantification. Apparently, using long reads for transcript quantification might produce the most accurate results. However, the wide adoption of long‐read sequencing for transcript quantification, especially for large sample sizes, is largely constrained by its higher sequencing costs and lower throughput compared with short‐read sequencing. To address these issues, we developed NovelQuant, with which one can provide a reference transcriptome containing novel transcripts that is assembled from a small number of long‐read sequencing data, and then quantify the novel transcripts with the read alignments from a large number of short‐read sequencing data. As such, the associated costs for quantification are largely reduced. In addition, NovelQuant has shorter runtime than the state‐of‐the‐art quantification software, which minimizes the usage of computational resources when undertaking quantification in large datasets. Using NovelQuant on HCC and paired peritumor from 59 patients with Illumina RNA‐seq, we successfully quantified approximately 50% of the quantifiable novel transcripts (773 of 1577) that have retained introns and/or unique junctions, implying that the NovelQuant algorithm represents an efficient bioinformatics tool for novel transcript quantification, and provides possibilities for further downstream analysis.
In fact, a large number of the previously undocumented transcripts exhibit critical cellular functions, thus, their aberrant expression could contribute to carcinogenesis, which has been observed in many studies.3, 35, 36, 37 In the current study, we also identified many novel transcripts that were associated with prognosis and showed oncogenic or tumor‐suppressive effects in HCC. Some of these novel prognostic transcripts could be potential lncRNAs with important regulatory functions. Gene regulatory networks involving the novel prognostic lncRNAs showed that most of the associated regulatory targets have been reported to be relevant to HCC,38, 39, 40, 41 whereas the HCC associations of some other regulatory targets, such as miR‐550a‐5p, TNS1, and SCP2, have not been previously documented, which suggests that the discovery of novel lncRNAs might provide leads to reveal new molecular mechanisms of these regulatory targets in HCC. One of the hubs in GRNs, CDO1‐novel, is a novel lncRNA transcribed from the CDO1 gene. CDO1 is a tumor suppressor that encodes an intracellular metalloenzyme that converts cysteine to cysteine sulfinic acid, which is then converted to a physiologically important amino acid, taurine.42, 43 Our data suggest that CDO1‐novel is also a tumor suppressor that is downregulated in HCC. Surprisingly, CDO1‐novel was further downregulated in PVTT relative to HCC, and patients with low expression of CDO1‐novel showed more vascular invasion. Cell assays also revealed strong migration and invasion following CDO1‐novel silencing. Gene regulatory networks indicated that CDO1‐novel might upregulate KLF9 and downregulate TKT, and previous studies have reported that dysregulation of these two genes is associated with increased metastasis and invasion.44, 45, 46 These results suggest that CDO1‐novel, as a potential lncRNA, could regulate other oncogenes or tumor‐suppressors, and the associated aberrant expression could produce metastatic and invasive effects, and eventually lead to poor prognosis.
Some of the novel prognostic transcripts showed strong protein‐coding potentials, and a number of them might be associated with metabolism of xenobiotics. CYP2A6 is an enzyme that is highly expressed in liver and is responsible for metabolizing xenobiotics and a wide range of therapeutic drugs.30 We identified a novel prognostic protein‐coding mRNA of CYP2A6, CYP2A6‐novel, which is a tumor suppressor and downregulated in HCC. Our assays verified the oncogenic effect of CYP2A6‐novel downregulation, as well as the role of CYP2A6‐novel in xenobiotic metabolism. Although approximately 20% of sequences differ at the 3′‐end between the canonical and novel CYP2A6, we found that, like the canonical CYP2A6 protein, the CYP2A6‐novel protein might still be able to convert tegafur, an antitumor prodrug, to 5‐FU, and thus suppress tumor cell proliferation in HCC. Protein isoforms from the same parent gene, albeit sequentially similar, sometimes show very different,47 or even opposite, functions.48 Indeed, the enriched hallmark of Xenobiotics Metabolism in the GSEA results suggests protein‐protein interactions between the CYP2A6‐novel protein isoform and other xenobiotic‐metabolizing enzymes, which has not been observed in the canonical CYP2A6 protein. Further functional investigations should be undertaken to reveal this potential new interactive function of CYP2A6‐novel.
In conclusion, the current study shows that Nanopore sequencing was capable of accurately identifying novel transcripts. NovelQuant, taking advantage of accurate long‐read‐based transcriptome assembly and less costly short‐read sequencing, is presented as a cost‐efficient tool to specifically quantify novel transcripts. These novel transcripts could have important cellular functions, and their dysregulation in HCC could lead to poor prognoses. The discovery of novel transcripts may provide more opportunities in promoting our understanding of molecular mechanisms and assisting with the development of biomarkers in HCC or other cancers.
DISCLOSURE
The authors declare no conflict of interest.
Supporting information
Fig S1‐S7
Table S1‐S8
Supplementary Material
ACKNOWLEDGMENTS
This work was supported by Joint Funds for the Innovation of Science and Technology, Fujian Province (grant number 2019Y9047), National Natural Science Foundation of China (grant number 81802413), Regional Development Project of Fujian Province (grant number 2019Y3001), and the Scientific Foundation of the Fuzhou Health Commission (grant number 2019‐S‐wt3).
Fang Y, Chen G, Chen F, et al. Accurate transcriptome assembly by Nanopore RNA sequencing reveals novel functional transcripts in hepatocellular carcinoma. Cancer Sci. 2021;112:3555–3568. 10.1111/cas.15058
Yuanchang Fang and Geng Chen contributed equally to this work.
Funding information:
Joint Funds for the Innovation of Science and Technology, Fujian Province, Grant/Award Number: 2019Y9047; National Natural Science Foundation of China, Grant/Award Number: 81802413; Regional Development Project of Fujian Province, Grant/Award Number: 2019Y3001; Scientific Foundation of the Fuzhou Health Commission, Grant/Award Number: 2019‐S‐wt3.
Contributor Information
Zhixiong Cai, Email: caizhixiong1985@163.com.
Xiaolong Liu, Email: xiaoloong.liu@gmail.com.
DATA AVAILABILITY STATEMENT
The sequencing data reported in this paper have been deposited in the Genome Sequence Archive in BIG Data Center, Beijing Institute of Genomics (BIG), Chinese Academy of Sciences, under accession numbers HRA000914 and HRA000464, which can be accessed at https://bigd.big.ac.cn/gsa‐human.
REFERENCES
- 1.Villanueva A. Hepatocellular carcinoma. N Engl J Med. 2019;380:1450‐1462. [DOI] [PubMed] [Google Scholar]
- 2.Jemal A, Ward EM, Johnson CJ, et al. Annual report to the nation on the status of cancer, 1975–2014, featuring survival. J Natl Cancer Inst. 2017;109(9):1975‐2014. [DOI] [PMC free article] [PubMed] [Google Scholar]
- 3.Chen H, Gao F, He M, et al. Long‐read RNA sequencing identifies alternative splice variants in hepatocellular carcinoma and tumor‐specific isoforms. Hepatology. 2019;70:1011‐1025. [DOI] [PMC free article] [PubMed] [Google Scholar]
- 4.Steijger T, Abril JF, Engström PG, et al. Assessment of transcript reconstruction methods for RNA‐seq. Nat Methods. 2013;10:1177‐1184. [DOI] [PMC free article] [PubMed] [Google Scholar]
- 5.Bayega A, Wang YC, Oikonomopoulos S, Djambazian H, Fahiminiya S, Ragoussis J. Transcript profiling using long‐read sequencing technologies. Methods Mol Biol. 2018;1783:121‐147. [DOI] [PubMed] [Google Scholar]
- 6.Au KF, Sebastiano V, Afshar PT, et al. Characterization of the human ESC transcriptome by hybrid sequencing. Proc Natl Acad Sci USA. 2013;110:E4821‐E4830. [DOI] [PMC free article] [PubMed] [Google Scholar]
- 7.Tang AD, Soulette CM, van Baren MJ, et al. Full‐length transcript characterization of SF3B1 mutation in chronic lymphocytic leukemia reveals downregulation of retained introns. Nat Commun. 2020;11:1438. [DOI] [PMC free article] [PubMed] [Google Scholar]
- 8.Frankish A, Diekhans M, Ferreira A‐M, et al. GENCODE reference annotation for the human and mouse genomes. Nucleic Acids Res. 2019;47:D766‐D773. [DOI] [PMC free article] [PubMed] [Google Scholar]
- 9.Trincado JL, Entizne JC, Hysenaj G, et al. SUPPA2: fast, accurate, and uncertainty‐aware differential splicing analysis across multiple conditions. Genome Biol. 2018;19:40. [DOI] [PMC free article] [PubMed] [Google Scholar]
- 10.Therneau TM, Grambsch PM. Modeling Survival Data: Extending the Cox Model. New York: Springer; 2000. [Google Scholar]
- 11.Kang Y‐J, Yang D‐C, Kong L, et al. CPC2: a fast and accurate coding potential calculator based on sequence intrinsic features. Nucleic Acids Res. 2017;45:W12‐W16. [DOI] [PMC free article] [PubMed] [Google Scholar]
- 12.Li A, Zhang J, Zhou Z. PLEK: a tool for predicting long non‐coding RNAs and messenger RNAs based on an improved k‐mer scheme. BMC Bioinformatics. 2014;15:311. [DOI] [PMC free article] [PubMed] [Google Scholar]
- 13.Sun L, Luo H, Bu D, et al. Utilizing sequence intrinsic composition to classify protein‐coding and long non‐coding transcripts. Nucleic Acids Res. 2013;41:e166. [DOI] [PMC free article] [PubMed] [Google Scholar]
- 14.Ashburner M, Ball CA, Blake JA, et al. Gene ontology: tool for the unification of biology. The Gene Ontology Consortium. Nat Genet. 2000;25:25‐29. [DOI] [PMC free article] [PubMed] [Google Scholar]
- 15.Kanehisa M, Goto S. KEGG: kyoto encyclopedia of genes and genomes. Nucleic Acids Res. 2000;28:27‐30. [DOI] [PMC free article] [PubMed] [Google Scholar]
- 16.Carlson M org.Hs.eg.db: Genome wide annotation for Human. R package version 3.10.0; 2019.
- 17.Yu G, Wang LG, Han Y, He QY. clusterProfiler: an R package for comparing biological themes among gene clusters. Omics. 2012;16:284‐287. [DOI] [PMC free article] [PubMed] [Google Scholar]
- 18.Shao M, Kingsford C. Accurate assembly of transcripts through phase‐preserving graph decomposition. Nat Biotechnol. 2017;35:1167‐1169. [DOI] [PMC free article] [PubMed] [Google Scholar]
- 19.Pertea M, Pertea GM, Antonescu CM, Chang TC, Mendell JT, Salzberg SL. StringTie enables improved reconstruction of a transcriptome from RNA‐seq reads. Nat Biotechnol. 2015;33:290‐295. [DOI] [PMC free article] [PubMed] [Google Scholar]
- 20.Bray NL, Pimentel H, Melsted P, Pachter L. Near‐optimal probabilistic RNA‐seq quantification. Nat Biotechnol. 2016;34:525‐527. [DOI] [PubMed] [Google Scholar]
- 21.Patro R, Duggal G, Love MI, Irizarry RA, Kingsford C. Salmon provides fast and bias‐aware quantification of transcript expression. Nat Methods. 2017;14:417‐419. [DOI] [PMC free article] [PubMed] [Google Scholar]
- 22.Li B, Dewey CN. RSEM: accurate transcript quantification from RNA‐Seq data with or without a reference genome. BMC Bioinformatics. 2011;12:323. [DOI] [PMC free article] [PubMed] [Google Scholar]
- 23.Antonaros F, Zenatelli R, Guerri G, et al. The transcriptome profile of human trisomy 21 blood cells. Hum Genomics. 2021;15:25. [DOI] [PMC free article] [PubMed] [Google Scholar]
- 24.van der Graaf A, Zorro MM, Claringbould A, et al. Systematic prioritization of candidate genes in disease loci identifies TRAFD1 as a master regulator of IFNgamma signaling in celiac disease. Front Genet. 2020;11:562434. [DOI] [PMC free article] [PubMed] [Google Scholar]
- 25.Edgar R, Domrachev M, Lash AE. Gene expression omnibus: NCBI gene expression and hybridization array data repository. Nucleic Acids Res. 2002;30:207‐210. [DOI] [PMC free article] [PubMed] [Google Scholar]
- 26.Consortium EP . An integrated encyclopedia of DNA elements in the human genome. Nature. 2012;489:57‐74. [DOI] [PMC free article] [PubMed] [Google Scholar]
- 27.Mootha VK, Lindgren CM, Eriksson KF, et al. PGC‐1alpha‐responsive genes involved in oxidative phosphorylation are coordinately downregulated in human diabetes. Nat Genet. 2003;34:267‐273. [DOI] [PubMed] [Google Scholar]
- 28.Subramanian A, Tamayo P, Mootha VK, et al. Gene set enrichment analysis: a knowledge‐based approach for interpreting genome‐wide expression profiles. Proc Natl Acad Sci USA. 2005;102:15545‐15550. [DOI] [PMC free article] [PubMed] [Google Scholar]
- 29.Liberzon A, Subramanian A, Pinchback R, Thorvaldsdottir H, Tamayo P, Mesirov JP. Molecular signatures database (MSigDB) 3.0. Bioinformatics. 2011;27:1739‐1740. [DOI] [PMC free article] [PubMed] [Google Scholar]
- 30.McDonagh EM, Wassenaar C, David SP, et al. PharmGKB summary: very important pharmacogene information for cytochrome P‐450, family 2, subfamily A, polypeptide 6. Pharmacogenet Genomics. 2012;22:695‐708. [DOI] [PMC free article] [PubMed] [Google Scholar]
- 31.Ikeda K, Yoshisue K, Matsushima E, et al. Bioactivation of tegafur to 5‐fluorouracil is catalyzed by cytochrome P‐450 2A6 in human liver microsomes in vitro. Clin Cancer Res. 2000;6:4409‐4415. [PubMed] [Google Scholar]
- 32.Lagarde J, Uszczynska‐Ratajczak B, Carbonell S, et al. High‐throughput annotation of full‐length long noncoding RNAs with capture long‐read sequencing. Nat Genet. 2017;49:1731‐1740. [DOI] [PMC free article] [PubMed] [Google Scholar]
- 33.Cheng Y‐W, Chen Y‐M, Zhao Q‐Q, et al. Long read single‐molecule real‐time sequencing elucidates transcriptome‐wide heterogeneity and complexity in esophageal squamous cells. Front Genet. 2019;10:915. [DOI] [PMC free article] [PubMed] [Google Scholar]
- 34.Kuo RI, Cheng Y, Zhang R, et al. Illuminating the dark side of the human transcriptome with long read transcript sequencing. BMC Genomics. 2020;21:751. [DOI] [PMC free article] [PubMed] [Google Scholar]
- 35.Good CR, Madzo J, Patel B, et al. A novel isoform of TET1 that lacks a CXXC domain is overexpressed in cancer. Nucleic Acids Res. 2017;45:8269‐8281. [DOI] [PMC free article] [PubMed] [Google Scholar]
- 36.Zhang J, McCastlain K, Yoshihara H, et al. Deregulation of DUX4 and ERG in acute lymphoblastic leukemia. Nat Genet. 2016;48:1481‐1489. [DOI] [PMC free article] [PubMed] [Google Scholar]
- 37.Zheng Q, Zhao J, Yu H, et al. Tumor‐specific transcripts are frequently expressed in hepatocellular carcinoma with clinical implication and potential function. Hepatology. 2020;71:259‐274. [DOI] [PubMed] [Google Scholar]
- 38.Pang C, Huang G, Luo K, et al. miR‐206 inhibits the growth of hepatocellular carcinoma cells via targeting CDK9. Cancer Med. 2017;6:2398‐2409. [DOI] [PMC free article] [PubMed] [Google Scholar]
- 39.Li Y, Li Y, Chen Y, et al. MicroRNA‐214‐3p inhibits proliferation and cell cycle progression by targeting MELK in hepatocellular carcinoma and correlates cancer prognosis. Cancer Cell Int. 2017;17:102. [DOI] [PMC free article] [PubMed] [Google Scholar]
- 40.Sobolewski C, Abegg D, Berthou F, et al. S100A11/ANXA2 belongs to a tumour suppressor/oncogene network deregulated early with steatosis and involved in inflammation and hepatocellular carcinoma development. Gut. 2020;69:1841‐1854. [DOI] [PubMed] [Google Scholar]
- 41.Yang Y, Lu Q, Shao X, et al. Development of a three‐gene prognostic signature for hepatitis B virus associated hepatocellular carcinoma based on integrated transcriptomic analysis. J Cancer. 2018;9:1989‐2002. [DOI] [PMC free article] [PubMed] [Google Scholar]
- 42.Choi J‐I, Cho E‐H, Kim SB, et al. Promoter methylation of cysteine dioxygenase type 1: gene silencing and tumorigenesis in hepatocellular carcinoma. Ann Hepatobiliary Pancreat Surg. 2017;21:181‐187. [DOI] [PMC free article] [PubMed] [Google Scholar]
- 43.Deckers IA, Schouten LJ, Van Neste L, et al. Promoter methylation of CDO1 identifies clear‐cell renal cell cancer patients with poor survival outcome. Clin Cancer Res. 2015;21:3492‐3500. [DOI] [PMC free article] [PubMed] [Google Scholar]
- 44.Li Y, Sun Q, Jiang M, et al. KLF9 suppresses gastric cancer cell invasion and metastasis through transcriptional inhibition of MMP28. FASEB J. 2019;33:7915‐7928. [DOI] [PubMed] [Google Scholar]
- 45.Qin Z, Xiang C, Zhong F, et al. Transketolase (TKT) activity and nuclear localization promote hepatocellular carcinoma in a metabolic and a non‐metabolic manner. J Exp Clin Cancer Res. 2019;38:154. [DOI] [PMC free article] [PubMed] [Google Scholar]
- 46.Zhang R, Ye J, Huang H, Du X. Mining featured biomarkers associated with vascular invasion in HCC by bioinformatics analysis with TCGA RNA sequencing data. Biomed Pharmacother. 2019;118:109274. [DOI] [PubMed] [Google Scholar]
- 47.Malaney P, Uversky VN, Dave V. PTEN proteoforms in biology and disease. Cell Mol Life Sci. 2017;74:2783‐2794. [DOI] [PMC free article] [PubMed] [Google Scholar]
- 48.Revil T, Toutant J, Shkreta L, Garneau D, Cloutier P, Chabot B. Protein kinase C‐dependent control of Bcl‐x alternative splicing. Mol Cell Biol. 2007;27:8431‐8441. [DOI] [PMC free article] [PubMed] [Google Scholar]
Associated Data
This section collects any data citations, data availability statements, or supplementary materials included in this article.
Supplementary Materials
Fig S1‐S7
Table S1‐S8
Supplementary Material
Data Availability Statement
The sequencing data reported in this paper have been deposited in the Genome Sequence Archive in BIG Data Center, Beijing Institute of Genomics (BIG), Chinese Academy of Sciences, under accession numbers HRA000914 and HRA000464, which can be accessed at https://bigd.big.ac.cn/gsa‐human.


