Abstract
Epithelial–mesenchymal transition (EMT) plays an important role in tissue fibrosis following chronic exposure to hyperglycemia. This study investigates the role of chronic diabetes in regulating tuberin/snail/AMPK to enhance EMT and increase renal fibrosis. A new mouse model of db/db/TSC2 +/− was generated by backcrossing db/db mice and TSC2 +/− mice. Wild type (WT), db/db, TSC2 +/− and dbdb/TSC2 +/− mice were sacrificed at ages 6 and 8 months old. Tuberin protein level was significantly decreased in kidneys from diabetic compared to WT mice at both ages. In addition, tuberin and E‐cadherin protein levels were significantly decreased in dbdb/TSC2 +/− compared to TSC2 +/− and db/db mice. In contrast, p‐PS6K, NFkB, snail, vimentin, fibronectin, and α‐SMA protein levels were significantly increased in dbdb/TSC2 +/− compared to db/db and TSC2 +/− mice at ages 6 and 8 months. Both downregulation of AMPK by DN‐AMPK and downregulation of tuberin by siRNA resulted in increased NFkB, snail, and fibronectin protein expression and decreased E‐cadherin protein expression in mouse primary renal proximal tubular cells. Interestingly, downregulation of snail by siRNA increased tuberin expression via feedback through activation of AMPK and reversed the expression of epithelial proteins such as E‐cadherin as well as mesenchymal proteins such as fibronectin, NF‐KB, vimentin, and α‐SMA in mouse primary renal proximal tubular cells isolated from kidneys of four mice genotypes. The data show that chronic diabetes significantly decreases tuberin expression and that provides strong evidence that tuberin is a major key protein involved in regulating EMT. These data also demonstrated a novel role for snail in regulating of AMPK/tuberin to enhance EMT and renal cell fibrosis in diabetes.
Keywords: AMPK, diabetes, EMT, fibronectin, NFkb, snail, tuberin
Abbreviations
- BP
base pair
- DN‐AMPK
dominate negative AMPK
- EMT
Epithelial–mesenchymal transition
- H&E
Hematoxylin and eosin
- HG
high glucose
- MCT cells
mouse proximal tubular cells
- mTOR
mammalian target of rapamycin
- NG
normal glucose
- PAS
Periodic acid–Schiff
- PCR
polymerase chain reaction
- PI
Propidium iodide
- PTE cells
renal proximal tubular epithelial cells
- siRNA
small interfering RNA
- TSC2
Tuberous sclerosis complex 2
- WT
wild type
1. INTRODUCTION
Epithelial–mesenchymal transition (EMT) plays a critical role in diabetic kidney fibrosis.1, 2, 3 EMT also features in tissue fibrosis associated with inflammation and wound healing.4, 5, 6 As EMT proceeds, epithelial cells lose markers characteristic of epithelial cells, such as E‐cadherin, keratin and B‐catenin, and acquire mesenchymal cell markers, such as vimentin, α‐SMA, and fibronectin.
Snail is a member of the zinc finger‐type superfamily of transcription factors, which are key factors in initiating EMT.7 Several lines of evidence indicate that snail in particular has an important role in initiating EMT.5, 6, 7, 8, 9, 10 Knockdown of snail leads to failure of EMT, and snail is thought to regulate EMT through repression of E‐cadherin in both arthropod and mammalian lineages.8 Snail can be upregulated by either hypoxia or high glucose conditions, with the combination of both having an additive effect, consistent with independent upstream activation pathways for the two stimuli.9 In addition, increased snail and α‐SMA expression, and decreased E‐cadherin expression, in HK2 cells treated with high glucose can be reversed by Tanshinone IIA, a drug used for the treatment of cardiovascular diseases.10 On the other hand, NFkB plays an important role in regulating EMT by repressing the expression of epithelial proteins and enhancing expression of mesenchymal proteins.11, 12
Cadherins are a class of type‐1 transmembrane proteins that play a major role in cell adhesion, by forming adherens junctions to bind cells and tissues together in a calcium‐dependent manner. Cells lacking tuberin fail to localize polycystin‐1 and E‐cadherin appropriately to these junctions.13 In renal tubular proximal epithelial cells, quercetin markedly ameliorates EMT induced by high glucose, as well as renal fibrosis induced by diabetes, and these effects are associated with inhibition of two transcriptional factors (snail and twist) and activation of mTORC1/p70S6K.14
Vimentin is an intermediate filament protein found primarily in mesenchyme, where it functions to maintain cell and tissue integrity.15 Vimentin also participates in cytoskeletal architecture.16 A major characteristic of EMT is the switch to expression and predominance of vimentin. This switch of intermediate filaments also impairs local adhesion stability and cytoskeleton distribution, characteristics associated with increased cell mobility and invasiveness, which are features of EMT in cancer cells.17, 18 TGF‐β1‐induced mesenchymal proteins, including vimentin, and loss of E‐cadherin occur in the proximal tubule under diabetic conditions, resulting in renal damage.19 Vimentin and fibronectin are expressed at high levels in the kidney sections of diabetic patients, whereas these proteins are present at very low or undetectable levels in normal kidney sections of healthy subjects.20
In this study, the mechanism(s) by which chronic hyperglycemia enhances EMT to increase chronic renal fibrosis was investigated. We examined the role of chronic hyperglycemia in regulating EMT and renal fibrosis in the context of tuberin deficiency, by cross‐breeding diabetic mice (db/db) with TSC2 +/− mice, thus generating a new mouse model (db/db/TSC2 +/−).
2. MATERIALS AND METHODS
2.1. Breeding and genotyping
Male db/db mice (Strain BKC. Cg.m +/+Leprdb/J, C57BL/6J background) and wild‐type mice were purchased from Jackson Laboratory. TSC2 +/−(C57BL/6J background) mice generated by Ondo et al21 were received from Jackson Laboratory. We backcrossed db/db and TSC2 +/− mice to generate a new strain of mouse model (dbdb/TSC2 +/−). Mice were obtained with recommended breeding diet and the cages with pregnant females were housed in special breeding cages. The ear snips obtained from litters about 4–6 weeks old and were used to identify their genotypes using a PCR/restriction‐length polymorphism assay. Purified DNA from ear tissues was subjected to PCR amplification using the following primers and conditions. The primers used for TSC2 genotyping were H162‐CAAACCCACCTCCTCAAGCTTC, H163‐AATGCGGCCTCAACAATCG and H164‐AGACTGCCTTGGGAAAAGCG.21 The primers for db/db genotyping were ‐F‐AGAACGGACACTCTTTGAAGTCTC and ‐R‐CATTCAAACCATAGTTTAGGTTTGTGT.22 The PCR product of db/db genotype was subjected to further digestion using Rsa‐1 restriction enzyme. The 3% agarose gel stained with ethidium bromide was scanned and the results were recorded for every litter as a pedigree chart. All animals used in this study approved by the Institutional Animal Aare and Use Committee (IACAC) at the University of Texas Health Science Center, San Antonio, TX, USA.
2.2. Tissue, serum, and urine analyses
Wild type (WT), db/db, TSC2 +/−, and db/db/TSC2 +/− mice were euthanized at 6 and 8 months of age with each group consisting of each group 7–13 animals. Urine was collected in metabolic cages for 24 h prior to euthanasia. Protein was measured in urine by Bradford assay, using bovine serum albumin as a standard.23 Serum creatinine was measured using enzyme‐linked immunosorbent (ELISA) assay (Exocell, PA). Kidneys were excised immediately and weighed after the animal was euthanized. Kidneys were either quick‐frozen in liquid nitrogen for biochemical analysis, or fixed in 3.7% paraformaldehyde for immunostaining. Hematoxylin and eosin (H&E) staining and Periodic acid–Schiff (PAS) staining were performed on all kidney sections (4 μm thickness) for all mice.
2.3. Western blot analysis
Kidney tissues were obtained from the four groups of mouse genotypes (wild type (WT), db/db, TSC2 +/−, and db/db/TSC2 +/−) and homogenized in RIPA Buffer with proteinase inhibitor (Complete Mini, Roche) as described previously.24 Protein concentrations were determined with the Bradford assay using bovine serum albumin as a standard.23 Western blot analysis was performed as described previously.25 Tuberin and vimentin antibodies were purchased from Cell Signaling; E‐cadherin antibody from BD Biosciences; phospho‐p70S6K, p70S6K, and GADPH antibodies from Santa Cruz Biotechnology and α‐SMA, fibronectin, NFkB, and snail antibodies from Abcam. The enhanced chemiluminescence kit was used to quantify protein expression.
2.4. Nuclear fractionation
Kidney tissue homogenates from the four groups of mouse genotypes were subjected to nuclear fractionation using a nuclear cytoplasm kit (Cell Biolabs). Nuclear fraction subjected to western blot analysis to detect the nuclear P65 unit of NFKB. Lamin B antibody was used as a nuclear marker.
2.5. Immunofluorescence staining of NFKB
NFKB expression was assessed by double immunofluorescence staining as previously described.23 Paraffin‐embedded kidney sections (4 micron) were incubated with 2% BSA to block nonspecific binding and were then incubated with rabbit anti–NFKB antibody (1:100 dilution) for 30 min and washed twice with PBS. The sections were then incubated with FITC‐labeled anti‐rabbit as a secondary antibody (1:200 dilution) (MilliporeSigma, MO) and propidium iodide (PI) (nuclear marker) for 30 min. FITC‐labeled green signals of NFKB were detected using a filter with an excitation range 450–490 nm, whereas (PI) red signals were detected using a filter with excitation at 535 nm. Kidney sections were viewed and photographed using a Nikon Research microscope equipped for epifluorescence with excitation and band pass filters. To show staining specificity, control kidney sections were processed without primary antibodies.
2.6. Immunofluorescence staining of tuberin, vimentin, E‐cadherin, and snail
Double‐labeling immunofluorescence staining was performed as previously described with some modifications.23 Kidney sections were deparaffinized and rehydrated, blocked with 3% BSA, then incubated with primary antibodies, followed by secondary antibodies conjugated with FITC. Coverslips were applied with Vectashield Mounting Medium (Vector Laboratories) to minimize loss of signal. In this assay, tuberin, vimentin, E‐cadherin, or snail was identified by FITC green or red signals. FITC‐labeling was detected using a filter with an excitation range 450–490 nm, whereas red signals were detected using a filter with excitation at 535 nm. Kidney sections were viewed and photographed using a Nikon Research microscope equipped for epifluorescence with excitation and band pass filters. To show staining specificity, control sections were processed without primary antibody.
2.7. Immunoperoxidase staining of P‐p70S6K, α‐SMA, and fibronectin
Detection of α‐SMA, P‐p70S6K, and fibronectin was performed on paraffin sections of kidney tissues by immunoperoxidase staining.25 Kidney sections underwent deparaffinization, rehydration, and blocking with 3% BSA. The sections were incubated with primary antibody overnight at 40C then washed three times with PBS and incubated with horseradish peroxidase‐labeled anti‐rabbit antibody for 30 min. The horseradish peroxidase was developed with diaminobenzidine tetrahydrochloride and hydrogen peroxide in PBS. Control sections were processed without primary antibody. Kidney sections were viewed and photographed using a Nikon Research microscope.
2.8. Isolation and culture of fresh renal proximal tubular epithelial (PTE) cells
Primary PTE cells were isolated from kidney of wild type (WT), db/db, TSC2 +/−, and db/db/TSC2 +/− mice at 6 months of age and cultured as previously described 26 with minor modifications. The cells were incubated at 37°C in humidified 5% CO2 in the air and the medium was changed every 2 days until the cells reached 60% confluence.
2.9. Downregulation of AMPK
MCT cells grown to 60–70% confluency in six‐well plates were transfected with a recombinant plasmid expressing DN‐AMPK, which harbors the K45R mutation of the α1‐subunit (pCAGGS). Plasmids were transfected into the cells using lipofectamine and Lipo‐plus reagent (Invitrogen) as described previously.27 Cells were harvested 48 h later for western blot.
2.10. Downregulation of tuberin and snail by siRNA
MCT cells were grown in 6‐well plates in NG medium. Selected siRNA duplexes against tuberin or snail as well as control siRNA were obtained from Santa Cruz Biotechnology. MCT cells were transfected with siRNA specific for tuberin or with nonspecific siRNA duplexes (control). MCT and PTE cells were transfected with siRNA specific for snail or with nonspecific siRNA duplexes (control) as described previously.28 Cells were harvested 48 h later for western blot analysis.
2.11. Statistics:
Data are presented as the mean ±standard error. Statistical differences were determined using ANOVA for multiple groups compassion (Exp. vs. Control). p‐values less than 0.01 were considered statistically significant.
3. RESULTS
3.1. Genotyping of a new mouse
Genotype for TSC2 +/− mice showed two bands, 105 and 86 bps, whereas WT only showed one band of 86 bps by PCR analysis (Figure 1A). On the other hand, genotyping of db/db and WT animals showed that db/db has two bands of 135 and 108 bps, whereas WT mice showed only one band of 135 bps after digestion PCR products with Rsa‐1 restriction enzyme (Figure 1B).
FIGURE 1.
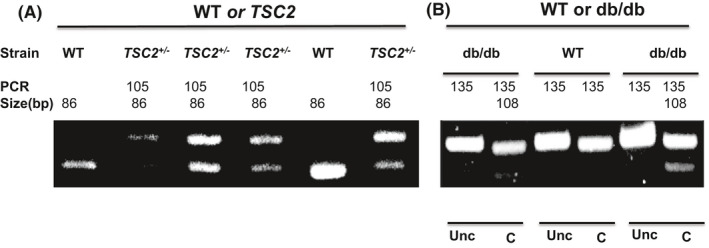
Genotype of wild type, db/db, TSC2 +/−, nd db/db/TSC2 +/− mice. DNA was extracted from the ear punches from 4‐ to 6‐week‐old mice. (A) PCR of genotyping for TSC. TSC2+/− two bands, 105 and 86 bp. WT: one band, 86 bp. (B) PCR of genotyping for db/db after Rsa I digestion of PCR products. db/db: two bands, 135 and 108 bp. WT: one band, 135 bp. Unc: uncut by Rsa I and C: cut by Rsa I
3.2. Tuberin deficiency increases serum creatinine and proteinuria in diabetic mice
Blood glucose measurement was performed after overnight fasting animals from all four groups. Significant increases in glucose levels were detected in db/db mice and a new mouse model (db/db/TSC2+/−), whereas WT and TSC2+/− animals exhibit normal glucose levels (Table 1). We observed slight increases in kidney weight in the new mouse compared to WT mice at 6 and 8 months of age. In addition, serum creatinine and proteinuria are significantly increased in the new mouse model (db/db/TSC2+/−) compared to db/db and TSC2+/− mice with substantial increases apparent when all three are compared to WT mice at 6 and 8 months (Table 1).
TABLE 1.
Physiological parameters in wild type, db/db, TSC2+/− and db/db/TSC2+/− mice at 6& 8 months
| WT | db/db | TSC2+/− | db/db/TSC2 +/− | |
|---|---|---|---|---|
| No of mice | 9 | 7 | 10 | 12 |
| Age (month) | 6 | 6 | 6 | 6 |
| Blood glucose (mg/dl) at the sacrifice date | 89 ± 8 | 466 ± 21* | 90 ± 7 | 458 ± 28* |
| S. Creatinine Conc‐mg/dL | 1.18 ± 0.14 | 2.15 ± 0.21# | 2.72 ± 0.35# | 4.36 ± 0.51¶ |
| Proteinuria (mg/24 h) | 2.78 ± 0.20 | 5.95 ± 0.32# | 5.7 ± 0.31# | 6.90 ± 0.52# |
| Kidney Weight average (g) | 0.30 ± 0.03 | 0.35 ± 0.02 | 0.40 ± 0.05 | 0.42 ± 0.08 |
| WT | db/db | TSC2+/− | db/db/TSC2 +/− | |
| No of mice | 7 | 12 | 8 | 13 |
| Age (month) | 8 | 8 | 8 | 8 |
| Blood glucose (mg/dl) at the sacrifice date | 99 ± 9 | 490 ± 25* | 94 ± 7 | 485 ± 32* |
| S. Creatinine Conc‐mg/dL | 1.74 ± 0.19 | 3.7 ± 0.24# | 5.99 ± 0.43# | 7.76 ± 0.39¶ |
| Proteinuria (mg/24 h) | 2.7 ± 0.70 | 6.7 ± 1.2# | 6.1 ± 0.91# | 8.81 ± 1.3# |
Significant increases in glucose levels are detected in db/db mice and in the new mouse model (db/db/TSC2+/−), whereas WT and TSC2+/− animals showed normal glucose levels. In addition, significant increases in serum creatinine and proteinuria are detected in db/db and TSC2+/− mice and are higher in the new mouse model compared with WT mice at 6 and 8 months. Data represent means ± SE (n = 7–13).
A significant difference from WT and TSC2+/− mice is indicated by p < 0.01.
A significant difference from WT mice is indicated by p < 0.01.
Significant differences from dbdb and TSC mice are indicated by p < 0.01.
3.3. Morphologic changes in kidney of the new mouse model
H&E and PAS staining reveal that glomeruli are enlarged and more cellular in the kidneys of db/db/TSC2+/− mice as compared to kidneys of db/db, TSC2+/−, and WT mice (Figure 2A,C). In addition, much more acellular PAS‐positive material is apparent in the glomeruli of db/db/TSC2+/− mice compared to db/db, TSC2+/−, and WT mice (Figure 2B&D). Both the enlarged glomeruli and the deposition of acellular PAS‐positive material are more pronounced in kidneys from db/db/TSC2+/− mice at 8 months of age as compared to 6 months (Figure 2). These data suggest that the effects of chronic hyperglycemia on kidney cell injury are exacerbated in db/TSC2 +/− mice.
FIGURE 2.
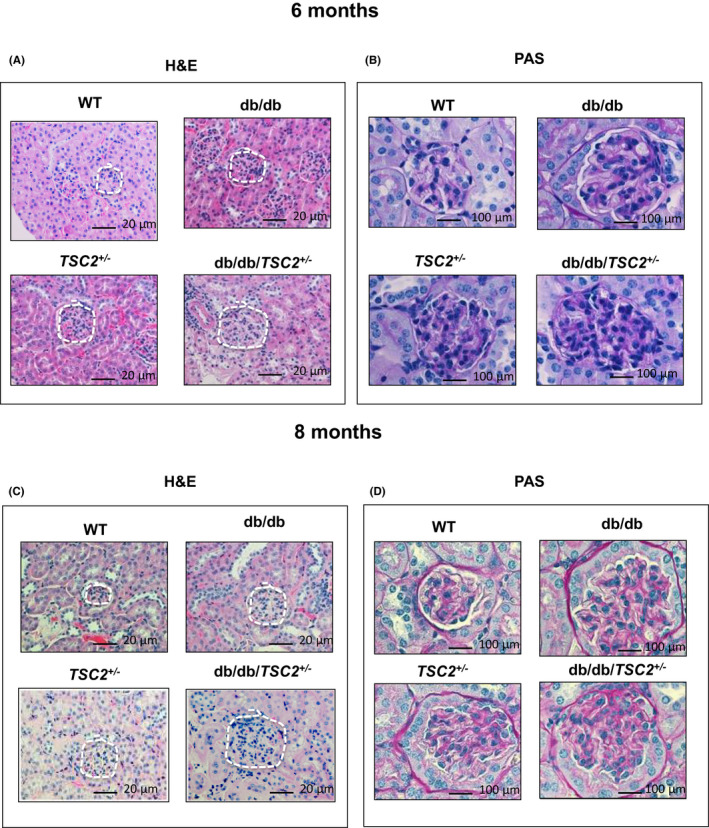
Renal injury is significantly higher in db/db/TSC2 +/− mice. (A, C) H&E staining from kidney sections (n = 4) showed larger glomeruli and tubular cells injury in db/db/TSC2 +/− mice compared to other genotypes. More severe hypertrophy of glomeruli and tubular cells is apparent at 6 months old compared to 8 months old. (B, D) PAS staining of acellular PAS‐positive material in kidney tissue section (n = 4) is more prominent in glomeruli and tubules of db/db/TSC2 +/− mice than other mice strains with more deposition in 8 months than 6‐month‐old mice
3.4. Tuberin deficiency is exacerbated on the diabetic background
To determine the effect of chronic hyperglycemia on the expression of tuberin in kidneys, we compared, immunofluorescence staining for tuberin across all four groups of genotypes. Tuberin expression is significantly decreased in db/db/TSC2+/− mice as compared to db/db, TSC2+/−, and WT mice and this decrease is more pronounced at 8 months than at 6 months of age (Figure 3A,E). Tuberin is expressed primarily in tubular cells with low levels detected in glomeruli (Figure 3A,E). Consistent with the results of immunofluorescence staining, the expression of tuberin is significantly decreased in kidney homogenates from db/db/TSC2+/− mice as compared to TSC2+/−, db/db, and WT in western blot analysis (Figure 3C,G). The most pronounced decrease in tuberin expression is apparent in kidneys at 8 months of age as compared to 6 months by both immunofluorescence staining and western blot analysis (Figure 3A,C,E,G). Taken together, these data indicate that hyperglycemia negatively influences the tuberin expression in kidney of db/db/TSC2+/− mice compared to db/db and TSC2+/− mice.
FIGURE 3.
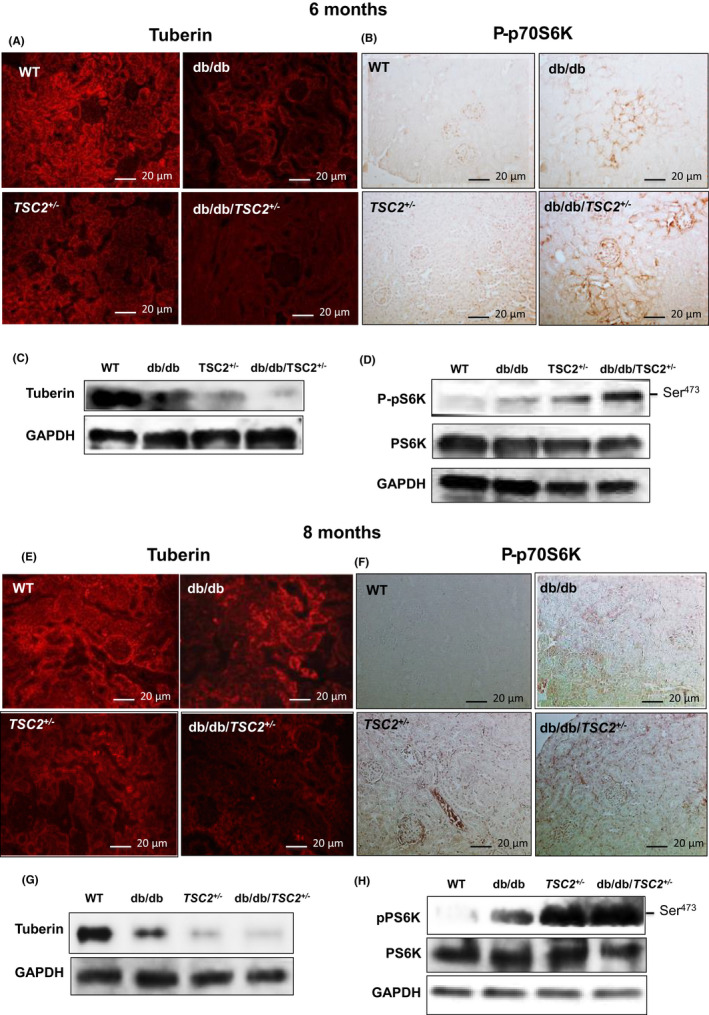
Decreases in tuberin expression in db/db/TSC2 +/− mice are associated with hyperactivation of mTOR in the new mouse model. (A, E) Kidney tissue sections (n = 4) were incubated with rabbit antibody against tuberin followed by immunofluorescence staining show sharp decreases in the expression of tuberin in db/db/TSC2 +/− mice at age of 6 and 8 months compared to other genotypes. (C, G) Representative immunoblot shows significant decreases in expression of tuberin at 6 and 8 months old of db/db/TSC2 +/− mice compared to other strains of mice. (B, F) Kidney tissue sections (n = 4) were incubated with anti‐P‐p70S6K antibody followed by horseradish peroxidase staining show activation of mTOR in db/db/TSC2 +/− mice
3.5. Hyperactivation of mTOR in the new mouse model
To determine whether chronic hyperglycemia hyperactivates mTOR expression in db/db/TSC2 +/− mice, we performed P‐p70S6K immunoperoxidase staining in kidney sections. Figure 3 shows that expression of P‐p70S6K is significantly increased in db/db/TSC2 +/− mice, as compared to db/db, TSC2 +/−, and WT mice, with a more pronounced increase at 8 months (Figure 3B,F). mTORC1 protein expression is also increased in the kidneys of db/db/TSC2 +/− mice (data not shown). P‐p70S6K is primarily expressed within the interstitial cells and glomeruli cells, with only faint staining detectable in tubular cells. Consistent with the immunostaining results, a representative western blot shows that P‐p70S6K is significantly increased in the kidneys of db/db/TSC2 +/− mice, as compared to the other three genotypes (Figure 3D,H). Again, this increased P‐p70S6K expression is more pronounced at 8 months of age (Figure 3B,D,F,H). These data suggest that hyperglycemia and tuberin deficiency may synergistically hyperactivate mTOR in db/db/TSC2 +/− mice.
3.6. Tuberin reduction in chronic hyperglycemia is associated with upregulation of NFkB and snail, to promote EMT in the new mouse model
To investigate the role of reduction in tuberin by hyperglycemia in regulation EMT, we examined the expression of NFkB and snail in kidney sections, using immunofluorescent staining. The expression of both NFkB and snail is significantly increased in db/db/TSC2 +/− mice, as compared to db/db, TSC2 +/−, and WT, with a more pronounced increase apparent at 8 months of age (Figure 4A,B,E,F). Consistent with immunostaining results, a representative western blot reveals significant increases in the expression of snail in db/db/TSC2 +/− mice, as compared to the other three genotypes (Figure 4C,D,G,H). In diabetic patients, the nuclear localization of NFkB‐p65 is increased and correlated with the levels of cytokines.34 Figure 4A,F show increases in nuclear NFkB‐p65 staining in kidney sections from db/db and TSC2+/− mice, and more pronounced increases in the kidneys of db/db/TSC2 +/− mice, as compared to WT mice at ages 6 and 8 months. NFkB is expressed primarily in tubular and glomeruli cells, whereas snail is primarily expressed in tubular cells, with faint staining detected in glomeruli cells. As observed for NFkB, the combination of tuberin deficiency and hyperglycemia appears to have a synergistic effect on increasing snail expression in kidneys of db/db/TSC2 +/−, when compared to the other three genotypes at 6 and 8 months (Figure 4). Taken together, these data suggest NFkB and snail levels are increased in db/db, TSC2 +/−, and db/db/TSC2 +/− mice and apparent by 6 months of age. Tuberin deficiency and the chronic effects of hyperglycemia synergistically enhance the accumulation of NFkB and snail proteins, which may accelerate EMT in the kidneys of db/db/TSC2 +/− mice and contribute to the development of chronic renal fibrosis.
FIGURE 4.
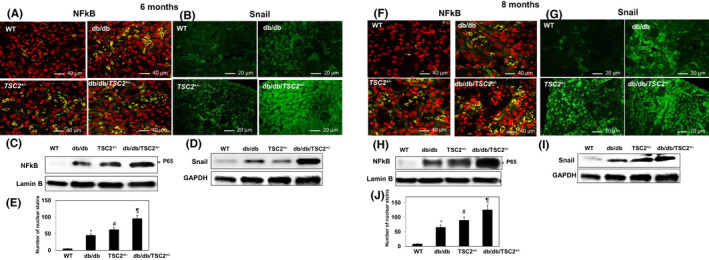
Increases NFkB and snail protein expression in the new mouse model. Kidney tissue sections (n=4) were incubated with rabbit antibody against NFkB followed by double immunofluorescent staining with FITC‐labeled secondary antibody and PI staining shows (A, F) nuclear localization of NFKB. (C& H) Expression of NFkB (P65) protein was confirmed in a nuclear fraction in kidney homogenates. Lamin B was used as a nuclear protein loading control. (B, G) snail staining in db/db/TSC2 +/− mice compared to other strains of mice at 6 and 8 months of age. (D& I) Snail expression was confirmed by western blot analysis. Nuclear staining of NFkB was counted in kidney sections (n = 4). (E&J) * A significant difference in the number of nuclear stains from WT mice is indicated by p < 0.01. # A significant difference from db/db mice is indicated by p < 0.01. ¶ Significant differences from dbdb and TSC are indicated by p < 0.01
3.7. Hyperglycemia‐induced tuberin deficiency is associated with downregulation of E‐cadherin and upregulation of vimentin
To characterize the effects of chronic hyperglycemia and tuberin deficiency on the regulation of proteins involved in EMT, immunofluorescence staining for E‐cadherin and vimentin was performed in kidney sections. E‐cadherin expression is significantly decreased, whereas vimentin expression is significantly increased in db/db/TSC2 +/− mice, as compared to db/db, TSC2 +/−, and WT mice; these changes in E‐cadherin and vimentin levels are more pronounced at 8 months of age (Figure 5A,B,E,F). Western blot analyses confirmed these results (Figure 5C,D,G,H). By 8 months of age, chronic hyperglycemic conditions have nearly abolished E‐cadherin expression in the kidneys of db/db/TSC2 +/− mice. E‐cadherin is expressed primarily within the cell membranes and junctions of tubular and glomeruli cells, whereas the majority of vimentin staining is detected in the interstitial areas and cell membranes of tubular cells and glomeruli cells (Figure 5A,B,E,F). These data indicate that chronic hyperglycemia and tuberin deficiency act synergistically to increase expression of the mesenchymal protein vimentin, and to reduce expression of the epithelial protein E‐cadherin, thus accelerating EMT in the kidneys of db/db/TSC2 +/− mice.
FIGURE 5.
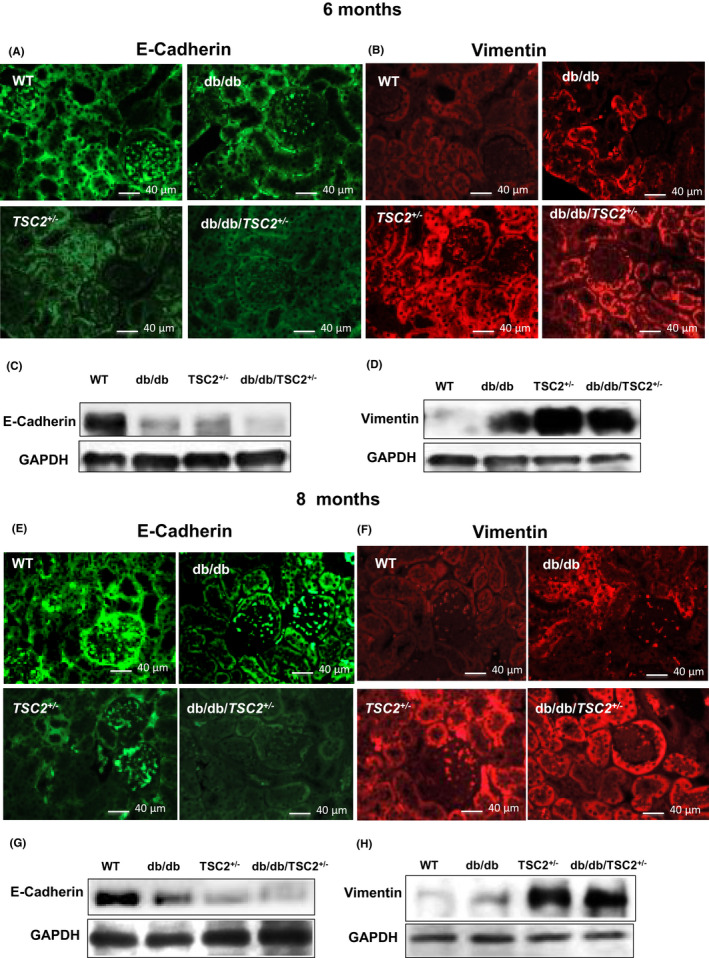
E‐cadherin is significantly decreased and vimentin increased in db/db/TSC2 +/− mice compared to other mice strains. Kidney tissue sections (n = 4) were incubated with rabbit antibodies against either E‐cadherin (A, E) or vimentin (B, F) and visualized with fluorophore‐conjugated secondary antibodies. (A, E) E‐cadherin is not detected in db/db/TSC2 +/− mice at 8 months, whereas faint expression is detected at 6 months old. (B, F) Expression of vimentin is significantly increased in db/db/TSC2 +/− and TSC2 +/− mice compared to diabetic mice at 6 and 8 months old. (C, D, G, HHH)
3.8. Overexpression of renal fibrosis proteins in the new mouse model
To examine the role of chronic hyperglycemia and tuberin deficiency on the expression of mesenchymal proteins, we performed immunoperoxidase staining for fibronectin and α‐SMA in kidney sections. Fibronectin expression is significantly increased in the kidneys of db/db/TSC2 +/− mice, as compared to db/db, TSC2 +/− and WT mice, with a more pronounced increase at age 8 months (Figure 6A,B). We also detected a significant increase in fibronectin expression in db/db mice at ages 6 and 8 months, as compared to WT. Western blot analyses of fibronectin protein in kidneys from all four genotypes confirmed our immunoperoxidase staining results (Figure 6C,D). Next, we examined α‐SMA expression in kidney, using western blot and immunoperoxidase staining analyses. Expression of α‐SMA is increased in db/db mice at age 8 months, as compared to TSC2 +/− and WT mice at the same age (Figure 6G,H). Moreover, α‐SMA expression is significantly increased in db/db/TSC2 +/− mice as compared to db/db, TSC2 +/−, and WT mice at age 6 months; however, this difference was not observed at age 8 months. Immunoperoxidase staining for α‐SMA in kidney sections at ages 6 and 8 months is shown in Figure 6A,B,E,F. These data indicate that chronic hyperglycemia and tuberin deficiency may synergistically increase expression of fibrosis‐related proteins, thus enhancing EMT in db/db/TSC2 +/− mice.
FIGURE 6.
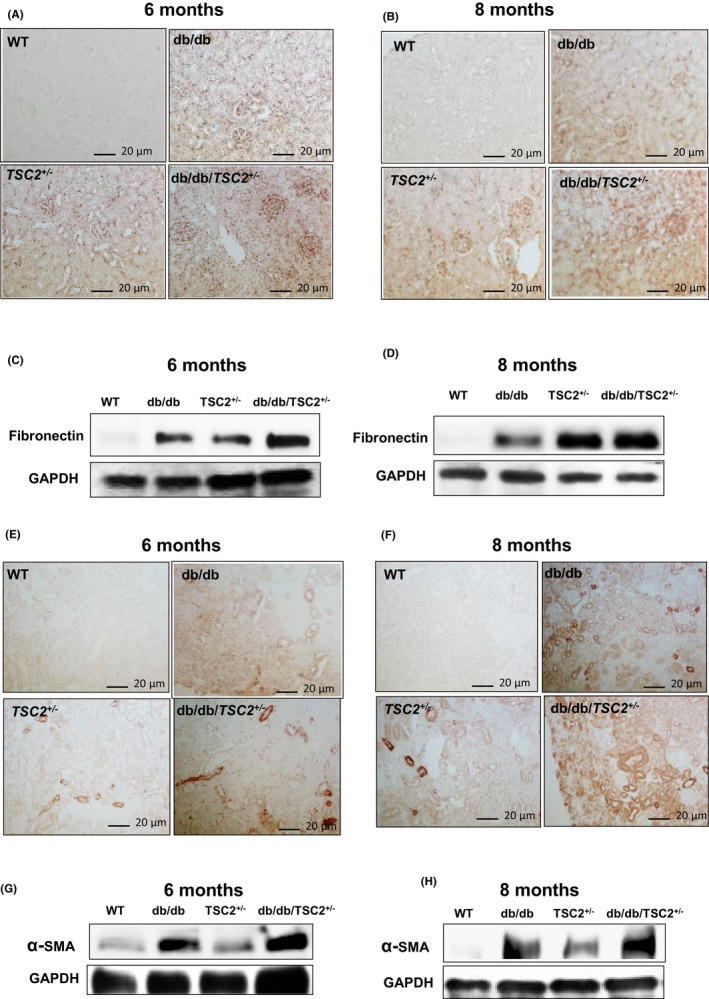
α‐SMA and fibronectin are significantly increased in db/db/TSC2 +/− mice. (A&B) Fibronectin expression in kidney sections (n = 4) is significantly increased in db/db/TSC2 +/− mice compared to other mice strains by immunoperoxide staining. (C&D) These data were confirmed by western blot analysis confirms that fibronectin is greatly enhanced in db/db/TSC2 +/− mice compared to other genotypes at age 6 and 8 months old. (E&G) Sharp increase in α‐SMA expression is detected in db/db/TSC2 +/− mice at 6 months compared to db/db mice. (F&H) A significant increase in α‐SMA expression was detected in db/db mice compared to WT mice with similar levels of α‐SMA expression in db/db/TSC2 +/− and TSC2 +/− mice at 8 months old
3.9. Tuberin deficiency accelerates EMT in primary proximal tubular epithelial (PTE) cells
To further characterize the role of hyperglycemia in decreasing tuberin levels and accelerating EMT, we isolated primary proximal tubular cells from kidneys at age 6 months, and subjected cell lysates to western blot analyses (Figure 7A,B). Figure 7A,B show significant decreases in tuberin and E‐cadherin expression in db/db/TSC2 +/− PTE cells, compared to cell lysates isolated from WT mice. In contrast, we detected, significant increases in NFkB (P65), snail, vimentin, fibronectin, and α‐SMA expression in PTE cells isolated from hyperglycemic mice, as compared to WT. A pronounced decrease in tuberin expression in PTE cells isolated from db/db/TSC2+/− mice is associated with significant increases in expression of the mesenchymal proteins, snail, vimentin, and fibronectin, providing evidence that hyperglycemia and tuberin deficiency synergistically increase mesenchymal proteins and decrease epithelial proteins, to accelerate EMT through the NFkB/snail pathway.
FIGURE 7.
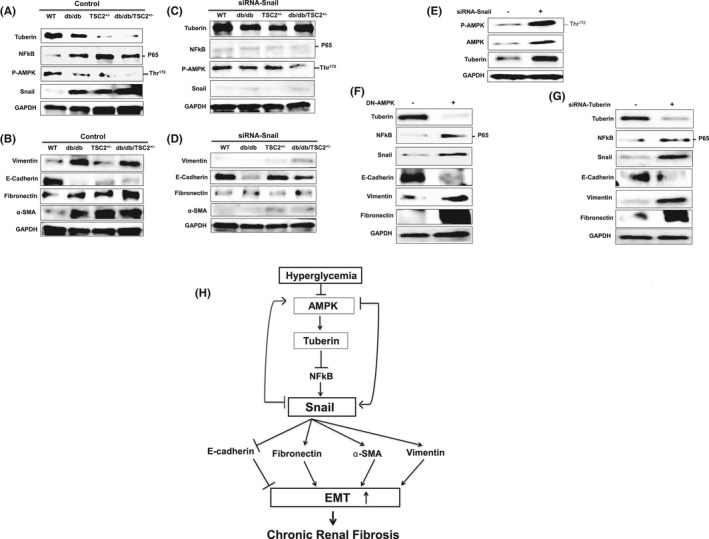
More mesenchymal and fewer epithelial proteins in fresh primary proximal tubular epithelial (PTE) mouse cells isolated from db/db/TSC2 +/− mice. (A&B) Representative immunoblots are in consistent with the results of the kidney tissues showing decreased tuberin expression leading to up‐regulation of NFkB, snail, vimentin, fibronectin, and α‐SMA and downregulation of E‐cadherin in cells isolated from kidney of db/db/TSC2 +/− mice as compared to db/db, and TSC2 +/− mice. (C&D) PTE cells transfected with siRNA against snail showed significant increases in phosphorylation of AMPK at Thr172, and in tuberin and E‐cadherin protein expression in db/db/TSC2 +/−, TSC2 +/− and db/db cells. Significant decreases in NFkB (P65), vimentin, α‐SMA, and fibronectin protein expression are observed in all transfected cells. (E) MCT cells transfected with siRNA against snail show increases in p‐AMPK and tuberin protein expression confirming the data from PTE cells. (F) MCT cells transfected with DN‐AMPK showed a significant decreases in tuberin and E‐cadherin and strong increases in protein expression of NFkB (P65), snail, vimentin, and fibronectin. (G) Downregulation of tuberin by siRNA in MCT cells results in a significant increase in NFkB (P65), snail, and vimentin expression with a significant decrease in E‐cadherin protein was observed. (H) Chronic hyperglycemia leads to decreases in tuberin, inactivation of AMPK, and activation of snail to increase mesenchymal proteins and enhances EMT. Blocking snail has strong feedback to activate AMPK and increases tuberin expression to increase epithelial proteins and prevent renal fibrosis in diabetes
3.10. Blocking snail upregulates tuberin/AMPK to prevent renal fibrosis
To characterize the mechanisms regulating AMPK and EMT in diabetes, we reduced snail expression in PTE cells using siRNA. Figure 7C,D shows that downregulation of snail results in a significant increase in both AMPK phosphorylation at Thr172 and tuberin expression, compared to cells transfected with control siRNA (Figure 7C). These data indicate that blocking snail expression can increase phosphorylation of AMPK and increase tuberin expression, potentially inhibiting the initiation of fibrosis in diabetes.
3.11. AMPK and tuberin are major regulators of snail to control renal fibrosis
AMPK is a well‐known upstream regulator of tuberin. We confirmed our findings on the role of snail in regulating AMPK/tuberin from PTE cells, in MCT cells where downregulation of snail by siRNA also results in increased AMPK and tuberin expression (Figure 7E). Next, we tested the feedback loop between AMPK and snail. Data in Figure 7F show that downregulation of AMPK by DN‐AMPK significantly increases snail, NFkB (P65), and vimentin expression, and decreases E‐cadherin expression, suggesting that AMPK alters the expression of snail and major mesenchymal/epithelial proteins involved in EMT. Next, we investigated the role of tuberin in regulating NFkB/snail and other downstream proteins. Downregulation of tuberin by siRNA in MCT cells results in significant increases in NFkB (P65), snail, vimentin, and fibronectin expression, and corresponding decreases in E‐cadherin expression (Figure 7G). Taken together, these MCT cell data are consistent with a novel role for snail in regulating AMPK/tuberin expression, to control the occurrence of EMT. We have identified a potential mechanism for the progression of renal fibrosis in diabetes through snail‐AMPK pathway, in which snail is a part feedback loop to block AMPK/tuberin signaling (Figure 7H).
4. DISCUSSION
The study provides a new evidence that chronic hyperglycemia decreased tuberin to upregulate snail that has a feedback to block AMPK to increase EMT and renal fibrosis. Our new mouse model of dbdb/TSC2+/− data showed a weak expression of E‐cadherin and strong expression of vimentin compared to dbdb and TSC2 +/− mice. The data also showed a sharp decrease in tuberin expression that associated with hyperactivation of mTOR (measured by phosphorylation of p70S6K at Ser473) in db/db/TSC2+/− mice compared to dbdb and TSC2+/− mice. In addition, significant upregulation of NFkB and snail proteins was detected in db/db/TSC2+/− mice compared to dbdb and TSC2+/− as well as WT mice. Moreover, mesenchymal proteins including α‐SMA, vimentin, and fibronectin showed higher expression in db/db/TSC2+/− mice compared to dbdb and TSC2+/− mice. On the other hand, epithelial proteins including E‐cadherin protein showed lower expression in db/db/TSC2+/− mice compared to dbdb and TSC2+/− mice. The changes in all proteins were significantly detected in 6 and 8 months old of db/db/TSC2+/− compared to dbdb and TSC2+/− mice at the same age. Fresh primary proximal tubular cells isolated from the four genotypes of mice at 6 months of age showed similar expression of all proteins in the kidney of four genotypes confirming the regulation of all these proteins in the kidney, whereas more than 70% of proximal tubular cells is presented. We provided a new mechanism of regulation of EMT through identifying a novel feedback role of snail in regulating AMPK to control EMT process. We found that AMPK and tuberin are upstream regulators of snail and knocking down snail by siRNA resulted in upregulating of AMPK and tuberin to reverse the expression of epithelial and mesenchymal proteins in renal cells.
EMT is characterized by changes in the expression of epithelial and mesenchymal proteins; however, the mechanisms that control these changes in the context of diabetic kidney fibrosis have not been elucidated.29, 30 NFkB is a transcription factor that controls the expression of several genes, positively or negatively, by working as a dimer to bind to KB sites (a 9–10 base pair site) in either promoters or enhancers of a variety of targeting genes.31, 32 In this study, we show that expression of NFkB and snail significantly increase, with associated decreases in tuberin and E‐cadherin, under the chronic effect of hyperglycemia in kidneys of db/db/TSC2 +/− mice. Chronic exposure of renal cells to hyperglycemia in db/db/TSC2 +/− mice drives the majority of cells to a mesenchymal state and leaving fewer cells in an epithelial state, thus contributing to the development of severe renal fibrosis and kidney complications in diabetes. A recent study showed that diabetic rats express high levels of NFkB, and that treatment of diabetic rats with argatroban as anti‐fibrotic agent decreases NFkB, fibrosis, and inflammation.33 In addition, nuclear localization of NFkB‐p65 is higher in type 1 diabetic patients, correlated with levels of cytokines including monocyte chemoattractant protein MCP‐1.34 Thus p65 contributes to the atheromatous process in diabetes through its ability to increase pro‐inflammatory cytokines and fibrosis.34
Snail is a member of the zinc‐finger transcription factor family, with a highly conserved carboxy‐terminal region and an amino terminal with a conserved SNAG domain, which can act as a transcriptional repressor. Snail is unstable and tightly controlled by signaling pathways such as NFkB.33 Here we provide evidence that snail can act as a key molecule in EMT and chronic renal fibrosis in diabetes. Knock‐down of snail by siRNA activates AMPK and rescues tuberin expression, thus decreasing expression of mesenchymal proteins including vimentin, α‐SMA and fibronectin, and increase expression of epithelial proteins such as E‐cadherin. These changes in expression of mesenchymal and epithelial proteins are consistent with a reversal of EMT. In contrast, downregulation of p‐AMPK through chronic hyperglycemia results in a significant increase in snail, to activate several fibrosis‐related proteins including α‐SMA, vimentin, and fibronectin. We have provided multiple lines of evidence indicating that snail is involved in feedback regulation of AMPK and tuberin, thus enhancing the expression of mesenchymal proteins and contributing to the development of renal fibrosis under hyperglycemic conditions. This is a novel role for snail/AMPK in regulating renal fibrosis and identifies snail as a potential target gene to prevent chronic renal fibrosis in diabetic patients.
CONFLICT OF INTEREST
No potential conflicts of interest relevant to this article were reported.
AUTHORS’ CONTRIBUTIONS
S.L. and M.Y. conducted all cell culture, animal experiments, and wrote the manuscript. S.LH participated design of all experiments, data analysis and interpretation, and edited the manuscript. KSV reviewed and edited the manuscript. S.L.H. is the guarantor of this work and, as such, had full access to all the data in the study.
ACKNOWLEDGMENTS
This work was supported in part by grants from the American Heart Association and Merit Review Award from Department of Veterans Affairs (to S.L.H.).
REFERENCES
- 1.Liu J, Zhong Y, Liu G, et al. Role of stat3 signaling in control of EMT of tubular epithelial cells during renal fibrosis. Cell Physiol Biochem. 2017;42:2552‐3255. [DOI] [PubMed] [Google Scholar]
- 2.Kriz W, Kaissling B, Le Hir M. Epithelial‐mesenchymal transition (EMT) in kidney fibrosis: fact or fantasy? J Clin Invest. 2011;121:468‐474. [DOI] [PMC free article] [PubMed] [Google Scholar]
- 3.Kalluri R, Weinberg RA. The basics of epithelial‐mesenchymal transition. J Clin Invest. 2009;119:1420‐1428. [DOI] [PMC free article] [PubMed] [Google Scholar]
- 4.Bonavida B, Baritaki S. The novel role of Yin Yang 1 in the regulation of epithelial to mesenchymal transition in cancer via the dysregulated NF‐κB/Snail/YY1/RKIP/PTEN circuitry. Crit Rev Oncog. 2011;16:211‐226. [DOI] [PubMed] [Google Scholar]
- 5.Bonavida B, Baritaki S. Inhibition of epithelial‐to‐mesenchymal transition (EMT) in cancer by nitric oxide: pivotal roles of nitrosylation of NF‐κB, YY1 and snail. Immunopathol Dis Therap. 2012;3:125‐133. [DOI] [PMC free article] [PubMed] [Google Scholar]
- 6.Liu Y. Cellular and molecular mechanisms of renal fibrosis. Nat Rev Nephrol. 2011;18:684‐696. [DOI] [PMC free article] [PubMed] [Google Scholar]
- 7.Nieto MA. The snail superfamily of Zinc‐ finger transcription factors. Mol Cell Biol. 2002;3:155‐166. [DOI] [PubMed] [Google Scholar]
- 8.Carver EA, Jiang R, Lan Y, Oram KF, Gridley T. The mouse snail gene encodes a key regulator of the epithelial‐mesenchymal transition. Mol Cell Biol. 2001;21:8184‐8188. [DOI] [PMC free article] [PubMed] [Google Scholar]
- 9.Sumual S, Saad S, Tang O, et al. Differential regulation of Snail by hypoxia and hyperglycemia in human proximal tubule cells. Int J Biochem Cell Biol. 2010;42:1689‐1697. [DOI] [PubMed] [Google Scholar]
- 10.Cao L, Huang B, Fu X, Yang J, Lin Y, Lin F. Effects of tanshinone IIA on the regulation of renal proximal tubular fibrosis. Mol Med Rep. 2017;4247‐4252. [DOI] [PubMed] [Google Scholar]
- 11.Cano A, et al. The transcription factor Snail controls epithelial–mesenchymal transitions by repressing E‐cadherin expression. Nature Cell Biol. 2000;2(2):76‐83. [DOI] [PubMed] [Google Scholar]
- 12.De Craene B, van Roy F, Berx G. Unraveling signaling cascades for the snail family of transcription factors. Cell Signal. 2005;17:535‐547. [DOI] [PubMed] [Google Scholar]
- 13.Kugoh H, Kleymenova E, Walker CL. Retention of membrane‐localized beta‐catenin in cells lacking functional polycystin‐1 and tuberin. Mol Carcinog. 2002;33:131‐136. [DOI] [PubMed] [Google Scholar]
- 14.Lu Q, Ji XJ, Zhou YX, et al. Quercetin inhibits the mTORC1/p70S6K signaling‐mediated renal tubular epithelial‐mesenchymal transition and renal fibrosis in diabetic nephropathy. Pharmacol Res. 2015;99:237‐247. [DOI] [PubMed] [Google Scholar]
- 15.Coulombe PA, Wong P. Cytoplasmic intermediate filaments revealed as dynamic and multipurpose scaffolds. Nat Cell Biol. 2004;6:699‐706. [DOI] [PubMed] [Google Scholar]
- 16.Sommers CL, Walker‐Jones D, Heckford SE, et al. Vimentin rather than keratin expression in some hormone‐independent breast cancer cell lines and in oncogene‐transformed mammary epithelial cells. Cancer Res. 1989;49:4258‐4263. [PubMed] [Google Scholar]
- 17.Pawlak G, Helfman DM. Cytoskeletal changes in cell transformation and tumorigenesis. Curr Opin Genet Dev. 2001;11:41‐47. [DOI] [PubMed] [Google Scholar]
- 18.Nagano M, Hoshino D, Koshikawa N, Akizawa T, Seiki M. Turnover of focal adhesions and cancer cell migration. Int J Cell Biol. 2012;2012:310616. [DOI] [PMC free article] [PubMed] [Google Scholar]
- 19.Hills CE, Siamantouras E, Smith SW, Cockwell P, Liu K‐K, Squires PE. TGFβ modulates cell‐to‐cell communication in early epithelial‐to‐mesenchymal transition. Diabetologia. 2012;55:812‐824. [DOI] [PubMed] [Google Scholar]
- 20.Habib SL. Alterations in tubular epithelial cells in diabetic nephropathy. J Nephrol. 2013;26:865‐869. [DOI] [PubMed] [Google Scholar]
- 21.Onda H, Lueck A, Marks PW, Warren HB, Kwiatkowski DJ. Tsc2+/‐ mice develop tumors in multiple sites that express gelsolin and are influenced by genetic background. J Clin Investig. 1999;104:687‐695. [DOI] [PMC free article] [PubMed] [Google Scholar]
- 22.Mohan S, Reddick RL, Musi N, et al. Diabetic eNOS knockout mice develop distinct macro‐ and microvascular complications. Lab Invest. 2008;88:515‐528. [DOI] [PubMed] [Google Scholar]
- 23.Bradford MM. A rapid and sensitive method for the quantitation of microgram quantities of protein utilizing the principle of protein‐dye binding. Anal Biochem. 1976;72:248‐254. [DOI] [PubMed] [Google Scholar]
- 24.Habib SL, Phan MN, Patel SK, Li D, Monks TJ, Lau SS. Reduced constitutive 8‐oxoguanine‐DNA glycosylase expression and impaired induction following oxidative DNA damage in the tuberin deficient Eker rat. Carcinogenesis. 2003;24:573‐582. [DOI] [PubMed] [Google Scholar]
- 25.Habib SL, Simone S, Barnes JJ, et al. Tuberin Haploinsufficiency is Associated with the Loss of OGG1 in rat kidney tumors. Mol Cancer. 2008;7:10‐14. [DOI] [PMC free article] [PubMed] [Google Scholar]
- 26.Simone S, Gorin Y, Velagapudi C, Habib SL. Mechanism of oxidative DNA damage in diabetes: tuberin inactivation and downregulation of OGG1. Diabetes. 2008;57:2626‐2636. [DOI] [PMC free article] [PubMed] [Google Scholar]
- 27.Gravdal K, Halvorsen OJ, Haukaas SA, Akslen LA. A switch from E‐cadherin to N‐cadherin expression indicates epithelial to mesenchymal transition and is of strong and independent importance for the progress of prostate cancer. Clin Cancer Res. 2007;13:7003‐7011. [DOI] [PubMed] [Google Scholar]
- 28.Barnes EA, Kenerson HL, Jiang X, Yeung RS. Tuberin regulates E‐Cadherin localization: Implications in Epithelial‐Mesenchymal Transition. Am J Pathol. 2010;177:1765‐1778. [DOI] [PMC free article] [PubMed] [Google Scholar]
- 29.Hay ED. An overview of epithelio‐mesenchymal transformation. Acta Anat (Basel). 1995;154:8‐20. [DOI] [PubMed] [Google Scholar]
- 30.Smale ST. Hierarchies of NF‐κB target‐gene regulation. Nat Immunol. 2011;12:689‐694. [DOI] [PMC free article] [PubMed] [Google Scholar]
- 31.Oeckinghaus A, Hayden MS, Ghosh S. Crosstalk in NF‐κB Signaling Pathways. Nat Immunol. 2011;12:695‐708. [DOI] [PubMed] [Google Scholar]
- 32.Gilmore TD. Introduction to NF‐κB: players, pathways and perspectives. Oncogene. 2006;25:6680‐6684. [DOI] [PubMed] [Google Scholar]
- 33.Bulani Y, Sharma SS. Argatroban attenuates diabetic cardiomyopathy in rats by reducing fibrosis, inflammation, apoptosis, and protease‐activated receptor expression. Cardiovasc Drugs Ther. 2017;31:255‐267. [DOI] [PubMed] [Google Scholar]
- 34.Trinanes J, Salido E, Fernandez J, et al. Type 1 diabetes increases the expression of proinflammatory cytokines and adhesion molecules in the artery wall of candidate patients for kidney transplantation. Diabetes Care. 2012;35:427‐433. [DOI] [PMC free article] [PubMed] [Google Scholar]


