Abstract
Introduction
Spatiotemporal image correlation (STIC) can evaluate fetal renal impedance using four‐dimensional volumetric indices. We assessed repeatability of three‐dimensional kidney segmentation and the repeatability of the resultant indices.
Methods
In each of 57 healthy pregnant women, three renal artery pulsed‐wave Doppler (PWD) traces and three STIC volumes were acquired from the same fetal kidney and segmented by two observers. Vascularisation‐flow index (VFI) and fractional moving blood volume (FMBV) were calculated for every STIC frame and used to determine the volumetric pulsatility index (vPI), volumetric resistance index (vRI) and volumetric systolic/diastolic ratio (vS/D). Segmentation performance was assessed using Dice similarity coefficients (DSCs), Hausdorff distances, coefficient of variation (CoV) and the intraclass correlation coefficient (ICC). Intra/Inter volumetric index repeatability was assessed using ICCs.
Results
Forty‐eight cases (84%) provided full data. Mean intra‐ and interobserver DSCs were 0.90 and 0.81. Mean intra‐ and interobserver Hausdorff distances were 3.88 mm and 5.27 mm. Average kidney volumes for observers 1 and 2 were 9.88 mL and 8.54 mL (mean difference 16.1%). Mean intra‐observer volumetric CoVs were 5.3% and 8.1%. Intra‐ and interobserver ICCs for kidney volume (same STIC volume) were 0.97 and 0.85. When assessing volume variation between STIC volumes, intra‐observer ICC was 0.97. ICCs were 0.77–0.81 for VFI‐derived volumetric indices and 0.61–0.62 for FMBV‐derived indices; ICCs for all PWD indices were between 0.58 and 0.59.
Conclusions
Periodical variation in vascularity was demonstrated in the fetal kidney, and three‐dimensional segmentation was highly repeatable. Derived volumetric impedance indices show moderate variability but outperform corresponding two‐dimensional PWD indices in terms of reproducibility.
Keywords: fractional moving blood volume, power Doppler, repeatability, spatiotemporal image correlation, vascularity
Introduction
Spatiotemporal image correlation (STIC) may be combined with power Doppler (PD) to generate 4D (four‐dimensional; three‐dimensional (3D) + time) PD ultrasound volumes. Vascular measurements calculated from each 3D volume (phase of the cardiac cycle) may subsequently generate volumetric impedance indices – the volumetric pulsatility index (vPI), volumetric resistance index (vRI) and volumetric systolic/diastolic ratio (vS/D).1 These indices may reflect downstream vascular resistance, analogous to two‐dimensional (2D) pulsed‐wave Doppler (PWD) indices. 2D PWD indices have been shown to be higher in fetuses with intrauterine growth restriction2 and to be associated with decreased fetal urine output,3 so the analogous STIC‐derived indices may be similarly affected in disease states. Therefore, they could potentially be used to assess renal integrity and allow early intervention in renal disease.
Whilst 2D PWD impedance indices interrogate only single, large blood vessels, 3D PD evaluates entire 3D volumes or organs.4, 5 Research quantifying 3D PD has to date predominantly used a commercial offline analysis system (VOCAL™) with three indices: vascularisation index (VI), flow index (FI) and vascularisation‐flow index (VFI).5 Some correlation between these indices, volume flow and vessel number has been shown in‐vitro 6 and ex‐vivo.7 However, there has been limited clinical translation due to poor reproducibility8 and lack of standardisation for beam path, machine settings,9, 10 attenuation,6 regional variability, sampling volume11 and phase of cardiac cycle.12
Recently, a ‘standardised’ 2D index for measurement of PD vascularity, fractional moving blood volume (FMBV), has been augmented into 3D.13 FMBV standardises PD tissue measurements against large, local blood vessels acting as sources for ‘100% vascular amplitude’; it has been shown to be more repeatable than VFI13 and to correlate with blood flow in 2D PD animal studies.14, 15 STIC allows visualisation of 3D PD US volumes representing different phases of the cardiac cycle that may be used to derive 3D volumetric impedance indices, either using VOCAL or FMBV. As they are acquired with identical machine settings and beam path, there is a degree of internal standardisation. To meaningfully measure these indices, whole renal segmentation must be accurate. The literature shows mixed reports on renal volume reproducibility. Whilst some studies present Bland–Altman plots that indicate that kidney volumes demonstrate repeatability when measured by different observers,16, 17, 18 a recent study concluded that renal volume measurement is unreliable.19 These varied results justified further investigation, so this study aimed to assess accuracy of kidney segmentation by two observers and determine the repeatability of the resultant STIC‐derived volumetric impedance indices.
Methods
A single centre, prospective, observational cohort study was conducted with local ethics committee approval (South Eastern Sydney Local Health District Ref 13/002). Participants were recruited between June and August 2016 from the general antenatal clinic of a tertiary teaching hospital following signed, informed consent. Inclusion criteria were women aged ≥18 years with singleton pregnancies between 20 and 40 weeks gestation by last menstrual period and/or first‐trimester ultrasound examination, and a normal morphology scan. Exclusion criteria were as follows: abnormal morphology scan; fetal chromosomal or structural abnormality; maternal complications including hypertension, gestational diabetes; maternal medications potentially able to influence uterine or fetal blood flow including antihypertensive therapy; maternal BMI >35; biometry measurements <10th or >90th centile.
Ultrasound examination was performed by two experienced ultrasound practitioners using a GE Voluson E8 (GE Medical Systems, Zipf, Austria) ultrasound machine with a 3D RAB6‐D transducer (4–8 MHz). During fetal quiescence, the renal artery was identified with colour Doppler imaging and a 2‐mm PWD gate was positioned in the centre of the vessel, acquiring, saving and autotracing at least three similar consecutive waveforms to calculate the PI, RI and S/D ratio. Four consecutive waveforms were used for fetal heart rate (FHR) estimation, and the process was triplicated.
The fetal kidneys were viewed in the longitudinal plane, and the proximal kidney was evaluated in STIC‐PD mode, using a minimised volume of interest to capture only the entire kidney to maximise quality and resolution.20 Maternal and transducer movements were minimised, and three STIC volumes captured. Machine settings were constant for all examinations: pulse repetition frequency 0.3 kHz, wall motion filter ‘low1’, PD gain optimised using ‘sub‐noise gain’ as previously described,21, 22 PD Map 5; frequency mid; flow resolution high; line filter 2; smooth rise/fall 6; line density 5; ensemble 7; quality normal; balance 225; acquisition time 12.5 s; volume angle 25°; STIC trigger power Doppler. The same ultrasound machine was used for all participants.
STIC volumes were accepted at acquisition only if FHR was 110–170 bpm and significant movement artefact was absent. Three STIC volumes were acquired from each participant in immediate succession; at times delayed by fetal movement or breathing. In the absence of delays, STIC acquisition took less than 5 min. If three acceptable STIC volumes were not acquired within the one‐hour examination, STIC volume acquisition was considered unsuccessful and the participant's data were excluded from the study.
Data were exported and converted as previously described.23 B‐Mode and PD volumes were imported into Medical Imaging Interaction Toolkit (MITK 2016.03.0), using frame 1 of the STIC volume as a reference. The PD was set to ‘hot iron’ as it most closely represented the machine's PD display, with semi‐opaque transparency to simultaneously view PD and B‐mode volumes (Figure 1). Moving in the coronal plane, the two end slices representing the outer border of the kidney were annotated, taking care to avoid peripheral vessels. The central slice and every 10th slice from each end were annotated. Two‐dimensional interpolation was used to complete the outline of the 3D kidney volume. After saving to disc, the segmentation was checked for error and repeated if necessary.
Figure 1.
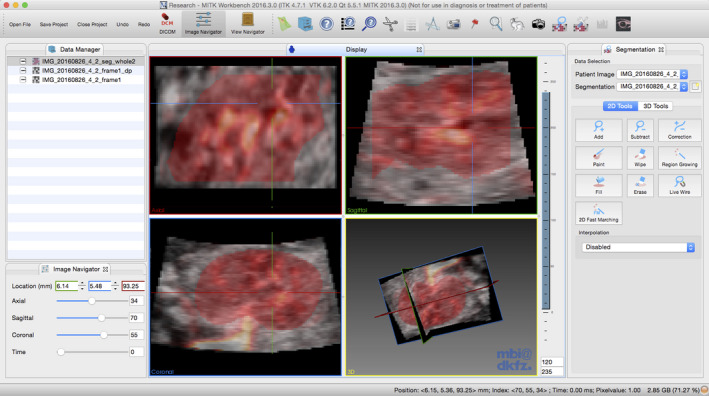
MITK Image Segmentation Platform Showing Multiplanar View and 3D Render with Kidney Segmentation (red) of a 3D Power Doppler Volume Shown.
Two observers independently segmented each STIC volume in triplicate, producing 18 segmentations per participant. To minimise bias, all STIC volumes were segmented entirely before the second and third segmentations; cases were never segmented twice on the same day. The observers were blinded to participant demographics and previous segmentations.
Segmentations and PD volumes were batch processed using a Jupyter notebook24 to obtain the VFI and FMBV for each frame, using an implementation of the FMBV algorithm and a customised version of the VOCAL™ indices based upon the original formulae published by Pairleitner et al.5 A PD threshold value of 60 (0–255 scale) was chosen for PD noise based upon our previous experience. Of the VOCAL™ indices, VFI was chosen as the one most analogous to FMBV,25, 26 as it is the product of the proportion of flow containing voxels (VI) and their mean amplitude (FI).5 FMBV was computed using the rouleaux compensation adjustment described by Rubin et al.27
For each STIC volume, VFI and FMBV were plotted against sequential frame numbers; only STIC volumes demonstrating clear maximum and minimum values across a perceived cardiac cycle were used to calculate the volumetric impedance indices. The VFI and FMBV values were used to calculate volumetric impedance indices based on the maximum (presumed systolic), minimum (presumed diastolic) and mean values1 as follows:
For participants where all three STIC volumes were biphasic suggesting successfully formed cardiac cycles for either VFI or FMBV, a Bland–Altman plot was used to compare the FHR measured by renal artery PWD and STIC. For an anticipated intraclass correlation coefficient (ICC) of 0.8 for the volumetric impedance indices and a minimum 95% CI width of 0.2, we calculated that 40 participants were required to prove reliability with 80% power at P < 0.05 significance threshold based on three measurements per participant. Descriptive statistics were calculated for all analysed variables.
Repeatability of kidney segmentation was assessed using multiple techniques. The Dice similarity coefficient (DSC) represents percentage overlap between two segmentations drawn on the same STIC volume (Figure 2).28 To calculate Hausdorff distance between two segmentations A and B, for each point on segmentation A, the nearest point on segmentation B is measured and the maximum of all these distances is the Hausdorff distance (Figure 2).29 Intra‐ and interobserver DSC and Hausdorff distances were calculated using SimpleITK.30 A Bland–Altman plot was used to visualise the percentage difference in volumes measured by observers 1 and 2. Variability in the volume measured from segmentations of the same STIC volume was assessed using the coefficient of variation (CoV). ICCs were also used to assess segmentation repeatability, applying the one‐way random, single measure; and two‐way mixed, single measure agreement models for intra‐ and interobserver reliability, respectively. The ICC (one‐way random, average measures) was used to assess repeatability of STIC volume acquisition by comparing the three different STIC volumes acquired in each participant (Figure 3).
Figure 2.
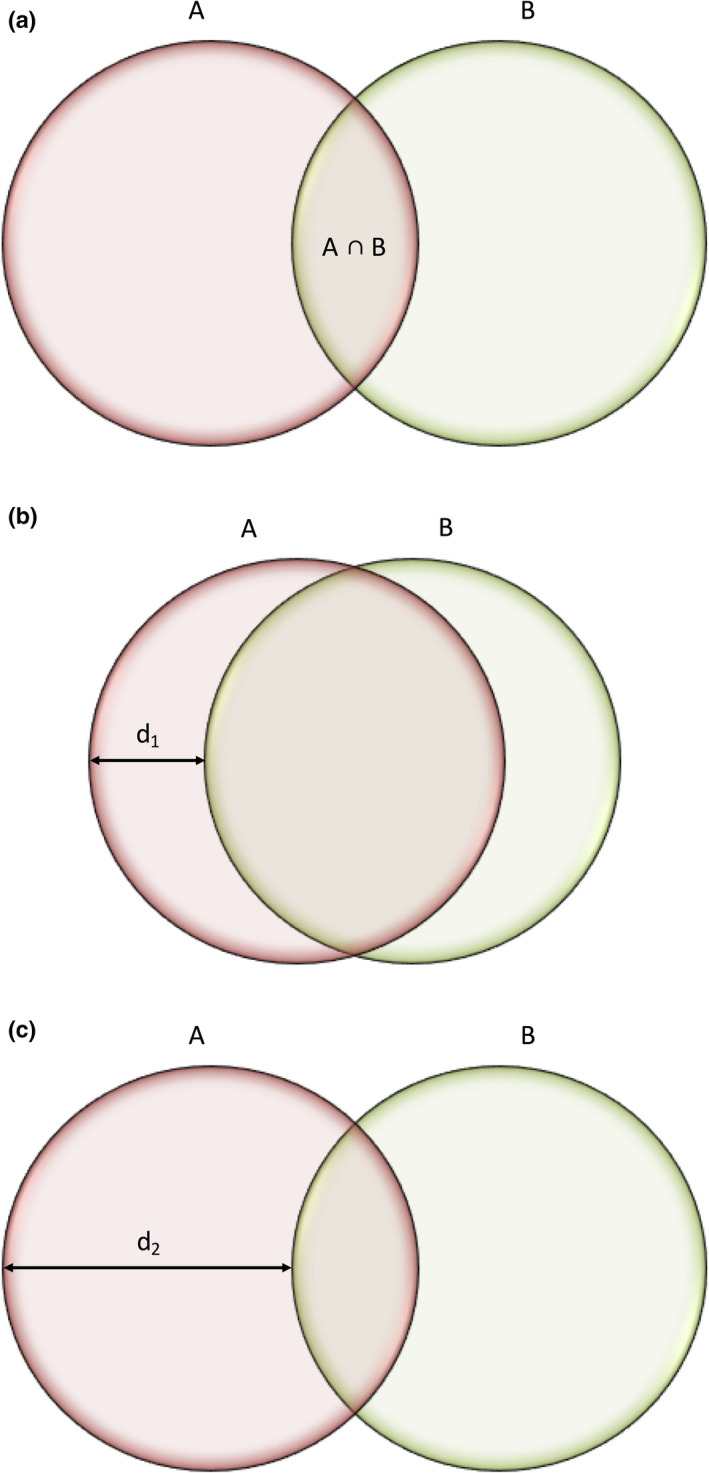
Visualisation of Similarity Metrics. (a) The Dice Similarity Coefficient Represents an Index of Overlap (A ∩ B) Between Two Segmentations, Calculated as where 0 Represents No Overlap and 1 Perfect Alignment. (b) Two Segmentations A and B will have A Small Hausdorff Distance (d1) if the Segmentations are Close to Each Other. (c) Two Segmentations A and B will have a Large Hausdorff Distance (d2) if the Segmentations are Far from Each Other.
Figure 3.
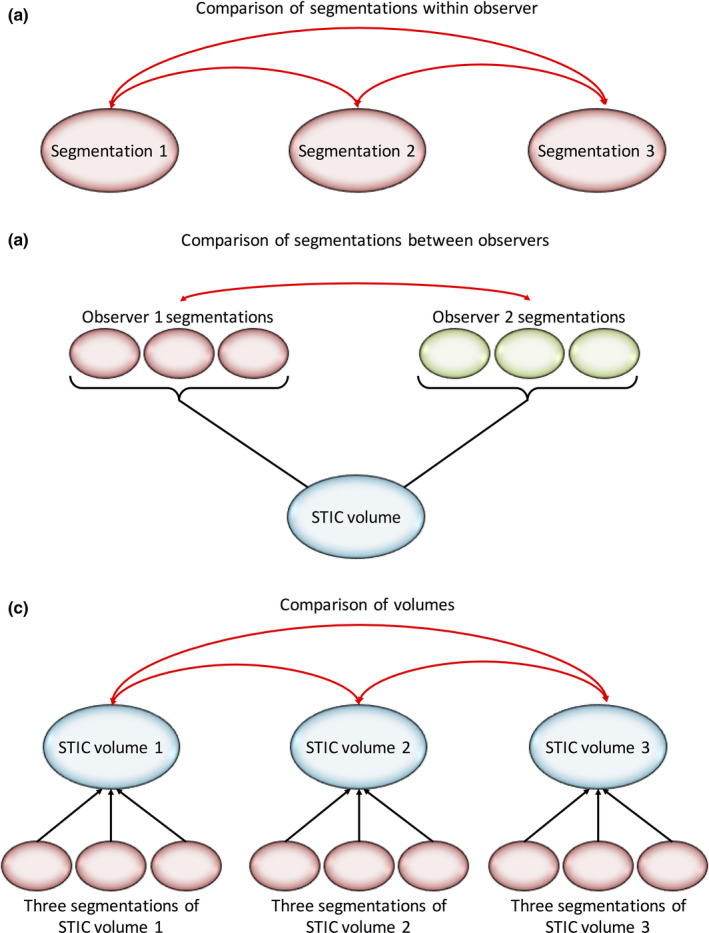
Calculation of Intraclass Correlation Coefficients (ICCs). (a) Intra‐observer ICC (One‐way Random Single Measures, Agreement) – Comparison of Segmentations Drawn by Observer 1. (b) Interobserver ICC (Two‐Way Mixed, Single Measures, Agreement) – Comparison of Segmentations Drawn by Observers 1 and 2. (c) Comparison of the Three Spatial–Temporal Image Correlation (STIC) Volumes Using ICC (One‐Way Random, Average Measures, Agreement). Three Segmentations were Drawn on the STIC Volume, thus, Producing Three Sets of Volumetric Impedance Indices Per STIC Volume. An Average of These Three Volumetric Impedance Indices was Taken to Produce a Single Value that Represented Each STIC Volume.
ICCs were used to assess intra‐ and interobserver repeatability of volumetric impedance indices measured from repeated segmentation on the same STIC volume, reliability of indices measured from the three STIC volumes and for the 2D indices as shown in Figure 3. We considered ICC > 0.70 to be the minimum standard for reliability.31 Correlation between renal artery impedance indices and STIC‐derived impedance indices was assessed using Pearson's correlation coefficient. To account for normal beat‐to‐beat variation in the fetus,32 participant data were only used for this analysis if all three STIC volumes successfully formed cardiac cycles. All statistical analysis was performed using SPSS version 23 (IBM Corp. IBM SPSS Statistics, Armonk, NY) with results considered significant where P < 0.05.
Results
Fifty‐seven patients were recruited, with full data acquisition in 48 cases (85.7%); reasons for exclusions are shown in Figure 4. Descriptive statistics are shown in Table 1. Each STIC volume was segmented in triplicate by two observers, producing 18 segmentations per participant, a total of 864 segmentations. Each segmentation took 10–20 min. Moving through the coronal plane, all 2D slices in each segmentation were reviewed manually, with an average of 47.8 and 45.7 slices per segmentation drawn by observers 1 and 2, respectively (20,636 slices for observer 1; 19,725 slices for observer 2; 40,361 slices in total). When VFI and FMBV were plotted against frame number, 102 (70.8%) and 98 (68.1%) of STIC volumes from VFI and FMBV successfully produced biphasic cardiac cycles (Table 2). Figure 5 shows typical examples where STIC volumes were or were not biphasic. In 29 participants (60.4%), all three STIC volumes formed successful cardiac cycles for either VFI or FMBV. For these participants, the CoV for 2D PWD‐estimated and STIC‐estimated FHR was 2.97% (95% CI 2.23–3.71%) and 7.78% (6.19–9.36%), respectively. Two‐dimensional PWD‐estimated FHR was on average 15.7 bpm (11.7%; SD = 13.1 bpm) greater than STIC‐estimated FHR, with a trend to greater divergence at higher overall rates (Figure 6).
Figure 4.
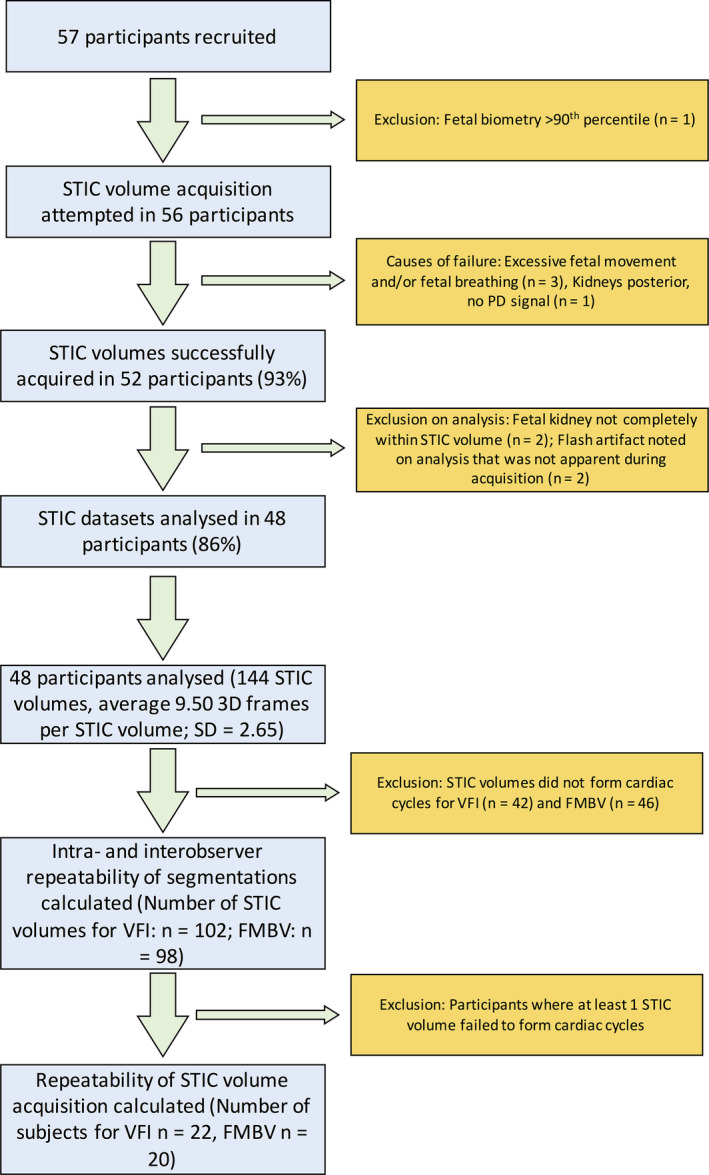
Flow Chart of Participant Inclusion and Exclusion. Spatial–Temporal Image Correlation Images were Acquired and Vascularity Measured Using Vascularisation‐Flow Index and Fractional Moving Blood Volume.
Table 1.
Descriptive statistics for all measured parameters including the volumetric pulsatility index (vPI), volumetric resistance index (vRI) and volumetric systolic/diastolic ratio (vS/D)
| Parameter | Mean | SD | Min. | Max. | |
|---|---|---|---|---|---|
| Demographics | Gestational age (weeks) | 32.84 | 4.62 | 21.14 | 39.71 |
| Maternal age (years) | 32.92 | 4.07 | 25.00 | 46.00 | |
| Maternal BMI | 22.83 | 3.03 | 18.29 | 29.75 | |
| Number of 3D frames | 9.50 | 2.65 | 5 | 18 | |
| 2D renal artery indices | PI | 2.21 | 0.30 | 1.53 | 2.90 |
| RI | 0.87 | 0.04 | 0.75 | 0.93 | |
| S/D | 8.15 | 2.06 | 4.03 | 13.71 | |
| VFI‐derived impedance indices | vPI | 0.16 | 0.11 | 0.02 | 0.62 |
| vRI | 0.14 | 0.09 | 0.02 | 0.45 | |
| vSD | 1.18 | 0.16 | 1.02 | 1.97 | |
| FMBV‐derived impedance indices | vPI | 0.10 | 0.07 | 0.03 | 0.44 |
| vRI | 0.09 | 0.06 | 0.03 | 0.35 | |
| vS/D | 1.11 | 0.09 | 1.03 | 1.54 | |
Table 2.
Number of participants with 0, 1, 2 or 3 spatial–temporal image correlation (STIC) volumes that produced successful cardiac cycles when vascularisation‐flow index (VFI) and fractional moving blood volume (FMBV) were plotted against frame number
| STIC volumes producing cardiac cycles | 0 | 1 | 2 | 3 |
|---|---|---|---|---|
| VFI | 4 | 8 | 14 | 22 |
| FMBV | 3 | 12 | 13 | 20 |
Figure 5.
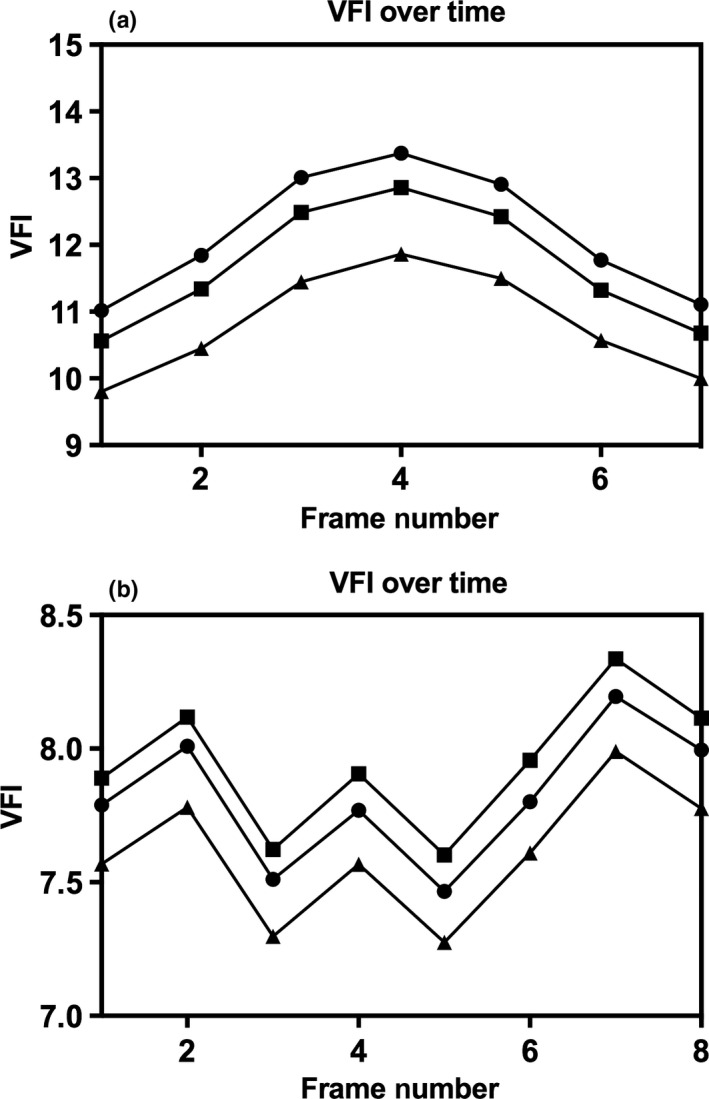
Plots of Indices Over Frame Number Showing Successful (a) and Failed (b) Cardiac Cycle Reconstructions for Vascularisation‐Flow Index. The Three Lines Represent the Three Segmentations that were Defined for the Same Spatial–Temporal Image Correlation Volume.
Figure 6.
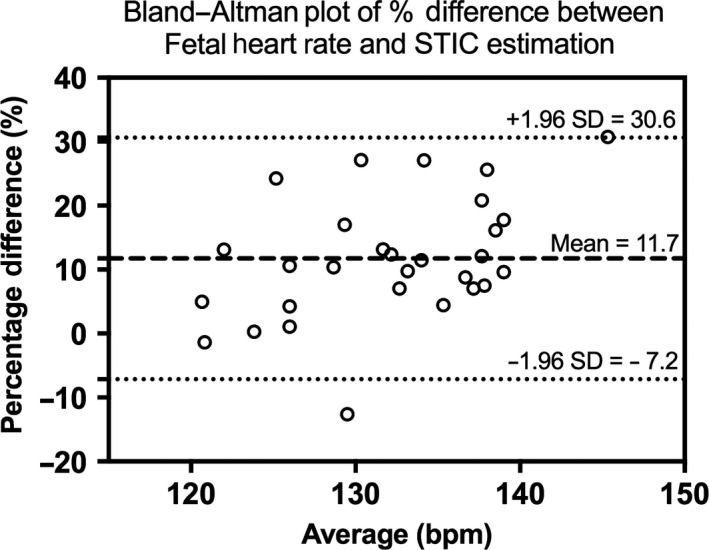
Bland–Altman Plot Showing Percentage Difference of Fetal Heart Rate Measured by Renal Artery Pulsed‐Wave Doppler Compared to Spatial–Temporal Image Correlation.
Mean intra‐observer DSCs for observer 1 and 2 were 0.90 (95% CI 0.82–0.98) and 0.87 (0.75–0.99). Mean interobserver DSC was 0.81 (0.67–0.96). Mean intra‐observer Hausdorff distance for observers 1 and 2 was 3.88 mm (1.63–6.12 mm) and 3.98 mm (1.49–6.46 mm). Interobserver Hausdorff distance was 5.27 mm (2.35–8.18 mm). The average kidney volume measured by observers 1 and 2 was 9.88 mL and 8.54 mL, respectively. Mean percentage difference in kidney volume between observer 1 and 2 was 16.1% (−19.3–51.4%) (Figure 7). When comparing kidney volume measured from segmentations drawn on the same STIC volume, mean intra‐observer CoV for observers 1 and 2 was 5.3% (4.7–6.0%) and 8.1% (7.0–9.1%). Intra‐observer ICCs (95% CI) were 0.97 (0.96–0.98) and 0.93 (0.91–0.95) for observers 1 and 2, respectively. Interobserver ICC was 0.85 (0.34–0.95). When assessing volume variation between the three STIC volumes acquired from the same participant, intra‐observer ICC was 0.97 (0.96–0.98) and 0.97 (0.95–0.98) as measured by observers 1 and 2, respectively.
Figure 7.
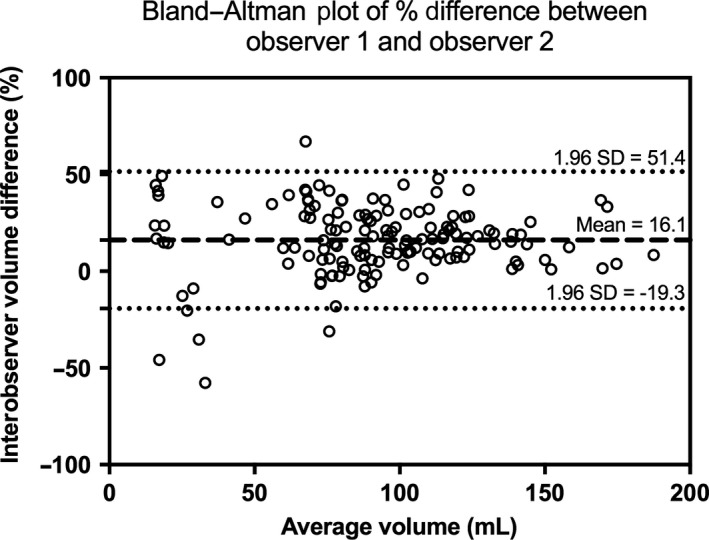
Bland–Altman Plot of Percentage Difference in Measured Volume Between Observer 1 and Observer 2.
Intra‐ and interobserver ICCs for repeated segmentation of the same STIC volume were ≥ 0.97 and ≥ 0.95, respectively, for all volumetric impedance indices (Table 3). When comparing the three STIC volumes acquired from the same participant, ICCs were ≥ 0.77, ≥ 0.61 and ≥ 0.58 for volumetric impedance indices derived from VFI, volumetric indices derived from FMBV and 2D impedance indices, respectively (Table 4).
Table 3.
Intra‐ and interobserver intraclass correlation coefficients (ICCs) assessing repeatability of the impedance indices measured from segmentation of the same STIC volume, as measured using vascularisation‐flow index (VFI) and fractional moving blood volume (FMBV)
| Vascular index | Parameter | Intra‐observer ICC (Observer 1) | Intra‐observer ICC (Observer 2) | Interobserver ICC |
|---|---|---|---|---|
| VFI (n = 102) | vPI | 1.00 (0.99–1.00) | 0.98 (0.97–0.98) | 0.98 (0.97–0.99) |
| vRI | 1.00 (1.00–1.00) | 0.98 (0.97–0.99) | 0.98 (0.96–0.98) | |
| vS/D | 0.99 (0.99–1.00) | 0.97 (0.95–0.98) | 0.98 (0.96–0.98) | |
| FMBV (n = 98) | vPI | 0.98 (0.97–0.99) | 0.96 (0.95–0.97) | 0.96 (0.94–0.97) |
| vRI | 0.98 (0.97–0.99) | 0.97 (0.95–0.98) | 0.96 (0.94–0.97) | |
| vS/D | 0.98 (0.97–0.98) | 0.96 (0.94–0.97) | 0.96 (0.94–0.97) |
Table 4.
Intraclass correlation coefficients (ICCs) assessing variation between the three ultrasound measurements acquired from the same participant for the volumetric pulsatility index (vPI), volumetric resistance index (vRI) and volumetric systolic/diastolic ratio (vS/D) derived from vascularisation‐flow index (VFI) and fractional moving blood volume (FMBV)
| Vascular index | Parameter | ICC |
|---|---|---|
| VFI (n = 22) | vPI | 0.80 (0.60–0.91) |
| vRI | 0.81 (0.63–0.92) | |
| vS/D | 0.77 (0.53–0.90) | |
| FMBV (n = 20) | vPI | 0.62 (0.20–0.84) |
| vRI | 0.62 (0.20–0.84) | |
| vS/D | 0.61 (0.19–0.83) | |
| Renal artery PWD (n = 48) | PI | 0.60 (0.44–0.77) |
| RI | 0.59 (0.43–0.73) | |
| S/D | 0.58 (0.69–0.89) |
Histograms of the volumetric impedance indices were positively skewed, requiring logarithmic transformation. Pearson's correlation coefficient (r) showed weak correlation between renal artery PWD indices and their respective volumetric indices (Table 5).
Table 5.
Correlation using Pearson's correlation coefficient (r) between renal artery impedance indices and volumetric impedance indices. All indices were log transformed
| Indices Compared | r | |
|---|---|---|
| 2D vs. 4D VFI (n = 22) | PI vs. vPI‐VFI | 0.40 |
| RI vs. vRI‐VFI | 0.50 | |
| S/D vs. vS/D‐VFI | 0.16 | |
| 2D vs. 4D FMBV (n = 20) | PI vs. vPI‐FMBV | <0.01 |
| RI vs. vRI‐FMBV | 0.20 | |
| S/D vs. vS/D‐FMBV | 0.01 |
Discussion
With 93% successful acquisition, it is feasible to acquire STIC volumes in the fetal kidney, and periodic variation in vascularity was observed in the majority of volumes (VFI: 71%; FMBV: 68%). The use of raw ultrasound data allowed direct comparison of voxel selection between segmentations. This demonstrated excellent overlap between the segmented volumes with an intra‐observer DSC and Hausdorff distance of 0.90 and 3.81 mm, respectively, comparable to previously reported intra‐observer DSC of 0.86 in the placenta33 and 0.85 in the paediatric kidney.34 There appear to be no previous studies evaluating STIC impedance indices that have compared DSC and Hausdorff distances, as most publications have relied on commercial software which does not allow access to voxel values or volume comparison, precluding comparison of voxel selection.1, 35, 36 Measured kidney volume may be affected by both errors in volume acquisition and the segmentation process. This study demonstrates excellent repeatability in both these domains, thus, validating volumetric impedance indices subsequently calculated from these STIC volumes.
To the best of our knowledge, this study is the first to perform triplication of 3D kidney segmentation by two observers. Whilst previous work shows much poorer reproducibility for kidney segmentation (ICC = 0.37),19 this may have been due to the different volume acquisition process where the entire fetal abdomen was captured in the 3D volume. In contrast, we minimised the field of view to capture only the kidney. Our results reflect the need to standardise volumetric acquisition to reduce error, as suggested previously.37
Despite segmentation repeatability, the volumetric impedance indices demonstrated significant variability between STIC data sets, which may appear to undermine 4D vascular impedance measurement. However, this variability is no greater than that shown using the gold standard Doppler tool for impedance measurement, 2D PWD, particularly with regard to interobserver ICC.38 This result instead suggests high beat‐to‐beat physiological variability, potentially indicative of the immature fetal vascular field.32 The lower variability between segmentations compared to variability between successive data sets suggests physiological variation as a cause rather than observer error, although this large physiological variation may potentially reduce the tool's translational use. At present, this is unclear, as only one study has attempted to apply these volumetric impedance indices as a clinical tool.35 As far as we are aware, this is the only study examining STIC in the fetal kidney, so no reference ranges for these volumes or vascular indices are currently available. Further studies are required to determine a reference range.
Our method for kidney segmentation differed from the VOCAL or multiplanar techniques used in previous studies.37 A comparison between these methods was not performed, but 3D interpolative segmentation has proven to be concordant or better in terms of reproducibility than VOCAL in other areas.33 Whilst STIC volume acquisition is feasible, a limitation of this technique is that it requires offline analysis, precluding immediate acquisition of replacement STIC volumes, and limiting clinical translation of these indices. With automated segmentation, these indices could be calculated and reported in real time.
Despite high acquisition rates and large number of STIC volumes demonstrating periodical variation in vascularity (VFI: 71%, FMBV: 68%), less than half of the participants had three STIC volumes that were all clearly biphasic (VFI: 45%, FMBV: 42%). Failure to demonstrate biphasic periodicity representative of cardiac cycles may be due to inaccuracies in STIC‐estimated FHR, as renal artery FHR was on average 15.7 bpm higher despite STIC FHRs being within the normal range of 110–170 bpm, potentially resulting in inaccurately reconstructed cardiac cycles. STIC was primarily designed for the fetal heart, an organ with many rapidly moving components generating coarse B‐mode variation.20, 39 In contrast, the fetal kidney is a non‐contractile organ with relatively fine PD variation, so even very slight fetal movements during apparent quiescence may result in miscalculated FHR.
Conclusion
Three‐dimensional segmentation of the fetal kidney is highly reproducible. Evaluation of renal vascular impedance indices using STIC PD imaging is technically feasible and highly repeatable although a high degree of presumed physiological variability was noted. Whilst STIC could potentially be used to assess fetal renal function, this and technical limitations may currently preclude clinical application. New transducer technology such as plane‐wave Doppler imaging and 2D matrix probes with much higher frame rate detection than is currently available may allow the STIC concept to be applied with greater success in future.
Acknowledgements
This work was made possible by an ASUM grant, initially supporting Jennifer Sanderson to conduct this work, and a Major Research Equipment and Infrastructure Initiative grant of the University of New South Wales. Dr Stevenson is supported by a grant from the Lesley Stevens Foundation, Sydney.
References
- 1.Martins WP, Welsh AW, Lima JC, Nastri CO, Raine‐Fenning NJ. The “volumetric” pulsatility index as evaluated by spatiotemporal imaging correlation (STIC): a preliminary description of a novel technique, its application to the endometrium and an evaluation of its reproducibility. Ultrasound Med Biol 2011; 37(12): 2160–8. [DOI] [PubMed] [Google Scholar]
- 2.Vyas S, Nicolaides K, Campbell S. Renal artery flow‐velocity waveforms in normal and hypoxemic fetuses. Am J Obstet Gynecol 1989; 161(1): 168–72. [DOI] [PubMed] [Google Scholar]
- 3.Stigter R, Mulder E, Bruinse H, Visser G. Doppler studies on the fetal renal artery in the severely growth‐restricted fetus. Ultrasound Obstet Gynecol 2001; 18(2): 141–5. [DOI] [PubMed] [Google Scholar]
- 4.Baba K, Satoh K, Sakamoto S, Okai T, Ishii S. Development of an ultrasonic system for three‐dimensional reconstruction of the fetus. J Perinat Med 1989; 17(1): 19–24. [DOI] [PubMed] [Google Scholar]
- 5.Pairleitner H, Steiner H, Hasenoehrl G, Staudach A. Three‐dimensional power Doppler sonography: imaging and quantifying blood flow and vascularization. Ultrasound Obstet Gynecol 1999; 14(2): 139–43. [DOI] [PubMed] [Google Scholar]
- 6.Raine‐Fenning NJ, Nordin NM, Ramnarine KV, Campbell BK, Clewes JS, Perkins A, et al. Determining the relationship between three‐dimensional power Doppler data and true blood flow characteristics: an in‐vitro flow phantom experiment. Ultrasound Obstet Gynecol 2008; 32(4): 540–50. [DOI] [PubMed] [Google Scholar]
- 7.Morel O, Pachy F, Chavatte‐Palmer P, Bonneau M, Gayat E, Laigre P, et al. Correlation between uteroplacental three‐dimensional power Doppler indices and true uterine blood flow: evaluation in a pregnant sheep model. Ultrasound Obstet Gynecol 2010; 36(5): 635–40. [DOI] [PubMed] [Google Scholar]
- 8.Lai PK, Wang YA, Welsh AW. Reproducibility of regional placental vascularity/perfusion measurement using 3D power Doppler. Ultrasound Obstet Gynecol 2010; 36(2): 202–9. [DOI] [PubMed] [Google Scholar]
- 9.Raine‐Fenning NJ, Nordin NM, Ramnarine KV, Campbell BK, Clewes JS, Perkins A, et al. Evaluation of the effect of machine settings on quantitative three‐dimensional power Doppler angiography: an in‐vitro flow phantom experiment. Ultrasound Obstet Gynecol 2008; 32(4): 551–9. [DOI] [PubMed] [Google Scholar]
- 10.Martins WP, Raine‐Fenning NJ, Ferriani RA, Nastri CO. Quantitative three‐dimensional power Doppler angiography: a flow‐free phantom experiment to evaluate the relationship between color gain, depth and signal artifact. Ultrasound Obstet Gynecol 2010; 35(3): 361–8. [DOI] [PubMed] [Google Scholar]
- 11.Kudla MJ, Alcazar JL. Spatiotemporal image correlation using high‐definition flow: a new method for assessing ovarian vascularization. J Ultrasound Med 2010; 29(10): 1469–74. [DOI] [PubMed] [Google Scholar]
- 12.Welsh AW, Hou M, Meriki N, Stevenson G. Use of four‐dimensional analysis of power Doppler perfusion indices to demonstrate cardiac cycle pulsatility in fetoplacental flow. Ultrasound Med Biol 2012; 38(8): 1345–51. [DOI] [PubMed] [Google Scholar]
- 13.Stevenson GN, Collins SL, Welsh AW, Impey LW, Noble JA. A technique for the estimation of fractional moving blood volume by using three‐dimensional power Doppler US. Radiology 2015; 274(1): 230–7. [DOI] [PubMed] [Google Scholar]
- 14.Hernandez‐Andrade E, Jansson T, Ley D, Bellander M, Persson M, Lingman G, et al. Validation of fractional moving blood volume measurement with power Doppler ultrasound in an experimental sheep model. Ultrasound Obstet Gynecol 2004; 23(4): 363–8. [DOI] [PubMed] [Google Scholar]
- 15.Rubin JM, Adler RS, Fowlkes JB, Spratt S, Pallister JE, Chen JF, et al. Fractional moving blood volume: estimation with power Doppler US. Radiology 1995; 197(1): 183–90. [DOI] [PubMed] [Google Scholar]
- 16.Yoshizaki CT, Francisco RP, de Pinho JC, Ruano R, Zugaib M. Renal volumes measured by 3‐dimensional sonography in healthy fetuses from 20 to 40 weeks. J Ultrasound Med 2013; 32(3): 421–7. [DOI] [PubMed] [Google Scholar]
- 17.Tedesco GD, Bussamra LC, Araujo Junior E, Britto IS, Nardozza LM, Moron AF, et al. Reference range of fetal renal volume by three‐dimensional ultrasonography using the VOCAL method. Fetal Diagn Ther 2008;25(4):385–91. [DOI] [PubMed] [Google Scholar]
- 18.Hsieh YY, Chang CC, Lee CC, Tsai HD. Fetal renal volume assessment by three‐dimensional ultrasonography. Am J Obstet Gynecol 2000;182(2):377–9. [DOI] [PubMed] [Google Scholar]
- 19.Simcox LE, Higgins LE, Myers JE, Johnstone ED. Intraexaminer and interexaminer variability in 3D fetal volume measurements during the second and third trimesters of pregnancy. J Ultrasound Med 2017;36:1415–29. [DOI] [PubMed] [Google Scholar]
- 20.DeVore GR, Falkensammer P, Sklansky MS, Platt LD. Spatio‐temporal image correlation (STIC): new technology for evaluation of the fetal heart. Ultrasound Obstet Gynecol 2003; 22(4): 380–7. [DOI] [PubMed] [Google Scholar]
- 21.Collins S, Stevenson G, Noble J, Impey L, Welsh A. Influence of power Doppler gain setting on Virtual Organ Computer‐aided AnaLysis indices in vivo: can use of the individual sub‐noise gain level optimize information? Ultrasound Obstet Gynecol 2012; 40(1): 75–80. [DOI] [PubMed] [Google Scholar]
- 22.Bude RO, Rubin JM. Gain setting in power Doppler US. Radiology 1997; 202: 284–5. [DOI] [PubMed] [Google Scholar]
- 23.Stevenson GN, Collins SL, Welsh AW, Impey LW, Noble JA. A technique for the estimation of fractional moving blood volume by using three‐dimensional power Doppler US. Radiology 2015; 274: 230–7. [DOI] [PubMed] [Google Scholar]
- 24.Pérez F, Granger BE. IPython: a system for interactive scientific computing. Comput Sci Eng 2007; 9(3): 21–9. [Google Scholar]
- 25.Welsh AW, Hou M, Meriki N, Martins WP. Spatiotemporal image correlation‐derived volumetric Doppler impedance indices from spherical samples of the placenta: intraobserver reliability and correlation with conventional umbilical artery Doppler indices. Ultrasound Obstet Gynecol 2012; 40(4): 431–6. [DOI] [PubMed] [Google Scholar]
- 26.Dymling SO, Persson HW, Hertz CH. Measurement of blood perfusion in tissue using Doppler ultrasound. Ultrasound Med Biol 1991; 17(5): 433–44. [DOI] [PubMed] [Google Scholar]
- 27.Rubin JM, Bude RO, Fowlkes JB, Spratt RS, Carson PL, Adler RS. Normalizing fractional moving blood volume estimates with power Doppler US: defining a stable intravascular point with the cumulative power distribution function. Radiology 1997; 205(3): 757–65. [DOI] [PubMed] [Google Scholar]
- 28.Dice LR. Measures of the amount of ecologic association between species. Ecology 1945; 26(3): 297–302. [Google Scholar]
- 29.Huttenlocher DP, Klanderman GA, Rucklidge WJ. Comparing images using the Hausdorff distance. IEEE Trans Pattern Anal Mach Intell 1993; 15(9): 850–63. [Google Scholar]
- 30.Lowekamp BC, Chen DT, Ibáñez L, Blezek D. The design of SimpleITK. Front Neuroinform 2013; 7: 45. [DOI] [PMC free article] [PubMed] [Google Scholar]
- 31.Kottner J, Gajewski BJ, Streiner DL. Guidelines for reporting reliability and agreement studies (GRRAS). Int J Nurs Stud 2011; 48(6): 659–60. [DOI] [PubMed] [Google Scholar]
- 32.Yeh S‐Y, Forsythe A, Hon EH. Quantification of fetal heart beat‐to‐beat interval differences. Obstet Gynecol 1973; 41(3): 355–63. [PubMed] [Google Scholar]
- 33.Stevenson GN, Collins SL, Ding J, Impey L, Noble JA. 3‐D ultrasound segmentation of the placenta using the random walker algorithm: reliability and agreement. Ultrasound Med Biol 2015; 41(12): 3182–93. [DOI] [PubMed] [Google Scholar]
- 34.Cerrolaza JJ, Safdar N, Peters CA, Myers E, Jago J, Linguraru MG, editors. Segmentation of kidney in 3D‐ultrasound images using Gabor‐based appearance models. Biomedical Imaging (ISBI), 2014 IEEE 11th International Symposium on; 2014: IEEE.
- 35.Alcazar JL, Kudla MJ. Ovarian stromal vessels assessed by spatiotemporal image correlation‐high definition flow in women with polycystic ovary syndrome: a case‐control study. Ultrasound Obstet Gynecol 2012; 40(4): 470–5. [DOI] [PubMed] [Google Scholar]
- 36.Polanski LT, Baumgarten MN, Brosens JJ, Quenby SM, Campbell BK, Martins WP, et al. 4‐D assessment of endometrial vascularity using spatiotemporal image correlation: a study comparing spherical sampling and whole‐tissue analysis. Ultrasound Med Biol 2015; 41(11): 2798–805. [DOI] [PubMed] [Google Scholar]
- 37.Ioannou C, Sarris I, Salomon LJ, Papageorghiou AT. A review of fetal volumetry: the need for standardization and definitions in measurement methodology. Ultrasound Obstet Gynecol 2011;38(6):613–9. [DOI] [PubMed] [Google Scholar]
- 38.Scherjon SA, Kok JH, Oosting H, Zondervan HA. Intra‐observer and inter‐observer reliability of the pulsatility index calculated from pulsed Doppler flow velocity waveforms in three fetal vessels. Br J Obstet Gynaecol 1993; 100(2): 134–8. [DOI] [PubMed] [Google Scholar]
- 39.Martins WP, Welsh AW, Falkensammer P, Raine‐Fenning NJ. Re: spatio‐temporal imaging correlation (STIC): technical notes about STIC triggering and choosing between power Doppler or high‐definition color flow. Ultrasound Med Biol 2013; 39(3): 549–50. [DOI] [PubMed] [Google Scholar]


