

Abstract
Aims/Introduction
The aim of this study was to elucidate whether sodium–glucose cotransporter 2 inhibitors (SGLT2is) treatment has any renoprotective effect for type 2 diabetes mellitus patients with an estimated glomerular filtration rate (eGFR) of <60 mL/min/1.73 m2 in clinical practice.
Materials and Methods
We evaluated the annual eGFR slope in 85 type 2 diabetes mellitus patients with renal impairment, treated with SGLT2is ≥2 years. Each patient's eGFR was <60 mL/min/1.73 m2 at the start of SGLT2is therapy. The calculation of the annual change in eGFR for each patient was obtained by acquired eGFR data before and after 2 years of the initial SGLT2is administration, followed by analysis of the changes in the mean eGFR slope.
Results
The participants' mean age was 72.0 ± 9.4 years, and the mean eGFR was 47.1 ± 9.7 mL/min/1.73 m2 at the start of additional treatment with SGLT2is. The mean annual eGFR slope after SGLT2is administration (−0.11 ± 0.20 mL/min/1.73 m2/year) was significantly slower than before SGLT2is administration (−2.93 ± 0.59 mL/min/1.73 m2/year; P < 0.0001). Additionally, SGLT2is treatment slowed the annual decline of eGFR, independent of the levels of both the initial eGFR and albuminuria levels before SGLT2is therapy was started. In the patient groups who showed an annual eGFR decline of ≥3 and 1–3 mL/min/1.73 m2, there was a significant slowing of the decline after SGLT2is therapy, compared with before the treatment (P < 0.001, respectively).
Conclusions
SGLT2is administration slows the decline observed in the annual renal function in type 2 diabetes mellitus patients with eGFR of <60 mL/min/1.73 m2 in clinical practice.
Keywords: Annual estimated glomerular filtration rate decline, Diabetic kidney disease, Sodium–glucose cotransporter 2 inhibitor
Administration of sodium–glucose cotransporter 2 inhibitors slowed the annual estimated glomerular filtration rate decline in type 2 diabetes patients with an estimated glomerular filtration rate of <60 mL/min/1.73 m2.
Introduction
During the recent decades, dipeptidyl peptidase‐4 inhibitors, glucagon‐like peptide‐1 (GLP‐1) receptor agonists and sodium–glucose cotransporter 2 inhibitors (SGLT2is) have become clinically available, after large clinical trials on cardiovascular outcomes had been evaluated to determine the efficacy and safety of such novel antidiabetic medications. In particular, SGLT2is have been shown to block the action of SGLT2, which is mainly responsible for the reabsorption of the filtrated glucose in the kidney proximal convoluted tubules, thereby, increasing urinary glucose excretion and lowering glucose levels1. Additionally, clinical evidence regarding cardiorenal protective effects of SGLT2is, such as empagliflozin, canagliflozin and dapagliflozin, from four randomized controlled trials (RCTs) has been accumulated2, 3, 4, 5, 6, 7. The systematic review/meta‐analysis by Neuen et al.,8 which analyzed the four RCTs, clearly showed that SGLT2is are capable of suppressing the progression of chronic kidney disease (CKD) among patients with type 2 diabetes mellitus, through their classic effect of reducing renal tubular glucose reabsorption to facilitate excretion to aid plasma glucose homeostasis. Furthermore, Comparative Effectiveness of Cardiovascular Outcomes in New Users of SGLT‐2 Inhibitors (CVD‐REAL 3), a multinational observational cohort study, evaluated the change in the estimated glomerular filtration rate (eGFR) among new users of SGLT2is, as well as other glucose‐lowering drugs before and after administration using real‐world clinical data9. The results of this cohort study showed that SGLT2is slowed the decline of eGFR, compared with those of other glucose‐lowering drugs9. However, in the CVD‐REAL 3 studies, >90% of the patients at the observational baseline had eGFR ≥60 mL/min/1.73 m2. Therefore, it is unclear if the renoprotective effect of SGLT2is on type 2 diabetes mellitus patients with conditions of CKD applies in real clinical practice. Herein, we investigated the effect of SGLT2is on the annual change of eGFR in type 2 diabetes mellitus patients with CKD of eGFR <60 mL/min/1.73 m2 at the start of SGLT2is therapy by analyzing patients' clinical data and records in a retrospective cohort study.
Methods
Study population
The present retrospective cohort study was carried out in the Department of Endocrinology and Metabolism, Kanazawa Medical University Hospital, Uchinada, Ishikawa, Japan. The study was designed in adherence to the tenets of the declaration of Helsinki. It was carried out as a part of the single‐center cohort study to elucidate factors associated with the pathogenesis and prognosis of diabetic complications. The ethics committee of Kanazawa Medical University approved the protocol (approval no. E 019), waiving the authorization to use human participants, as this was a historical cohort study and not a prospective interventional study. Inform consent was provided by each patient to enable access to their medical records. The data used were obtained from each patient's medical record and laboratory database of the hospital.
We identified 1,244 outpatients with type 2 diabetes mellitus who were treated with SGLT2is in September 2019 and were recruited in the cohort clinical study. Among them, we included 85 patients who suffered renal impairment with eGFR of <60 mL/min/1.73 m2, calculated by serum creatinine (Cr) at the beginning of SGLT2is administration, with eGFR data obtained >6 months before the start of SGLT2is therapy began. The exclusion criteria were as follows: (i) type 1 diabetes mellitus patients; (ii) type 2 diabetes mellitus patients aged <20 years; (iii) patient did not provide consent; (iv) eGFR data were absent from a patient record before the administration of SGLT2is; (v) patient's poor adherence of the medication administration; (vi) patient's eGFR ≥60 mL/min/1.73 m2 at the initiation of SGLT2is treatment; and (vii) patients with ≥3 months interruption of taking SGLT2is during the study period.
Study protocol and clinical outcomes
We collected clinical information, such as medical drug treatment and history of diabetes, from the patients' medical records. Additionally, we collected physiological data, including height, bodyweight (BW), body mass index (BMI) and blood pressure, glycated hemoglobin (HbA1c), plasma glucose (PG), and eGFR at 24, 18, 12 and 6 months before drug treatment, at the start, and 6, 12, 18 and 24 months after the administration of SGLT2is. The urinary albumin/Cr ratio (UACR) was collected at the start, and 6 months, 1 year and 2 years after SGLT2is administration, and the change of UACR after log‐transformation was analyzed.
We set the change of annual eGFR slope, measured in mL/min/1.73 m2/year units before and after administration of SGLT2is, as the significant clinical outcome, and the slope was calculated as an annual change of eGFR by the least‐square method using data of eGFR before and after 2 years from the start of SGLT2is administration.
Statistical analysis
Demographic characteristics data are shown as the mean ± standard deviation [SD]. All laboratory data and eGFR slopes are reported as the mean ± standard error [SE]. We compared the eGFR slope before and after administration of SGLT2is by a paired Student’s t‐test to elucidate the effects of SGLT2is. For adjustment of multivariate, sex and age (model 1), model 1 + ΔHbA1c (model 2) and model 2 + ΔBMI (model 3) were analyzed using a linear mixed model. ΔHbA1c and ΔBMI are defined as the annual change of HbA1c and BMI throughout this study. In addition, we analyzed the changes of eGFR slope according to each patient group’s eGFR baseline (45–60, 30–45, <30 mL/min/1.73 m2), UACR estimation: (normo‐ [<30 mg/g Cr], micro‐ [30–300 mg/g Cr], macroalbuminuria [>300 mg/g Cr]), without or with the renin–angiotensin–aldosterone system (RAAS) inhibitors, and patients’ groups with annual eGFR slope decline before SGLT2is administration (group 1: ≥3, group 2: 1–3 and group 3: <1 mL/min/1.73 m2/year). A P‐value <0.05 was considered statistically significant. Statistical analyses were carried out using the Statistical Package for Social Sciences software program, version 26 (SPSS Inc., IBM, Tokyo, Japan).
Results
Clinical characteristics of patients at the start of SGLT2is administration
We analyzed 85 patients who had been treated with SGLT2is for ≥2 years, and also, had eGFR of <60 mL/min/1.73 m2 at the start of SGLT2is administration. Demographic characteristics and clinical parameters at the start of SGLT2is administration are shown in Table 1 (data are shown as the mean ± SD). The mean age was 72.0 ± 9.4 years, the mean duration of type 2 diabetes mellitus was 18.4 ± 9.4 years and mean BMI was 27.7 ± 5.3 kg/m2. A total of 41.2% of patients had been treated with insulin, 65.9% were treated with dipeptidyl peptidase‐4 inhibitor, 68.2% were treated with metformin and 3.5% were treated with GLP‐1 receptor agonist. According to patients’ records, the following SGLT2is were started: ipragliflozin 25 mg or 50mg/day, dapagliflozin 5 mg/ day, empagliflozin 10 mg/day, canagliflozin 100 mg/day, luseogliflozin 2.5 mg/day and tofogliflozin 20 mg/day) by attending physicians in our hospital in charge of glycemic control of diabetes patients. A total of 69.4% of the patients had received treatment with the RAAS inhibitors. Other medications for diabetes, hypertension and hyperlipidemia that were administered to the patients are shown in Table 1. In addition, the data of medication including antidiabetic drugs and other drugs at the end of the present study are shown in Table 1. The number of patients treated with GLP‐1 receptor agonist was significantly increased, with three at the start of SGLT2i administration to 14 at the end of the study (P < 0.0001, evaluated by McNemar’s test).
Table 1.
Characteristics of patients at the start of sodium–glucose cotransporter 2 inhibitors administration, and data of medication at the start and after 2 years of sodium–glucose cotransporter 2 inhibitors administration
| At the start of SGLT2 inhibitors | ||
|---|---|---|
| Age, years (n = 85) | 72.0 ± 9.4 | |
| Male, % (n = 51) | 60.0 | |
| Duration of diabetes, years (n = 85) | 18.4 ± 9.4 | |
| Bodyweight, kg (n = 85) | 71.3 ± 15.3 | |
| Body mass index, kg/m2 (n = 85) | 27.7 ± 5.3 | |
| Systolic BP, mmHg (n = 83) | 130.0 ± 17.0 | |
| Diastolic BP, mmHg (n = 83) | 70.0 ± 12.0 | |
| eGFR, mL/min/1.73 m2 (n = 85) | 47.1 ± 9.7 | |
| At the start of SGLT2is | After 2 years of SGLT2is | |
| Antidiabetic drugs (%) | ||
| Insulin | 41.2 (n = 35) | 38.8 (n = 33) |
| Sulfonyl urea | 25.9 (n = 22) | 30.1 (n = 26) |
| DPP‐4 inhibitor | 65.9 (n = 56) | 55.3 (n = 47) |
| Metformin | 68.2 (n = 58) | 69.4 (n = 59) |
| α‐Glucosidase inhibitor | 12.9 (n = 11) | 15.3 (n = 13) |
| Thiazolidine | 4.7 (n = 4) | 3.5 (n = 3) |
| GLP‐1 receptor agonist | 3.5 (n = 3) | 16.4 (n = 14) |
| SGLT2 inhibitors (%) | ||
| Empagliflozin | 40.0 (n = 34) | 38.8 (n = 33) |
| Ipragliflozin | 15.3 (n = 13) | 7.0 (n = 6) |
| Dapagliflozin | 15.3 (n = 13) | 18.8 (n = 16) |
| Luseogliflozin | 15.3 (n = 13) | 12.9 (n = 11) |
| Canagliflozin | 11.8 (n = 10) | 22.4 (n = 19) |
| Tofogliflozin | 2.4 (n = 2) | 0 (n = 0) |
| Other drugs (%) | ||
| ARB | 51.8 (n = 44) | 48.2 (n = 41) |
| ACEI | 20.0 (n = 17) | 21.1 (n = 18) |
| ARB + ACEI | 2.4 (n = 2) | 1.2 (n = 1) |
| Spironolactone | 12.9 (n = 11) | 15.3 (n = 13) |
| RAAS inhibitors | 69.4 (n = 59) | 68.2 (n = 58) |
| Calcium blocker | 56.5 (n = 48) | 55.3 (n = 47) |
| Diuretics | 32.9 (n = 28) | 24.7 (n = 21) |
| Statin | 64.0 (n = 54) | 67.1 (n = 57) |
| Fibrates | 10.6 (n = 9) | 11.8 (n = 10) |
Data presented as mean ± standard deviation. ACEI, angiotensin‐converting enzyme inhibitor; ARB, angiotensin II receptor blocker; BP, blood pressure; DPP‐4, dipeptidyl peptidase‐4 inhibitors; eGFR, estimated glomerular filtration rate; GLP‐1, glucagon‐like peptide‐1; RAAS, renin–angiotensin–aldosterone system; SGLT2, sodium–glucose cotransporter 2.
Changes in clinical parameters at the start and after additional treatment with SGLT2is
BW (n = 85) and BMI (n = 85) were significantly reduced after 2 years of SGLT2is administration, compared with those at the start. Systolic and diastolic blood pressure (n = 82) showed no change between the start and after adding SGLT2is treatment. The values of HbA1c (n = 84) and plasma glucose (n = 84) after 2 years of SGLT2is administration were lower than those at the start of SGLT2is treatment. Data are shown as the mean ± SE in Table 2.
Table 2.
Change in laboratory data between at the start and after 2 years of the administration of sodium–glucose cotransporter 2 inhibitors
| At the start | After 2 years | P‐value | |
|---|---|---|---|
| Bodyweight, kg (n = 85) | 71.3 ± 1.67 | 68.3 ± 1.62 | <0.001 |
| Body mass index, kg/m2 (n = 85) | 27.7 ± 0.58 | 26.6 ± 0.56 | <0.001 |
| Systolic BP, mmHg (n = 82) | 130.2 ± 1.93 | 126.7 ± 2.00 | 0.13 |
| Diastolic BP, mmHg (n = 82) | 70.0 ± 1.32 | 68.3 ± 1.35 | 0.28 |
| HbA1c, % (n = 84) | 8.0 ± 0.14 | 7.7 ± 0.10 | 0.04 |
| PG, mg/dL (n = 84) | 189.6 ± 7.29 | 169.1 ± 6.03 | 0.005 |
| eGFR, mL/min/1.73 m2 (n = 85) | 47.1 ± 1.06 | 46.6 ± 1.32 | 0.63 |
| Log‐transformed UACR, mg/g Cr (n = 81) | 2.02 ± 0.09 | 1.93 ± 0.10 | 0.18 |
| Log‐transformed UACR (mg/g Cr), UACR ≥30 mg/g Cr at baseline (n = 53) | 2.55 ± 0.07 | 2.38 ± 0.10 | 0.04 |
Date presented as mean ± standard error. Paired t‐test.
BP, blood pressure; Cr, creatinine; eGFR, estimated glomerular filtration rate; HbA1c, glycated hemoglobin; PG, plasma glucose; SE, standard error; UACR, urinary albumin/creatinine ratio.
All participants who had data of UACR at the start of SGLT2is (n = 81) showed no change between at the start and after 2 years of SGLT2is administration. However, when we analyzed the change of UACR in the patients who had UACR of ≥30 mg/g Cr at the start of SGLT2is treatment (n = 53), the levels of log‐transformed UACR significantly decreased from 2.55 ± 0.07 mg/g Cr before the start of SGLT2is treatment to 2.38 ± 0.10 mg/g Cr after 2 years of SGLT2is administration (Table 2; data are shown as the mean ± SE).
Change in annual eGFR slope before and after SGLT2 inhibitors treatment
For all the study patients (n = 85), the mean annual eGFR slope before and during 2 years of SGLT2is administration was −2.93 ± 0.59 (±SE) mL/min/1.73 m2/year, whereas the mean annual eGFR slope after 2 years of SGLT2is administration was −0.11 ± 0.20 mL/min/1.73 m2/year (Figure 1a). Thus, the annual eGFR decline was significantly slowed after additional treatment with SGLT2is, compared with the values before SGLT2is administration (P < 0.0001; Figure 1b).
Figure 1.
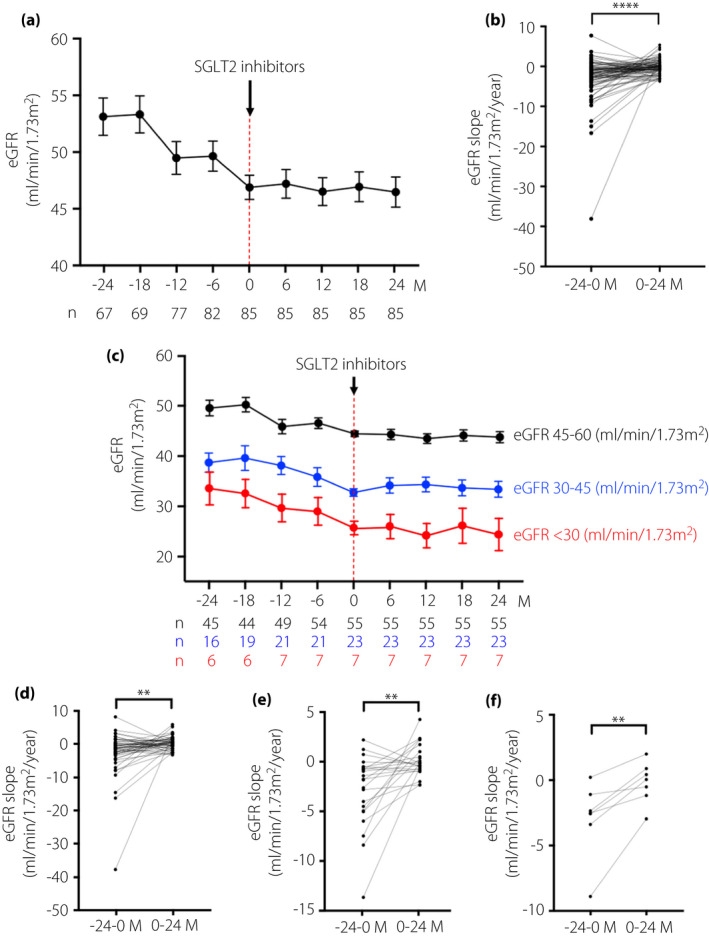
Changes in the mean estimated glomerular filtration rate (eGFR) slope before and after administration of sodium–glucose cotransporter 2 inhibitors (SGLT2is). The mean eGFR over the time course before and after administration of SGLT2is in (a) all study participants with <60 mL/min/1.73 m2, (c) patients with eGFR 45–60 mL/min/1.73 m2, patients with eGFR 30–45 mL/min/1.73 m2 and patients with eGFR <30 mL/min/1.73 m2, at the start of SGLT2is administration, respectively. The number of patients who had eGFR data at the observational periods is shown in the lower panel of the graph of mean eGFR. Differences of changes in the mean eGFR slope before and after SGLT2is administrations in each of the patient’s eGFR level groups: (b) eGFR <60 mL/min/1.73 m2, (d) 45–60 mL/min/1.73 m2, (e) 30–45 mL/min/1.73 m2 and (f) <30 mL/min/1.73 m2 at the start of SGLT2is administration. Data are shown as the mean ± standard error (SE). ****P < 0.0001, ***P < 0.001, **P < 0.01, *P < 0.05; −24 to 0 months (M) vs 0–24 M.
The mean of the eGFR slope before SGLT2is administration in patients whose eGFR was 45–60 (n = 55), 30–45 (n = 23) and <30 mL/min/1.73 m2 (n = 7) was −2.95 ± 0.85, −2.84 ± 0.75 and −3.01 ± 1.09, respectively (Figure 1c). However, the average of the eGFR slope after starting SGLT2is in each group was −0.17 ± 0.26, 0.08 ± 0.33 and −0.25 ± 0.60 mL/min/1.73 m2/year, respectively (Figure 1c). The decline in the annual eGFR was significantly slowed after SGLT2is treatment, compared with those before the start of the drug treatment, in all stages of eGFR (before vs after, P < 0.01, respectively; Figure 1d–f).
Additionally, the mean of the eGFR slope before SGLT2is administration in participants who had normo‐ (n = 28), micro‐ (n = 25) and macroalbuminuria (n = 29) was −2.69 ± 1.41, −1.37 ± 0.56 and −4.41 ± 0.88 mL/min/1.73 m2/year, respectively (Figure 2a). However, the annual mean eGFR slope after starting SGLT2is in each group was 0.42 ± 0.37, 0.29 ± 0.30 and −0.98 ± 0.31 mL/min/1.73 m2/year, respectively (Figure 2a). In the stage of normal albuminuria, the eGFR decline trended to slow after the administration of SGLT2is (before vs after, P = 0.055). However, in both stages of micro‐ and macroalbuminuria, the eGFR decline was significantly slowed after SGLT2is, compared with those of before starting of SGLT2is (before vs after, P < 0.05; Figure 2b–d). Furthermore, the annual mean slope of eGFR before SGLT2is administration in patients who showed eGFR of >3 (n = 29), 1–3 (n = 26) and <1 mL/min/1.73 m2 decline (n = 30), were −7.55 ± 1.28, −1.94 ± 0.12 and 0.69 ± 0.33 mL/min/1.73 m2/year, respectively (Figure 3a). However, the mean of the eGFR slope after treatment of SGLT2is in each group was 0.16 ± 0.41, −0.26 ± 0.36 and −0.24 ± 0.24 mL/min/1.73 m2/year, respectively (Figure 3a). Regarding the patient groups who showed annual eGFR decline of >3 and 1–3 mL/min/1.73 m2, the annual eGFR slope decline was significantly slowed after SGLT2is therapy, compared with the slopes before the administration of SGLT2 inhibitors (before vs after, P < 0.001) (Figure 3b,c). In the patients who showed annual eGFR decline of <1 mL/min/1.73 m2, a statistically significant difference between before and after administration of SGLT2is therapy was noted (after vs before, P < 0.05; Figure 3d). We analyzed the eGFR slope in the patients, which was divided into two groups by the treatment with RAAS inhibitor treatment or not during SGLT2 inhibitor administration. The mean of eGFR slope before treatment of SGLT2is in each group was −2.27 ± 0.55 (without RAAS inhibitors) and −3.21 ± 0.81 mL/min/1.73 m2/year (with RAAS inhibitors). However, the mean of the eGFR slope after treatment of SGLT2is in each group was −0.19 ± 0.38 and −0.07 ± 0.23 mL/min/1.73 m2/year, respectively (Figure S1).
Figure 2.
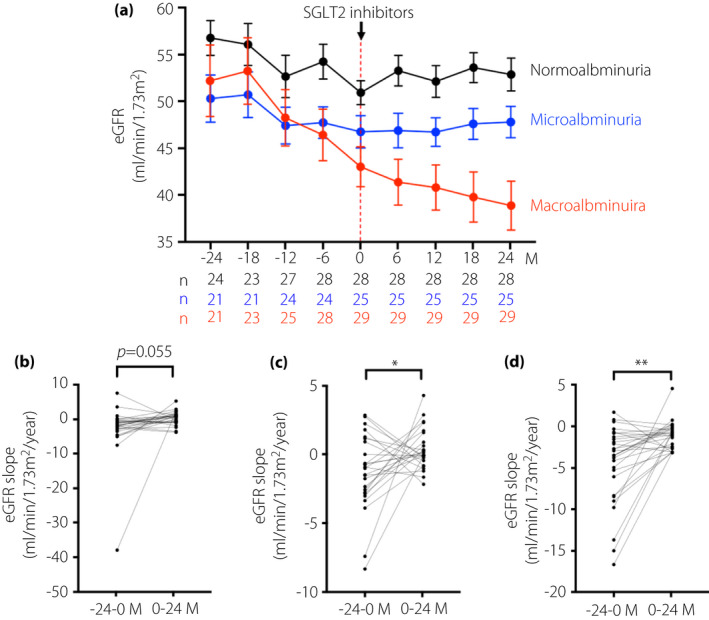
Changes in the mean estimated glomerular filtration rate (eGFR) slope before and after sodium–glucose cotransporter 2 inhibitors (SGLT2is) administration, in each stage of albuminuria before SGLT2i administration. (a) The mean eGFR (mL/min/1.73 m2) over a time course of before and after administration of SGLT2is in patients with normoalbuminuria, microalbuminuria and macroalbuminuria, before SGLT2is administrations, respectively. The number of patients who have data of urinary urinary albumin/creatinine ratio (UACR) at the observational periods is shown in the lower panel of the graph of mean eGFR. Differences in changes in mean eGFR slope before and after SGLT2is administrations in each level of albuminuria before SGLT2is administrations, (b) normoalbuminuria, (c) microalbuminuria and (d) macroalbuminuria. Data are shown as the mean ± standard error (SE). ****P < 0.0001, ***P < 0.001, **P < 0.01, *P < 0.05; −24 to 0 months (M) vs 0–24 M.
Figure 3.
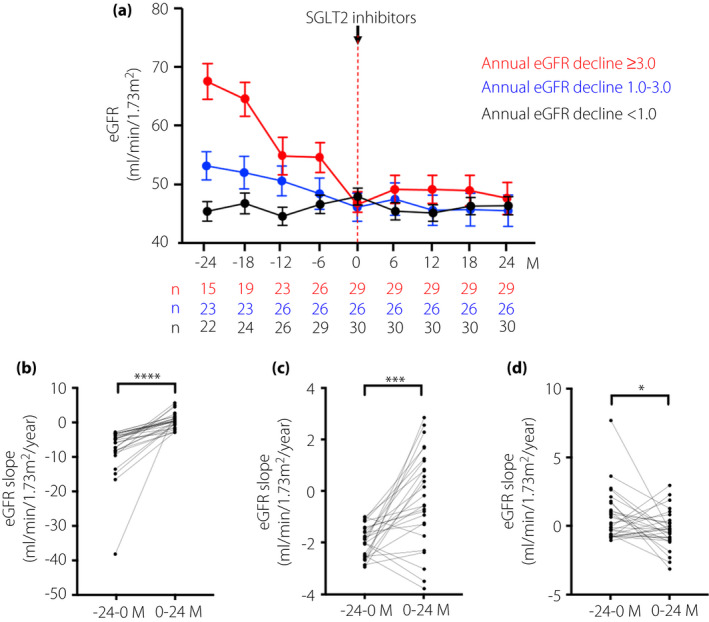
Changes in the mean estimated glomerular filtration rate (eGFR) slope before and after sodium–glucose cotransporter 2 inhibitors (SGLT2is) administration, in each stage of annual eGFR decline before SGLT2i administration. (a) The mean eGFR over time course before and after administration of SGLT2is in patient groups with the annual eGFR decline of >3 mL/min/1.73 m2, 1–3 mL/min/1.73 m2 and <1 mL/min/1.73 m2 before SGLT2is administration, respectively. The number of patients who had eGFR data during the observational periods is shown in the lower panel of the graph of mean eGFR. Differences in changes in the mean eGFR slope before and after SGLT2is administration at each level of the eGFR slope before SGLT2is administration for patient groups with eGFR decline of (b) >3 mL/min/1.73 m2, (c) 1–3 mL/min/1.73 m2 and (d) <1 mL/min/1.73 m2. Data are shown as the mean ± standard error (SE). ****P < 0.0001, ***P < 0.001, **P < 0.01, *P < 0.05; −24 to 0 months (M) vs 0–24 M.
Relationship between the change of eGFR slope and the changes in the clinical parameters before and after SGLT2is administration
We adjusted the eGFR slope with age, sex, ΔHbA1c and ΔBMI, and analyzed by using a linear mixed model shown in Table 3. The eGFR slope after the administration of SGLT2is was significantly reduced, compared with those before administration (Table 3), independent of the adjustment of these demographic and clinical parameters.
Table 3.
Estimated glomerular filtration rate slope before and after the administration of sodium–glucose cotransporter 2 inhibitors was adjusted by age, sex, change in glycated hemoglobin and change in body mass index
| Model | Before SGLT2is | After SGLT2is | P‐value |
|---|---|---|---|
| Model 1 | −2.65 ± 0.58 | −0.06 ± 0.20 | <0.001 |
| Model 2 | −2.82 ± 0.61 | −0.08 ± 0.21 | <0.001 |
| Model 3 | −2.42 ± 0.77 | −0.46 ± 0.24 | 0.017 |
Data presented as adjusted average ± standard error. Model 1 was adjusted by age and sex. Model 2 was adjusted by age, sex and change in glycated hemoglobin. Model 3 was adjusted by age, sex, change in glycated hemoglobin and change in body mass index. Even after estimated glomerular filtration rate slope was adjusted by all factors, estimated glomerular filtration slope was significantly slowed after the starting of sodium–glucose cotransporter 2 inhibitors (SGLT2is). Linear mixed model.
Adverse events after the administration of SGLT2is
Adverse events are shown in Table S1. The most common adverse event was urinary tract infection, which occurred in 9.4% of all patients. The second most common adverse event was genital infection (7.1%).
Discussion
In the present study, we showed that administration of SGLT2is slowed the annual eGFR decline significantly in type 2 diabetes mellitus patients with eGFR of <60 mL/min/1.73 m2, independent of demographic, different levels of albuminuria and eGFR, before and after SGLT2is administration. In addition, in a subset of patients with UACR levels of ≥30 mg/g Cr, the UACR after 2 years of SGLT2is therapy was decreased.
The eGFR slope has been used for the assessment of the prediction of prognosis for end‐stage renal disease (ESRD) and monitoring of therapy10, 11. Recent studies have assessed eGFR slope‐based approaches using multiple measurements of eGFR to determine the associations between the annual change in eGFR and the subsequent risk of the development of ESRD, cardiovascular disease and all‐cause mortality12, 13, 14. Thus, indicating that the SGLT2is slowing of eGFR decline indeed induces the suppression of progression of renal impairment toward ESRD and cardiovascular disease, as well as a reduction of the ultimate poor outcome – all‐cause mortality. Likewise, in previous RCTs using SGLT2is, such as empagliflozin, canagliflozin and dapagliflozin, the comparison of the eGFR slope between the placebo group and the SGLT2is group during the observational periods showed that in type 2 diabetes mellitus patients, the eGFR continued to decline initially, but was followed by slowing of the eGFR declination, thereby, improving the eGFR, which was maintained at higher levels by the end of the studies, compared with the placebo group7, 15, 16. Furthermore, Heerspink et al.17 showed that canagliflozin slowed the progression of renal function decline independently of glycemic controls.
In consideration of real‐world data, CVD‐REAL 3, a multinational observational cohort study, including Japan, measured the eGFR among new users of SGLT2is, exhibiting slowing of the decline of renal function, compared with that of other glucose‐lowering drugs9. However, the CVD‐REAL 3 study included patients with >90% of eGFR of ≥60 mL/min/1.73 m2, and thus, further investigation is required with a larger study population using patient inclusions with lower eGFR to confirm the role of SGLT2is in renoprotection.
Miyoshi et al.18 also previously reported from a retrospective cohort study that patients with type 2 diabetes mellitus who had an eGFR of <60 mL/min/1.73 m2 and a rapid decline in eGFR, defined as a >20% reduction over a period of 2 years, who received SGLT2is treatment during this time, showed slowing of renal function decline, compared with that of those who did not receive SGLT2is. However, the number of type 2 diabetes mellitus patients treated with SGLT2is was small (n = 17) in their study. Similarly, Sugiyama et al.19 showed that SGLT2is suppressed the decline of the renal function in type 2 diabetes mellitus patients (n = 42) with moderate‐to‐severe renal function impairment (CKD stage 3b–4), in a retrospective observation study before and after 1 year of SGLT2is treatment. Additionally, SGLT2is significantly decreased the levels of albuminuria/proteinuria after 1 year. These reports are consistent with our current study, which also found that SGLT2is suppressed the annual renal function decline and maintained eGFR for 2 years in type 2 diabetes mellitus patients (n = 85) with eGFR of <60 mL/min/1.73 m2.
Furthermore, the SGLT2is effect of slowing annual eGFR decline was exerted in all the patient groups at different stages of eGFR (60–45, 45–30 and <30 mL/min/1.73 m2), and at stages of micro‐ and macroalbuminuria before SGLT2is was started. Moreover, in the patient group that showed a large annual eGFR decline of ≥3 mL/min/1.73 m2, and thus, was recognized as the group with rapid GFR decline, the SGLT2is therapy exerted a high renoprotective effect leading to the improvement of the levels of HbA1c (reduction) and decreased BW/BMI over a period of 2 years, and the renoprotective effect was apparent even after adjustment of age, sex, the annual changes of HbA1c and BMI. Thus, adding SGLT2is to the treatment regimen of type 2 diabetes mellitus patients with renal impairment is likely to preserve renal function, independent of the patients' demographic and clinical parameters. In a subanalysis of the Canagliflozin Cardiovascular Assessment Study (CANVAS) program to analyze albuminuria levels, the effect of the SGLT2i, canagliflozin, on renal outcomes was almost consistent among patients with varying degrees of albuminuria, but the absolute benefit was among those with severely increased albuminuria20. Our current data showed that an annual eGFR decline after SGLT2is administration in the group of micro‐ and macroalbuminuria became significantly slower than that before SGLT2is administration, and in the group of normoalbuminuria, it tended to slow eGFR decline. In addition, there was not a significant correlation between the ΔUACR and ΔeGFR slope (data not shown). Overall, our current findings are in accordance with the proposed mechanisms of the renoprotective effects of SGLT2is, which include their action on the tubuloglomerular feedback system21, attenuation of hypoxia, and metabolic stress in proximal tubular cells mediated through inhibition of excess glucose and sodium reabsorption22, 23. In addition, the number of patients treated with GLP‐1 receptor agonist increased from three at the start of SGLT2is administration to 14 at the end of this study. Among the 14 patients, 12 patients received an administration of dulaglutide (0.75 mg/week) during the observational period, and further, nine patients received an administration of dulaglutide, for >1 year. In the Researching Cardiovascular Events With a Weekly Incretin in Diabetes (REWIND) study that evaluated the effect of dulaglutide (1.5 mg/week) on cardiovascular outcomes, the microvascular composite outcome including renal outcome was significantly suppressed in the dulaglutide group compared with those of the placebo group, in follow‐up periods of median of 5.4 years (interquartile range 5.1–5.9 years)24. In the present study, the dose of dulaglutide and the observation period was 0.75 mg/week and 2 years, which was lower and shorter than those of the REWIND study, respectively. Therefore, we consider that GLP‐1 agonist did not affect the slowing eGFR decline of SGLT2is in the present study.
There were several limitations encountered in our retrospectively designed and non‐controlled study, as follows: (i) the number of participants was small (n = 85), likely to cause variability leading to a bias of outcomes; (ii) some of the clinical data of the patients were missing due to data collection from real clinical practice, compelling us to lower the sample size further in some of the parameters measured; (iii) We used the eGFR calculated by using only serum Cr, likely to be affected by changes in skeletal muscle mass for the evaluation of renal function; unfortunately, we were unable to collect the body composition data, including skeletal muscle mass; and (iv) the UACR was evaluated by an only one‐point measurement, therefore, the results showing the reduction of UACR after SGLT2is administration can be affected by the regression to mean.
In conclusion, the present study has provided promising outcomes for SGLT2is as a treatment regimen for type 2 diabetes mellitus patients with impairment in renal function, in particular, those with rapid renal function decline, demonstrated by the slowing of the annual decline in eGFR, and thus, plausible renoprotective properties. Additionally, the renoprotective effect by SGLT2is is exerted, independent of changes to the clinical parameters measured, including glucose control and BW/BMI. Therefore, the clinical evidence presented here positively recommends the use of SGLT2is for patients with a high risk of progression toward ESRD. However, a large‐scale prospective RCT study is necessary to clarify whether SGLT2is would show the renoprotective effect in type 2 diabetes mellitus with renal impairment in a broader population. Furthermore, the understanding of drug characteristics, including side‐effects, is required for safer use of SGLT2 inhibitors25.
Disclosure
Boehringer Ingelheim, Mitsubishi Tanabe Pharma, Kyowa Kirin, Taisho Pharmaceutical Co. and Ono Pharmaceutical Co. contributed to establishing the Division of Anticipatory Molecular Food Science and Technology. The authors declare no conflict of interest.
Supporting information
Figure S1 | Changes in mean estimate glomerular filtration rate slope before and after sodium–glucose cotransporter 2 inhibitors administration, in each group treated with or without RAAS inhibitors at the start of sodium‐glucose cotransporter 2 inhibitors.
Table S1 | Adverse events after the administration sodium–glucose cotransporter 2 inhibitors.
Acknowledgments
We thank Yuka Kuroshima, clinical research coordinator, and all the staff at the Department of Endocrinology and Metabolism of Kanazawa Medical University Hospital for their great assistance in this study.
J Diabetes Investig. 2021; 12: 1577–1585
References
- 1.Ferrannini E, Solini A. SGLT2 inhibition in diabetes mellitus: rationale and clinical prospects. Nat Rev Endocrinol 2012; 8: 495–502. [DOI] [PubMed] [Google Scholar]
- 2.Zinman B, Wanner C, Lachin JM, et al. Empagliflozin, cardiovascular outcomes, and mortality in type 2 diabetes. N Engl J Med 2015; 373: 2117–2128. [DOI] [PubMed] [Google Scholar]
- 3.Wanner C, Inzucchi SE, Lachin JM, et al. Empagliflozin and progression of kidney disease in type 2 diabetes. N Engl J Med 2016; 375: 323–334. [DOI] [PubMed] [Google Scholar]
- 4.Neal B, Perkovic V, Mahaffey KW, et al. Canagliflozin and cardiovascular and renal events in type 2 diabetes. N Engl J Med 2017; 377: 644–657. [DOI] [PubMed] [Google Scholar]
- 5.Perkovic V, Jardine MJ, Neal B, et al. Canagliflozin and renal outcomes in type 2 diabetes and nephropathy. N Engl J Med 2019; 380: 2295–2306. [DOI] [PubMed] [Google Scholar]
- 6.Wiviott SD, Raz I, Bonaca MP, et al. Dapagliflozin and cardiovascular outcomes in type 2 diabetes. N Engl J Med 2019; 380: 347–357. [DOI] [PubMed] [Google Scholar]
- 7.Mosenzon O, Wiviott SD, Cahn A, et al. Effects of dapagliflozin on development and progression of kidney disease in patients with type 2 diabetes: an analysis from the DECLARE–TIMI 58 randomised trial. Lancet Diabetes Endocrinol 2019; 7: 606–617. [DOI] [PubMed] [Google Scholar]
- 8.Neuen BL, Young T, Heerspink HJ, et al. SGLT2 inhibitors for the prevention of kidney failure in patients with type 2 diabetes: a systematic review and meta‐analysis. Lancet Diabetes Endocrinol 2019; 7: 845–854. [DOI] [PubMed] [Google Scholar]
- 9.Heerspink HJ, Karasik A, Thuresson M, et al. Kidney outcomes associated with use of SGLT2 inhibitors in real‐world clinical practice (CVD‐REAL 3): a multinational observational cohort study. Lancet Diabetes Endocrinol 2020; 8: 27–35. [DOI] [PubMed] [Google Scholar]
- 10.Inker LA, Heerspink HJ, Tighiouart H, et al. GFR slope as a surrogate end point for kidney disease progression in clinical trials: a meta‐analysis of treatment effects of randomized controlled trials. J Am Soc Nephrol 2019; 30: 1735–1745. [DOI] [PMC free article] [PubMed] [Google Scholar]
- 11.Grams ME, Sang Y, Ballew SH, et al. Evaluating glomerular filtration rate slope as a surrogate end point for ESKD in clinical trials: an individual participant meta‐analysis of observational data. J Am Soc Nephrol 2019; 30: 1746–1755. [DOI] [PMC free article] [PubMed] [Google Scholar]
- 12.Coresh J, Turin TC, Matsushita K, et al. Decline in estimated glomerular filtration rate and subsequent risk of end‐stage renal disease and mortality. JAMA 2014; 311: 2518–2531. [DOI] [PMC free article] [PubMed] [Google Scholar]
- 13.Heerspink HJL, Tighiouart H, Sang Y, et al. GFR decline and subsequent risk of established kidney outcomes: a meta‐analysis of 37 randomized controlled trials. Am J Kidney Dis 2014; 64: 860–866. [DOI] [PubMed] [Google Scholar]
- 14.Oshima M, Jun M, Ohkuma T, et al. The relationship between eGFR slope and subsequent risk of vascular outcomes and all‐cause mortality in type 2 diabetes: the ADVANCE‐ON study. Diabetologia 2019; 62: 1988–1997. [DOI] [PMC free article] [PubMed] [Google Scholar]
- 15.Wanner C, Heerspink HJ, Zinman B, et al. Empagliflozin and kidney function decline in patients with type 2 diabetes: a slope analysis from the EMPA‐REG OUTCOME trial. J Am Soc Nephrol 2018; 29: 2755–2769. [DOI] [PMC free article] [PubMed] [Google Scholar]
- 16.Perkovic V, de Zeeuw D, Mahaffey KW, et al. Canagliflozin and renal outcomes in type 2 diabetes: results from the CANVAS Program randomised clinical trials. Lancet Diabetes Endocrinol 2018; 6: 691–704. [DOI] [PubMed] [Google Scholar]
- 17.Heerspink HJ, Desai M, Jardine M, et al. Canagliflozin slows progression of renal function decline independently of glycemic effects. J Am Soc Nephrol 2017; 28: 368–375. [DOI] [PMC free article] [PubMed] [Google Scholar]
- 18.Miyoshi H, Kameda H, Yamashita K, et al. Protective effect of sodium‐glucose cotransporter 2 inhibitors in patients with rapid renal function decline, stage G3 or G4 chronic kidney disease and type 2 diabetes. J Diabetes Investig 2019; 10: 1510–1517. [DOI] [PMC free article] [PubMed] [Google Scholar]
- 19.Sugiyama S, Jinnouchi H, Yoshida A, et al. Renoprotective effects of additional SGLT2 inhibitor therapy in patients with type 2 diabetes mellitus and chronic kidney disease stages 3b–4: A real world report from a Japanese specialized diabetes care center. J Clin Med Res 2019; 11: 267–274. [DOI] [PMC free article] [PubMed] [Google Scholar]
- 20.Neuen BL, Ohkuma T, Neal B, et al. Effect of canagliflozin on renal and cardiovascular outcomes across different levels of albuminuria: data from the CANVAS Program. J Am Soc Nephrol 2019; 30: 2229–2242. [DOI] [PMC free article] [PubMed] [Google Scholar]
- 21.Cherney DZ, Perkins BA, Soleymanlou N, et al. Renal hemodynamic effect of sodium‐glucose cotransporter 2 inhibition in patients with type 1 diabetes mellitus. Circulation 2014; 129: 587–597. [DOI] [PubMed] [Google Scholar]
- 22.Kamezaki M, Kusaba T, Komaki K, et al. Comprehensive renoprotective effects of ipragliflozin on early diabetic nephropathy in mice. Sci Rep 2018; 8: 4029. [DOI] [PMC free article] [PubMed] [Google Scholar]
- 23.Takagi S, Li J, Takagaki Y, et al. Ipragliflozin improves mitochondrial abnormalities in renal tubules induced by a high‐fat diet. J Diabetes Investig 2018; 9: 1025–1032. [DOI] [PMC free article] [PubMed] [Google Scholar]
- 24.Gerstein HC, Colhoun HM, Dagenais GR, et al. Dulaglutide and cardiovascular outcomes in type 2 diabetes (REWIND): a double‐blind, randomised placebo‐controlled trial. Lancet 2019; 394: 121–130. [DOI] [PubMed] [Google Scholar]
- 25.Committee on the Proper Use of SGLT2 Inhibitors . Recommendations on the proper use of SGLT2 inhibitors. J Diabetes Investig 2020; 11: 257–261. [DOI] [PMC free article] [PubMed] [Google Scholar]
Associated Data
This section collects any data citations, data availability statements, or supplementary materials included in this article.
Supplementary Materials
Figure S1 | Changes in mean estimate glomerular filtration rate slope before and after sodium–glucose cotransporter 2 inhibitors administration, in each group treated with or without RAAS inhibitors at the start of sodium‐glucose cotransporter 2 inhibitors.
Table S1 | Adverse events after the administration sodium–glucose cotransporter 2 inhibitors.