Abstract
Cell-autonomous circadian clocks exist in nearly every organ and function to maintain homeostasis through a complex series of transcriptional-translational feedback loops. The response of these peripheral clocks to external perturbations, such as chronic jetlag and shift work, has been extensively investigated. However, an evaluation of the effects of chronic jetlag on the mouse pancreatic transcriptome is still lacking. Herein, we report an evaluation of the diurnal variations encountered in the pancreatic transcriptome following exposure to an established chronic jetlag protocol. We found approximately 5.4% of the pancreatic transcriptome was rhythmic. Following chronic jetlag, we found the number of rhythmic transcripts decreased to approximately 3.6% of the transcriptome. Analysis of the core clock genes, which orchestrate circadian physiology, revealed that nearly all exhibited a shift in the timing of peak gene expression—known as a phase shift. Similarly, over 95% of the rhythmically expressed genes in the pancreatic transcriptome exhibited a phase shift, many of which were found to be important for metabolism. Evaluation of the genes involved in pancreatic exocrine secretion and insulin signaling revealed many pancreas-specific genes were also rhythmically expressed and several displayed a concomitant phase shift with chronic jetlag. Phase differences were found 9 days after normalization, indicating a persistent failure to reentrain to the new light-dark cycle. This study is the first to evaluate the endogenous pancreatic clock and rhythmic gene expression in whole pancreas over 48 h, and how the external perturbation of chronic jetlag affects the rhythmic expression of genes in the pancreatic transcriptome.
Keywords: circadian, jetlag, pancreas, phase, transcriptomics
INTRODUCTION
Circadian physiology controls several biologic processes necessary for promoting homeostasis (1). Extrinsic and intrinsic cues, including light, food, and hormones, are integrated via the central circadian clock within the suprachiasmatic nucleus (SCN) of the hypothalamus, which is the master regulator of circadian physiology. The central circadian clock then regulates the circadian clock in peripheral tissues (i.e., peripheral clocks). The central and peripheral circadian clock pathways operate via a series of transcriptional-translational feedback loops (TTFLs) comprised of a core set of circadian genes known as core clock genes (CCGs) (2, 3). These TTFLs promote fluctuations in the CCGs over a 24-h period. Notably, the mouse circadian atlas study revealed that up to 50% of the protein-coding genes in the genome in various organs are under circadian control (known as clock-controlled genes) (1, 4, 5).
For several decades, the pancreas has been recognized as an organ under circadian control, and recently, the peripheral clock within the pancreas has been shown to control a myriad of metabolic functions (6–11). Disruption of the circadian rhythm within the pancreas, via pharmacologic or genetic perturbation, has been correlated with the development of endocrine disorders, such as diabetes mellitus and the metabolic syndrome, and also exocrine pathology such as carcinogenesis (6, 12, 13). In humans, disruption of circadian rhythms is more commonly associated with shift work or chronic jetlag (CJ), as opposed to pharmacologic or genetic changes. CJ has been evaluated in prior mouse models and has been shown to demonstrate phase advancement or delay depending on the directionality of light modification (14). Mice under CJ conditions suffer increased carcinogenesis, immune dysregulation, and even earlier death (15–17). In a recent study of CJ in the liver, the development of nonalcoholic fatty liver disease (NAFLD) was heightened compared to control conditions, which was notable given the progression from NAFLD to steatohepatitis and liver cancer (15). Surprisingly, expression of Arntl (and other CCGs) was suppressed and arrhythmic in the CJ group. Suppression of Arntl has also been associated with pathologic disease in the pancreas, such as pancreatic cancer (12, 13). However, whether the CCGs and other rhythmically expressed genes in the pancreas are significantly altered due to CJ remains uncertain. This is because insight into the transcriptomic changes has been hindered by the difficulty in obtaining RNA from whole pancreas, which readily undergoes autolysis following death due to high levels of ribonucleases (18, 19). As such, the data have been limited to pancreatic islet cells or have been performed in a limited capacity on very few genes (7, 20). Thus, the understanding of how the CCGs and other rhythmically expressed genes within the pancreas change due to perturbation by CJ remains unknown and is important to evaluate given the high prevalence of irregular sleep patterns and shift work in humans.
After developing a protocol to extract high-quality RNA from whole pancreatic tissue, we sought to evaluate the expression of CCGs and diurnally expressed genes in the pancreas and understand the effects of CJ on pancreatic gene expression. To accomplish this, we subjected wild-type C57BL/6J mice to a CJ protocol and measured the diurnal variations in pancreatic gene expression over 48 h. We hypothesized that CJ conditions would result in dysregulation in the diurnal expression of CCGs. We secondarily hypothesized that the effects of CJ on pancreatic gene expression would normalize within 7 days. To test these hypotheses, we performed the first analysis of rhythmic gene expression in whole pancreas over 48 h. We then evaluated the CJ-induced changes and assessment of reentrainment (or normalization of gene expression).
METHODS
Animal Care
All animal studies were conducted according to an approved protocol (M005959) by the University of Wisconsin School of Medicine and Public Health (UW SMPH), Institutional Animal Care and Use Committee (IACUC). Male and female wild-type C57BL/6J (WT) mice were housed in an Assessment and Accreditation of Laboratory Animal Care (AALAC) accredited selective pathogen-free facility (UW Medical Sciences Center) on corncob bedding with chow diet (mouse diet 9 F 5020; PMI Nutrition International) and water ad libitum. Mice were housed in standard conditions under a 12-h:12-h light-dark (LD) cycle.
Chronic Jetlag Protocol
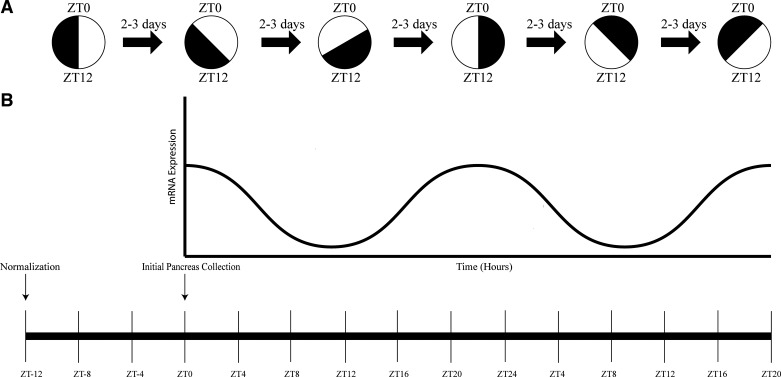
Four- to six-week-old sex-matched and age-matched mice (n = 144) were randomized into either ongoing standard lighting conditions (NC) or a chronic jetlag protocol (CJ), whereby mice underwent a 4-h phase advancement of the 12-h:12-h LD cycle every 2–3 days (Fig. 1A). After 4 wk, all mice were shifted back to standard lighting conditions (i.e., normalization) 12 h before the first time point of euthanasia. Twelve mice (6 males/6 females) were then euthanized every 4 h for 48 h starting at zeitgeber time 0 (ZT 0; 06:00 = first time point of euthanasia) (Fig. 1B). The zeitgeber (translation = “time giver”) time traditionally starts at “lights on” in a LD cycle. The published guidelines on genomic analysis of rhythmic data suggest that 48 h (2 periods) be the minimum duration of data collection for organisms with 24-h periodicity (21). In simulation data sets, this practice enhances the ability to detect patterns and decrease false-negative results.
Figure 1.
Chronic jetlag protocol and pancreatic RNA isolation schema. Chronic jetlag (CJ) protocol (A), whereby the light-dark (LD) cycle is characterized by 12 h of light followed by 12 h of dark that is shifted forward 4 h every 2−3 days. Following 4 wk of CJ, wild-type C57BL/6J mice were euthanized every 4 h (B) for 48 h—representing two complete periods.
RNA Isolation, Sequencing, and Processing
Animals were euthanized via cervical dislocation, and the pancreas was rapidly dissected to minimize RNA degradation from potent ribonucleases [<60 s until placement in RNAlater (Invitrogen, Carlsbad, CA)]. Due to significant degradation of pancreatic tissue even with frozen storage (−80°C), RNA isolation proceeded immediately at each time point. The same individual performed every dissection and RNA isolation for all time points to minimize experimental variability. Isolation was carried out with a modified RNeasy protocol and quality tested for an RNA integrity number (RIN) >7.5 on the Agilent 2100 bioanalyzer (Agilent Technologies, Santa Clara, CA). A total of 300 ng of mRNA was enriched with poly-A selection and sequencing on the Illumina HiSeq2500 platform (San Diego, CA) by the University of Wisconsin Biotechnology Sequencing Core. FASTq files were processed with skewer, and genes were filtered to remove those with low expression (22). Samples were normalized with quantile normalization. All RNA-seq data are publicly available through gene expression omnibus (GEO) (Accession numbers: GSE165198 and GSE165199).
Transcriptomic Analyses
The MetaCycle package was used to assess the rhythmicity of gene expression (23). Males and females were assessed individually with the meta2d function, whereas the combined male and female cohort was assessed with the meta3d function (with JTK cycle selected as primary analysis). A Benjamini–Hochberg corrected false discovery rate (FDR) of q < 0.1 was considered rhythmic. Genes found to be rhythmic in both NC and CJ conditions were assessed for differential rhythmicity with the detection of differential rhythmicity (DODR) and CircaCompare packages in R (24, 25). Differential rhythmicity analysis included assessment of the amplitude (defined as the difference between peak and trough of expression), phase (defined as the time of peak expression), and mesor (also known as the midline estimating statistic of rhythm, which represents the rhythm adjusted mean of the diurnal curve). Within CircaCompare, all P < 0.05 were considered statistically significant. Phase differences were analyzed using phase set enrichment analysis (PSEA) with a minimum of five items per set for gene ontology biologic process terms (GO BP; version 7.4) (26). General pathway enrichment analysis with g:profiler was performed as previously described (27). Pathways with an adjusted P < 0.05 were considered significant. Gene lists from Kyoto Encyclopedia of Genes and Genomes (KEGG) database pathways of normal pancreatic function, including pancreatic exocrine secretion (KEGG ID: mmu04972) and insulin signaling (KEGG ID: mmu04910), were queried in R with the KEGGREST package (28).
Pancreatic Clock Reentrainment
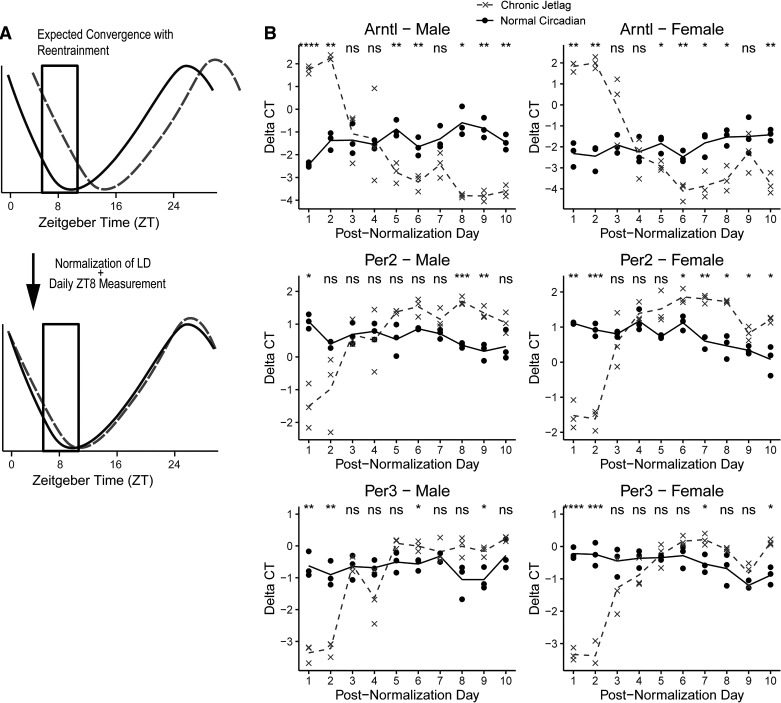
To assess for normalization of expression (known as reentrainment) of the pancreatic clock, 96 age-matched, cage-matched, sex-matched WT mice were subjected to either NC (n = 48) or CJ conditions (n = 48) with the CJ protocol (Fig. 1A) starting at 4–6 wk of age. Mice were jetlagged for 4 wk (until age 8–10 wk), and then, all mice were subjected to NC conditions 12 h before ZT0. The initial CJ experiment that was performed allowed for the evaluation of reentrainment by 48 h (i.e., ZT0 to ZT24 over 2 periods) as assessed by gene expression analysis. Thus, to determine the time to reentrainment, mice (6 males/6 females) were euthanized daily, and gene expression was evaluated starting from 48 h for 8 additional days (total of 10 days). The time of greatest difference in core clock gene expression between NC and CJ mice was identified and selected as the daily time point (Fig. 9A). This equated to ZT8 over the first two periods. Thus, expression at ZT8 was assessed daily for an additional 8 days (postnormalization days 3–10), to determine the time until gene expression convergence (i.e., reentrainment). Pancreas and mRNA processing were carried out as previously described. Quantitative real-time PCR (qRT-PCR) was then performed in triplicate for the CCGs Arntl (Bmal1) (ID: Mm00500223_m1, Life Technologies, Carlsbad, CA), Per2 (ID: Mm00478113_m1; Life Technologies, Carlsbad, CA), and Per3 (ID: Mm00478120_m1; Life Technologies, Carlsbad, CA)—representing opposing arms of the CCG TTFL. Hprt (ID: Mm03024075_m1, Life Technologies, Carlsbad, CA) was selected as the housekeeping gene. Statistical comparisons at each day were made between NC and CJ conditions with independent Student’s t tests. Data for each condition were presented as a mean (ΔCT) with individual biologic replicates plotted. Subsequent bulk RNA-sequencing (RNAseq) was performed (see RNA Isolation, Sequencing, and Processing) for further evaluation of reentrainment at select time points (n = 3 male/female per condition per time point). Contrasts were drawn with the edgeR package in R and presented as heatmaps (29). Differential expression was taken when the FDR q < 0.05. To determine subsequent differences in the transcriptomic signatures, library-normalized expected count data were regularized log (rlog) transformed and Pearson correlation coefficients were computed among all samples (30). A hierarchical clustering (complete linkage) was performed on the Euclidean distances among each sample. A follow-up evaluation of the diurnal expression of Arntl and Per3 was performed on day 9 postnormalization. WT mice (n = 72) were subjected to either NC or CJ conditions (4-wk duration), and normalization occurred as described in Chronic Jetlag Protocol. On day 9 postnormalization, mice were euthanized at 4-h intervals (n = 12; 3 males/females per condition) for a total of 24 h and pancreatic mRNA was extracted. Following mRNA isolation, qRT-PCR was performed for Arntl and Per3. Statistical comparisons for each hour were made between NC and CJ conditions with independent Student’s t tests. Differential rhythmicity testing was assessed with CircaCompare (see Transcriptomic Analyses).
Figure 9.
Reentrainment of mouse pancreas does not reliably occur by day 10 and instead was found to cross over on day 3−4 postnormalization. A single time point (ZT8) was chosen to evaluate daily for 10 days following normalization of the LD cycle to determine if reentrainment occurred (A). The graphs (B) demonstrate the male and female mouse pancreatic relative mRNA expression of Arntl, Per2, and Per3, measured by quantitative real-time PCR, in both the normal circadian (solid black) and chronic jetlag (dashed gray) conditions. Lines represent the mean ΔCT with associated individual animals shown as points (n = 3 M/F at each time point). The ΔCT values are relative to the Hprt housekeeping gene. Individual points indicate the average of technical triplicates. Pairwise comparisons were made with independent Student’s t test. Reentrainment was considered to occur if both conditions were consistently nonsignificant by day 10 of normalization. Graphs demonstrate the core clock genes Arntl, Per2, and Per3 do not reliably reentrain by day 10 postnormalization. ns, Not significant, *P < 0.05, **P < 0.01, ***P < 0.001, ****P < 0.0001. LD, light-dark.
Behavioral Analysis
To analyze behavior, mice (n = 8; 4 males/females) were placed into individual cages and subjected to either NC or CJ conditions for 4 wk starting at 4–6 wk of age. Cages were equipped with an activity wheel (Actimetrics, Wilmette, IL) and used to continuously record wheel revolutions at 1-min intervals. Behavioral actogram data, including rhythmicity, were analyzed using the ClockLab software (Actimetrics, Wilmette, IL) (31). Double plotted actograms of the activity data are presented as the normalized median aggregate of 7/8 mice in each group (1 mouse in each group failed to finish the experiment). After 4 wk, all mice were placed under NC conditions. The number of days until behavioral reentrainment was quantified for 10 days. Reentrainment was defined as wheel-running activity that occurred at the onset of lights-off (mouse active period). All data were manually checked for masking effects at light onset and modified accordingly (32).
RESULTS
Rhythmicity of Pancreatic Gene Expression
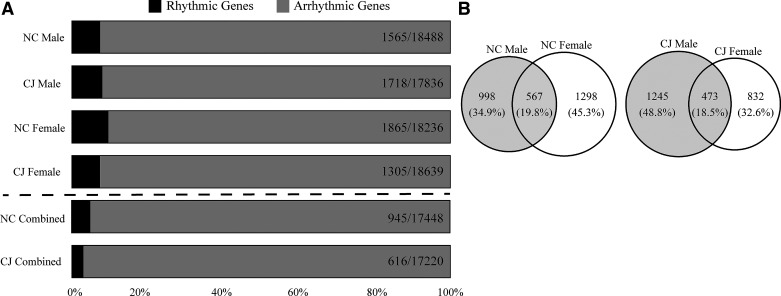
Since the diurnal expression of pancreatic genes had yet to be determined, we first sought to understand the number of rhythmically expressed genes in the mouse pancreas (Fig. 2A). Our analysis revealed that 8.46% of the male (n = 3 at each time point; q < 0.1) pancreatic transcriptome and 10.23% of the female (n = 3 at each time point) pancreatic transcriptome were found to be rhythmic. When male and female mouse transcriptomic data were combined (n = 6 at each time point), the total number of rhythmic genes decreased to 5.42% of the transcriptome. This suggests that although there were relatively similar numbers of rhythmic transcripts between sexes, the specific rhythmic transcripts in each sex are different (Fig. 2B), resulting in a relative washout of detectable rhythmicity when considered together. After establishing a baseline of rhythmic genes in the mouse pancreas, we next sought to understand the effect of chronic jetlag (CJ) on rhythmicity. We observed that the number of rhythmic genes in male mice increased 1.14-fold to 9.63% (compared to 8.46%), whereas the number of female rhythmic genes decreased 1.47-fold to 7% (compared to 10.23%). Likewise, the number of rhythmic genes of combined males and females decreased 1.52-fold to 3.58% (compared to 5.42%). Indeed, prior chronobiology work has demonstrated sex-specific differences between male and female mice (33, 34). This initial observation of sex-specific gene expression differences prompted subsequent analyses for each sex to be considered separately.
Figure 2.
Chronic jetlag promotes sex-specific differences in the rhythmic expression of pancreatic genes. Graph demonstrating the total number of rhythmic genes in the pancreas as a percent of the total pancreatic transcriptome for both the normal circadian (NC) and chronic jetlag (CJ) conditions (A). Rates were additionally stratified by sex. Rhythmicity was defined as having a meta2d or meta3d detected false discovery rate (FDR) q value of < 0.1. The proportion of genes common and distinct between males and females are shown as a Venn diagram for the NC and CJ conditions (B).
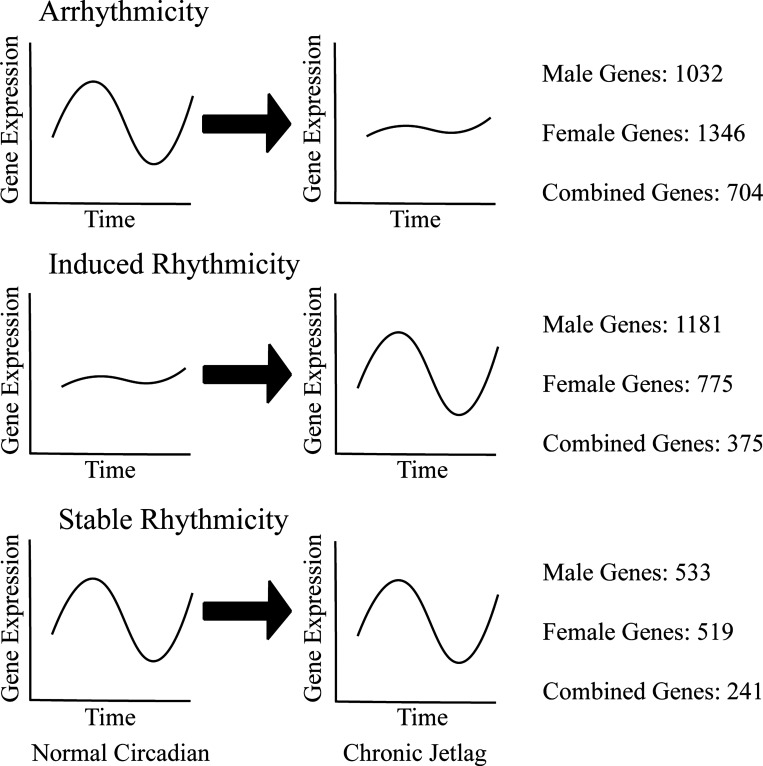
We then sought to determine which pathways were overrepresented by the rhythmically expressed transcripts. Pathway enrichment analysis was conducted with g:profiler (27). In the male, female, and male/female combined normal circadian (NC) and CJ conditions, the transcriptomic data demonstrated that the rhythmic genes predominantly exhibited overrepresentation of metabolic pathways [e.g., “process metabolic catabolic” and “small molecule metabolic process”; as indicated by gene ontology biologic process (GO BP) terms]. The top 15 GO BP terms for each condition can be found in Supplemental Table S1 (see https://doi.org/10.6084/m9.figshare.14331143.v1). Following the initial pathway enrichment analysis, we also investigated which pathways were overrepresented by genes exhibiting loss of rhythmicity following CJ (arrhythmicity), those exhibiting induction of rhythmicity following CJ (induced rhythmicity), and those pathways stably rhythmic despite CJ (stable rhythmicity) (Fig. 3 and Supplemental Table S2; see https://doi.org/10.6084/m9.figshare.14036720.v1). We found that there was an enrichment of metabolism-related pathways in all three groups.
Figure 3.
Chronic jetlag leads to alterations in the rhythmic expression of pancreatic genes. Graphical representation of the genes that underwent loss of rhythmicity with chronic jetlag (CJ) (arrhythmicity), a gain of rhythmicity with CJ (induced rhythmicity), and rhythmicity despite CJ (stable rhythmicity). The number of genes in the male, female, and combined cohorts shown beside each graph. Rhythmicity was defined as having a meta2d or meta3d detected false discovery rate (FDR) q value of < 0.1.
Pancreatic Core Clock Genes Display Phase Shifts following Chronic Jetlag
Since pathway enrichment analysis revealed that there was an overrepresentation of metabolism-related pathways for both NC and CJ conditions, we turned our attention toward understanding how CJ affected individual genes that control the circadian clock. Thus, we examined 12 of the CCGs, which are orchestrators of the TTFLs and function to regulate circadian physiology (1). This would allow for the determination of possible underlying mechanistic drivers of changes in pancreatic metabolism due to CJ. The plotted normalized mRNA expression counts across 48 h are shown for males (Fig. 4) and females (Fig. 5). Qualitatively, the graph appearance revealed a shift in the phase of expression. Therefore, to determine if differences between NC and CJ CCGs existed, we leveraged the detection of differential rhythmicity (DODR) and CircaCompare packages, which detect differences in rhythmicity (e.g., mesor, amplitude, and phase) between conditions if both are rhythmic (stably rhythmic) (24, 25). In males, eight CCGs were found to be stably rhythmic, including Arntl, Clock, Per2, Cry1, Cry2, Nr1d1, Nr1d2, and Rorc, and thus available for differential rhythmicity analysis. Similarly, 10 CCGs in females were found to be stably rhythmic, including Arntl, Clock, Per1, Per2, Cry1, Cry2, Nr1d1, Nr1d2, Rorc, and Bhlhe40 (also known as Dec1). Examining the CCGs for individual differences in the normalized count data, Cry2 (328.08 vs. 286.08) and Nr1d2 (624.21 vs. 503.03) in males and Clock (569.77 vs. 654.64), Per1 (771.56 vs. 437.39) and Per2 (569.77 vs. 463.20) in females were the only genes which exhibited statistically significant differences in mesor between NC and CJ conditions (Table 1). Likewise, only the male Cry2 (157.45 vs. 99.70) and Nr1d2 (667.84 vs. 487.11) and no female CCGs exhibited differences in the amplitude (peak expression level). Conversely, statistically significant phase differences (as represented by the time at peak gene expression in a 24-h period) were seen in all the male CCGs and all the female CCGs (Table 1). The average phase shift of CCGs was 4.77 ± 0.44 (± standard deviation) hours in males and 4.01 ± 0.33 h in females. These data suggest that the rhythmicity of the CCGs in the pancreas is maintained with the CJ protocol and does not demonstrate suppression or arrhythmicity that has been reported in prior studies (6, 35). However, there appear to be significant differences in the phase of the CCGs relative to normal LD cycles.
Figure 4.
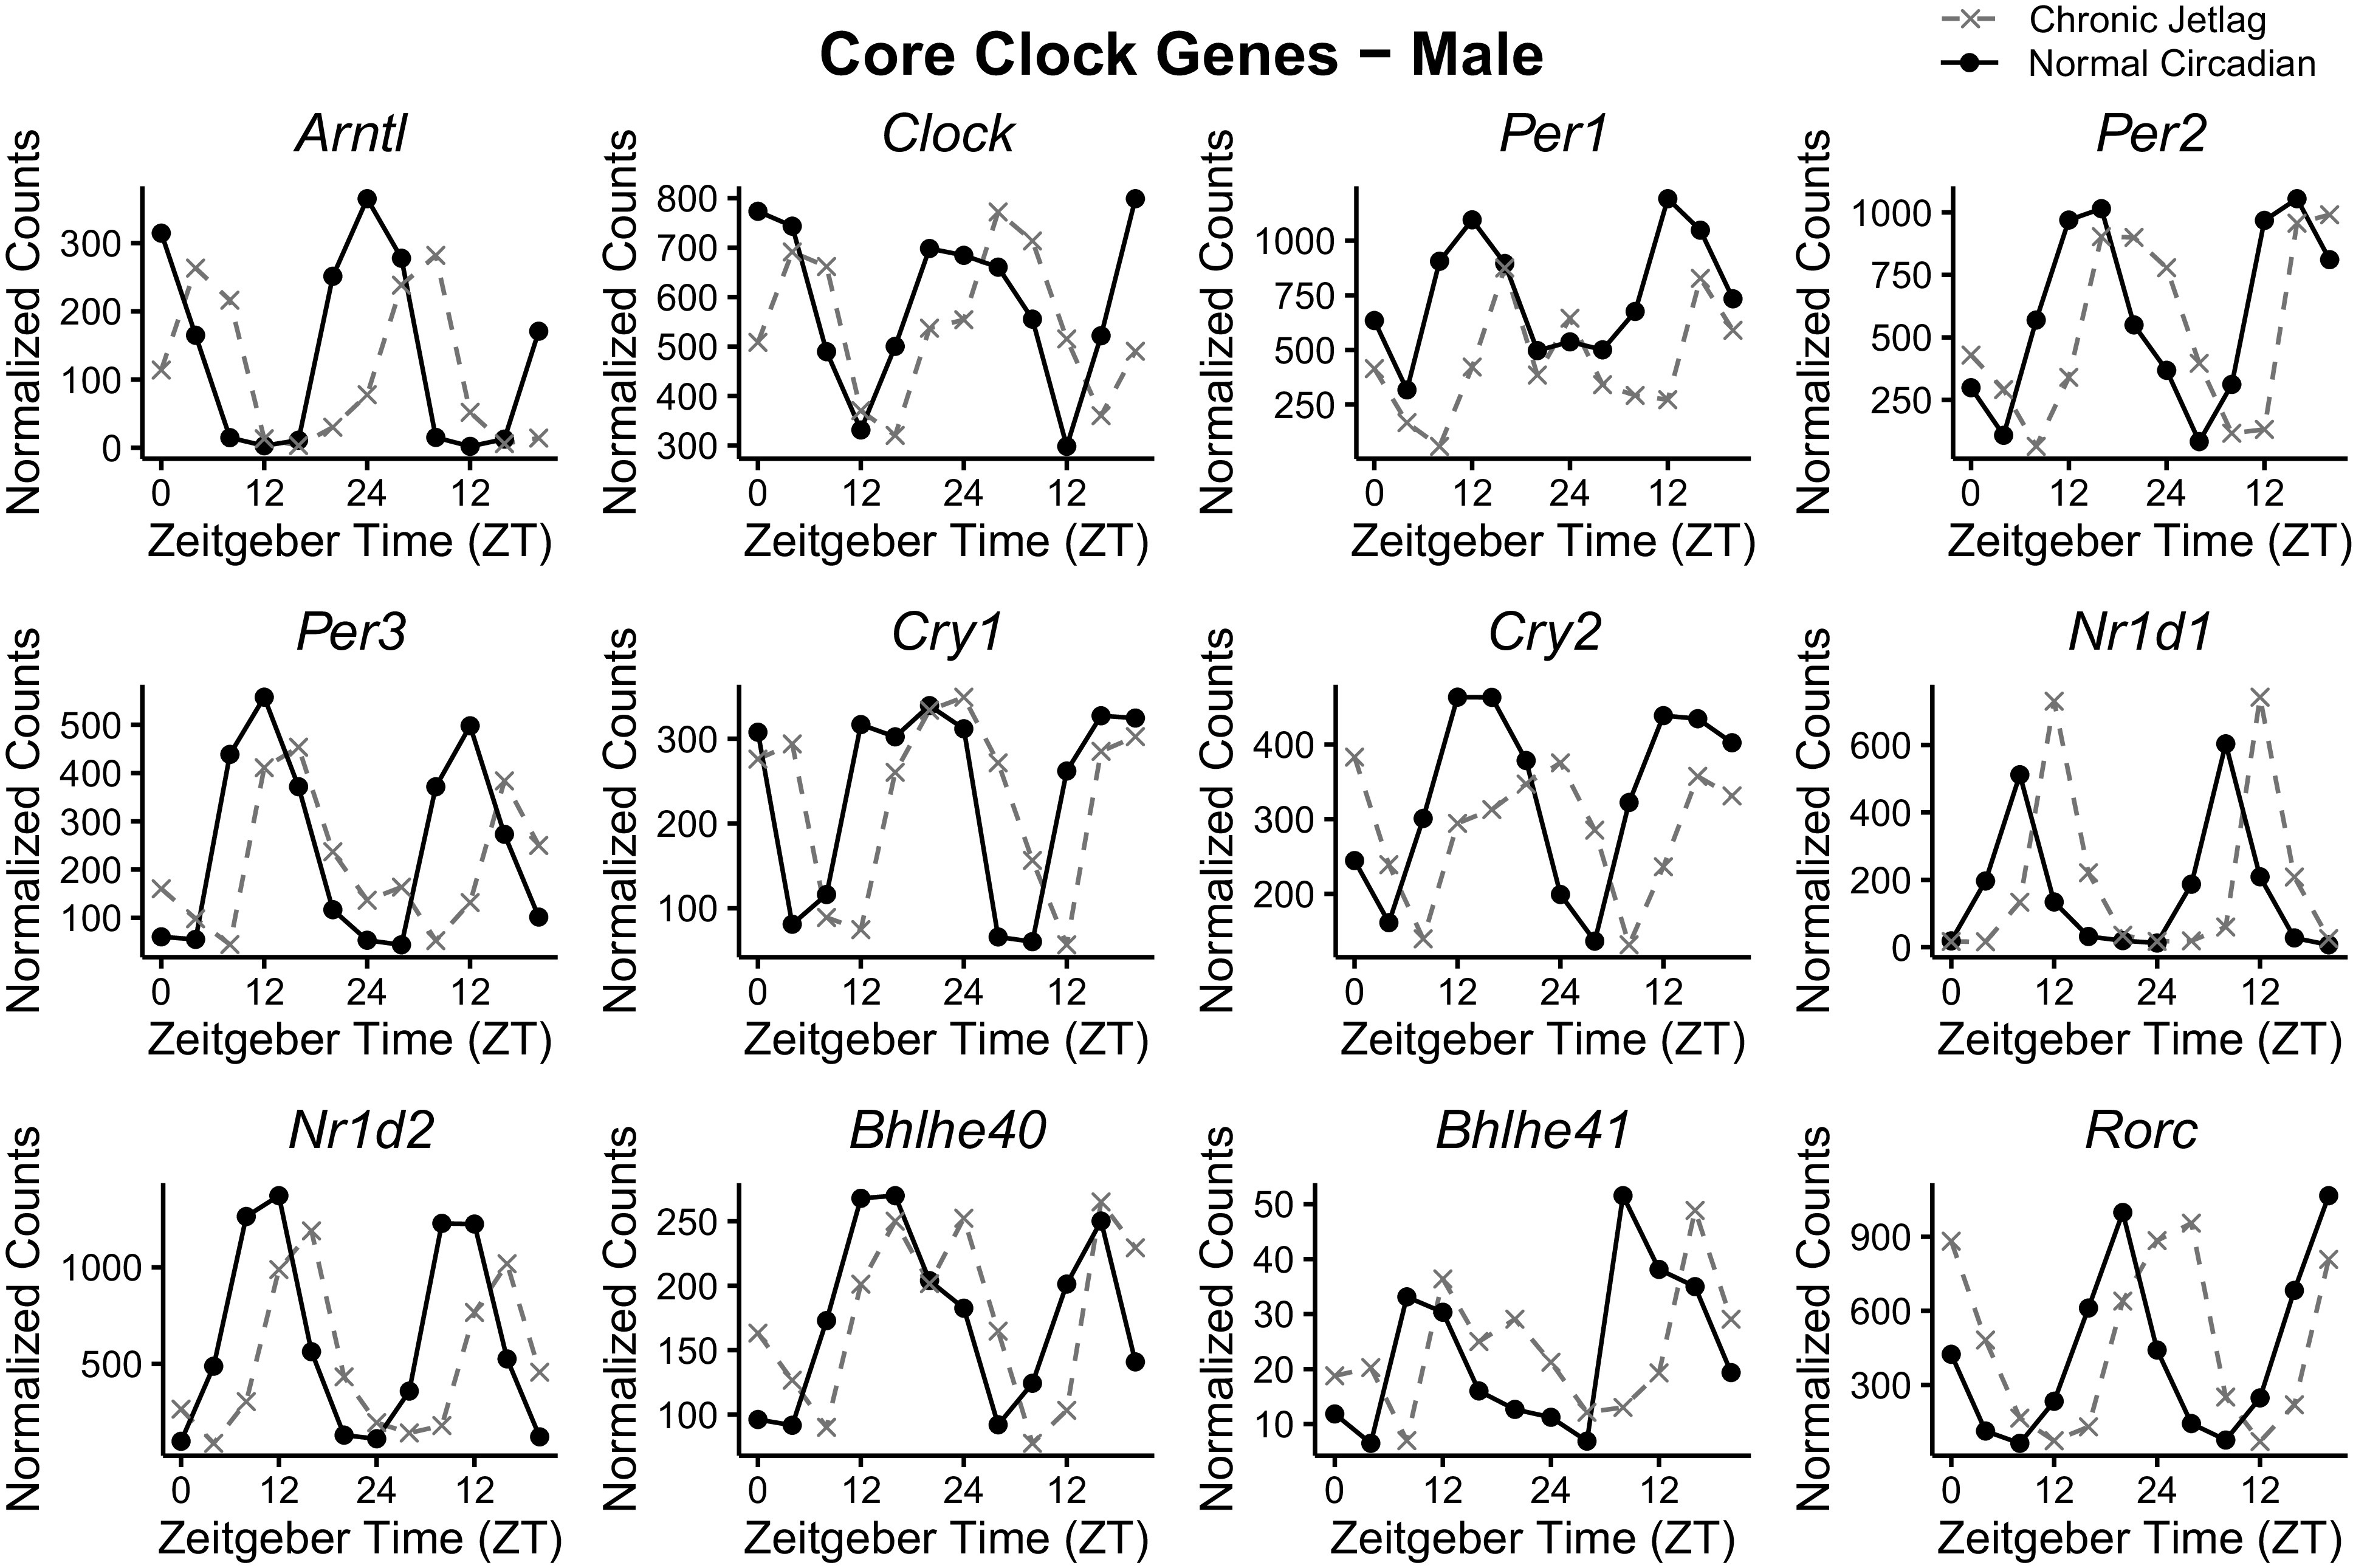
Male core clock gene expression over 48 h is phase shifted following chronic jetlag. Plotted normalized expression of the pancreatic core clock genes in males for normal circadian (black) and chronic jetlag (gray) conditions. Each point represents the pooled average of three mice (n = 3). Mice were euthanized at 4-h intervals over a 48-h period starting at zeitgeber time (ZT) 0 through ZT24.
Figure 5.
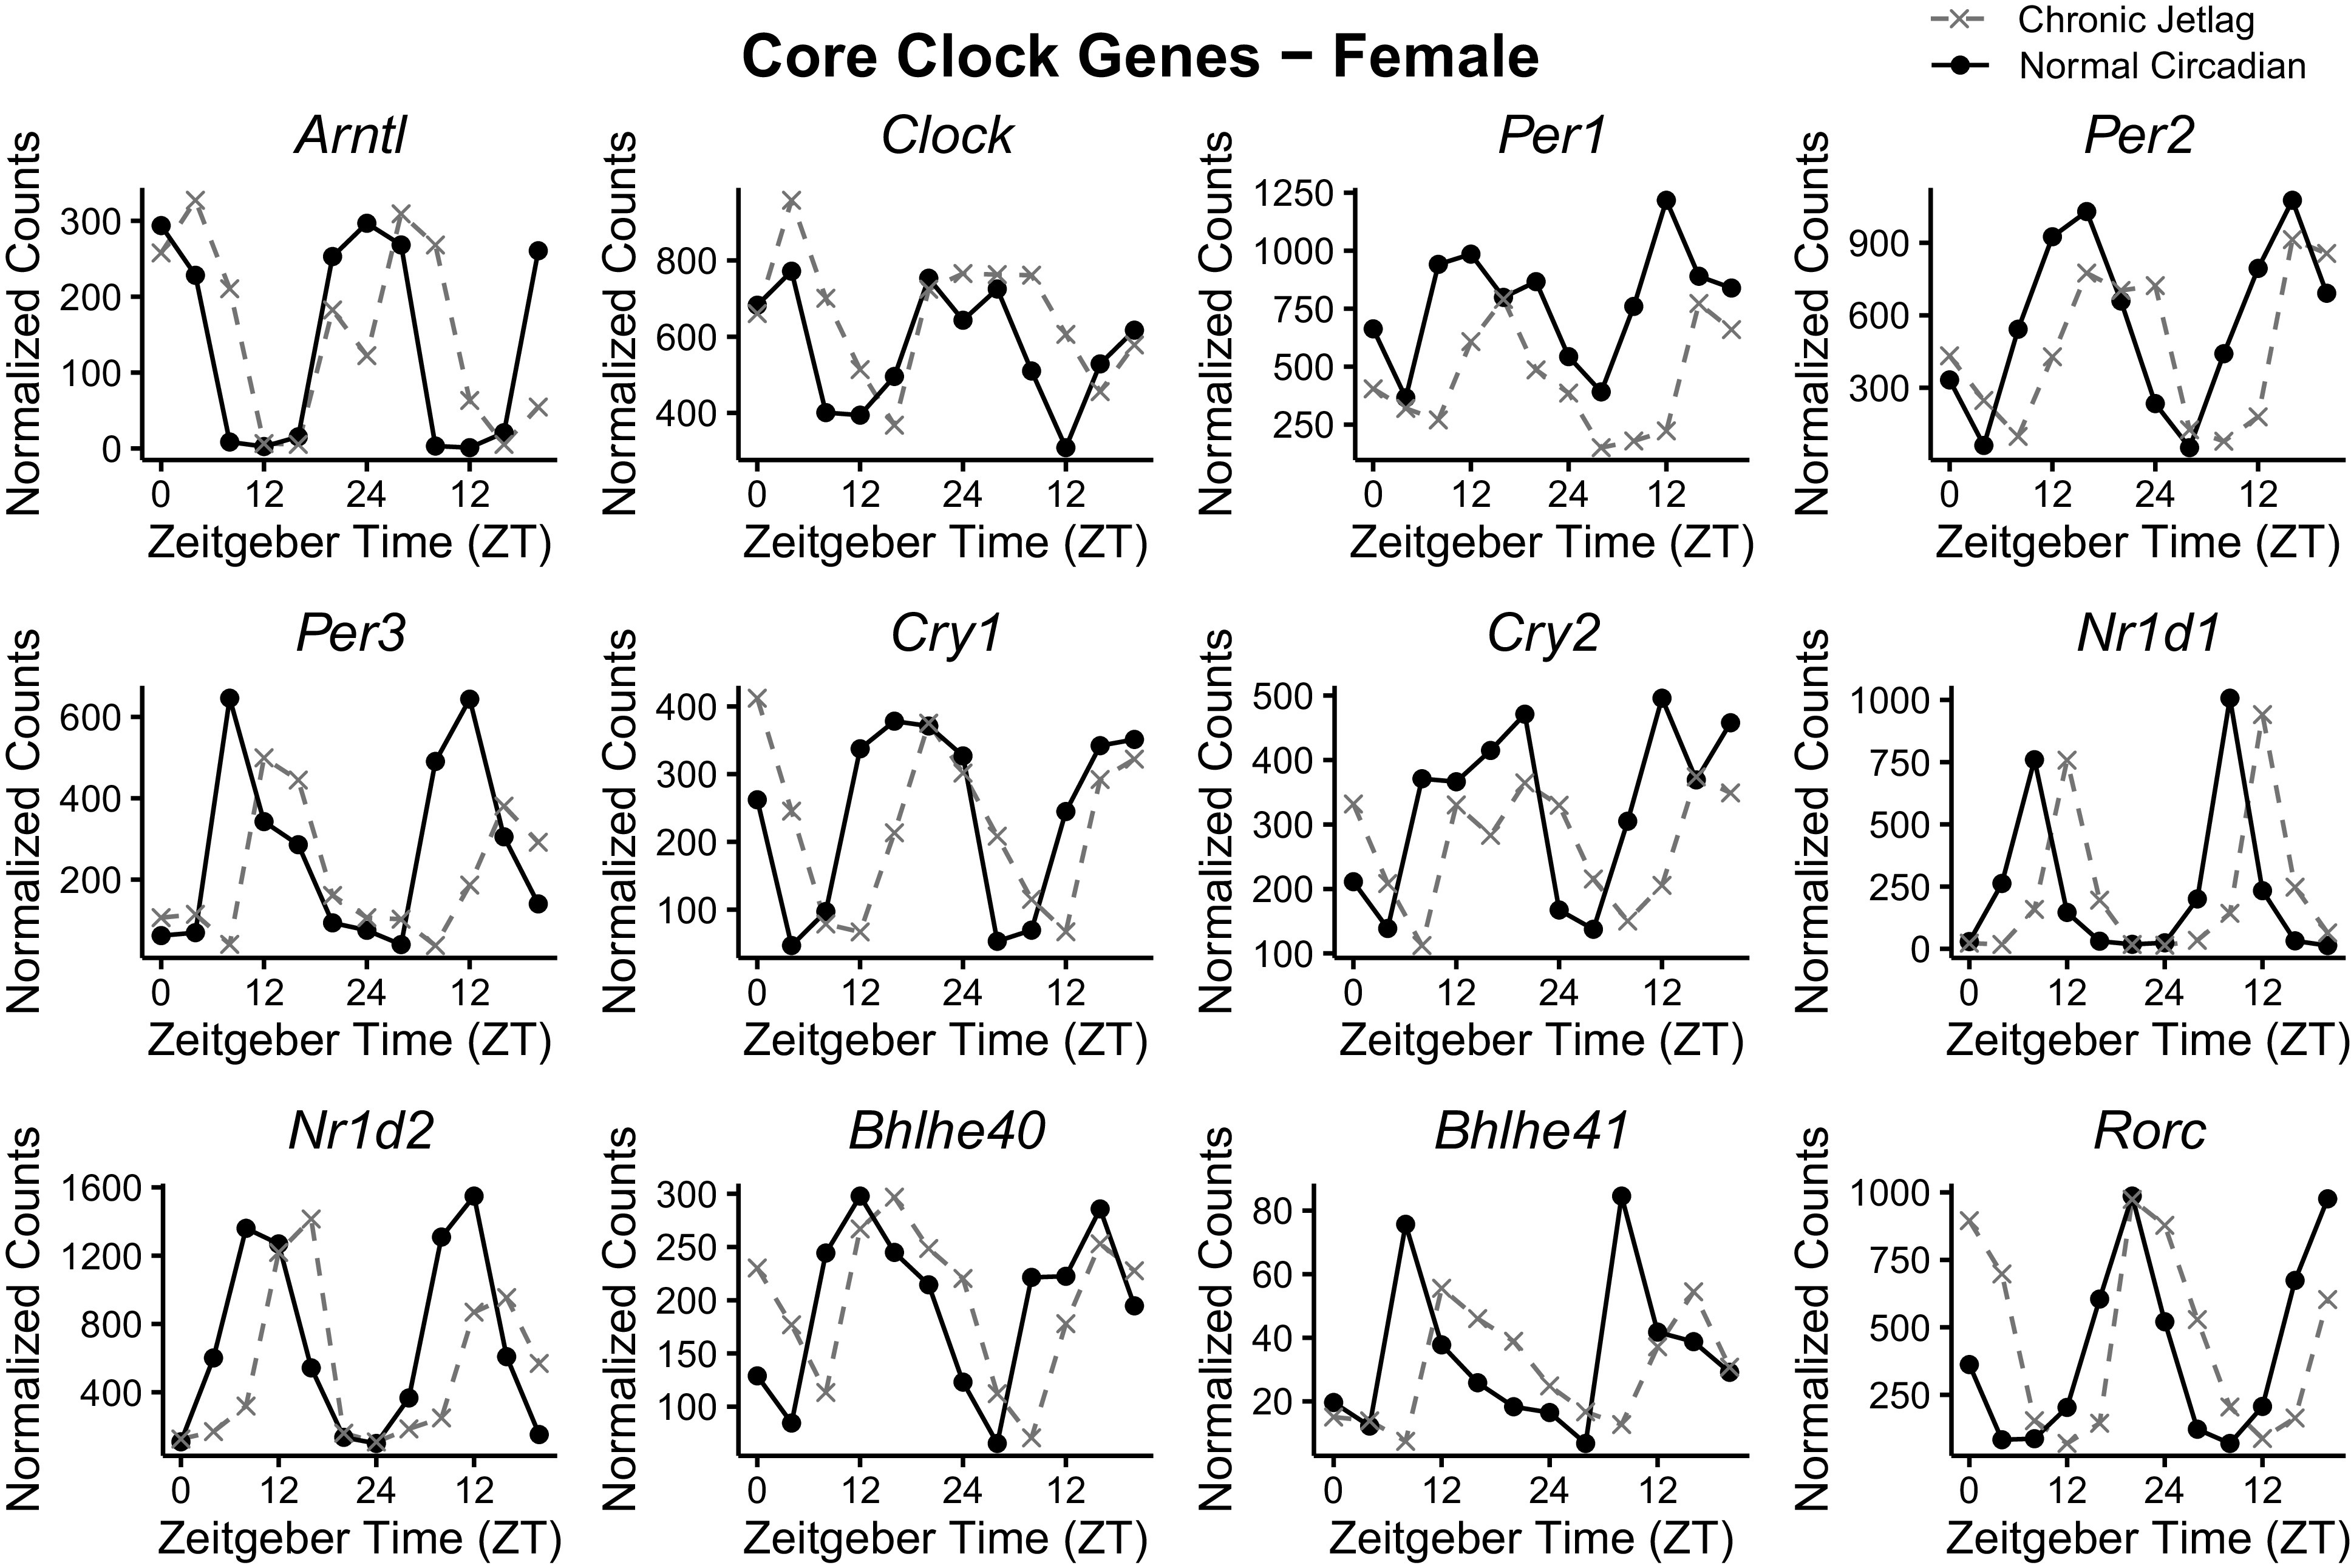
Female core clock gene expression over 48 h is phase shifted following chronic jetlag. Plotted normalized expression of the pancreatic core clock genes in females for normal circadian (black) and chronic jetlag (gray) conditions. Each point represents the pooled average of three mice (n = 3). Mice were euthanized at 4-h intervals over a 48-h period starting at zeitgeber time (ZT) 0 through ZT24.
Table 1.
CircaCompare differential rhythmicity analysis for the stably rhythmic male and female pancreatic core clock genes
| Male CCG | NC mesor | CJ mesor | 95% CI | Mesor P Value |
NC amplitude | CJ amplitude | 95% CI | Amplitude P Value | NC Phase | CJ Phase | 95% CI | Phase P Value |
|---|---|---|---|---|---|---|---|---|---|---|---|---|
| Arntl | 133.61 | 109.18 | −14.89 to 63.78 | 2.08E-01 | 180.05 | 138.71 | −14.27 to 96.98 | 1.36E-01 | 0.08 | 5.33 | −1.73 to −1.02 | 2.20E-07 |
| Clock | 587.94 | 541.21 | −14.99 to 108.3 | 1.29E-01 | 207.74 | 175.90 | −55.42 to 118.93 | 4.53E-01 | 23.81 | 4.54 | −1.70 to −0.78 | 2.27E-05 |
| Per2 | 592.34 | 524.88 | −40.66 to 175.56 | 2.06E-01 | 473.11 | 448.67 | −128.42 to 177.36 | 7.41E-01 | 15.07 | 19.46 | −1.48 to −0.82 | 9.20E-07 |
| Cry1 | 234.60 | 229.12 | −40.8 to 51.79 | 8.06E-01 | 140.08 | 128.21 | −53.6 to 77.35 | 7.08E-01 | 18.20 | 22.36 | −1.58 to −0.6 | 1.89E-04 |
| Cry2 | 328.80 | 286.08 | 9.08 to 76.43 | 1.58E-02 | 157.45 | 99.70 | 10.06 to 105.32 | 2.03E-02 | 14.93 | 20.45 | −1.85 to −1.05 | 5.12E-07 |
| Nr1d1 | 163.24 | 185.35 | −151.65 to 107.45 | 7.24E-01 | 234.35 | 285.85 | −234.69 to 131.73 | 5.62E-01 | 7.97 | 12.51 | −1.9 to −0.47 | 2.62E-03 |
| Nr1d2 | 624.21 | 503.03 | 1.16 to 241.30 | 4.81E-02 | 667.84 | 487.11 | 10.85 to 350.47 | 3.82E-02 | 10.30 | 14.98 | −1.53 to −0.92 | 1.13E-07 |
| Rorc | 425.00 | 463.30 | −146.04 to 69.41 | 4.65E-01 | 449.31 | 447.08 | −150.1 to 154.60 | 9.76E-01 | 19.19 | 0.07 | −1.62 to −0.94 | 2.97E-07 |
| Female CCG | ||||||||||||
| Arntl | 137.60 | 150.97 | −55.83 to 29.05 | 5.16E-01 | 178.10 | 150.58 | −32.52 to 87.52 | 3.48E-01 | 23.87 | 3.75 | −1.38 to 0.65 | |
| Clock | 569.36 | 654.64 | −157.69 to −12.92 | 2.35E-02 | 181.44 | 189.45 | −110.38 to 94.34 | 8.71E-01 | 0.04 | 3.57 | −1.48 to −0.37 | 2.48E-03 |
| Per1 | 771.56 | 437.39 | 213.12 to 455.27 | 1.71E-05 | 278.36 | 261.17 | −153.98 to 188.46 | 8.35E-01 | 13.94 | 17.42 | −1.54 to −0.28 | 7.51E-03 |
| Per2 | 569.77 | 463.20 | 21.3 to 191.88 | 1.72E-02 | 472.68 | 401.19 | −49.07 to 192.16 | 2.29E-01 | 15.07 | 18.93 | −1.29 to -0.73 | 5.01E-07 |
| Cry1 | 240.11 | 224.92 | −25.34 to 55.76 | 4.42E-01 | 169.76 | 156.33 | −43.93 to 70.77 | 6.29E-01 | 17.90 | 21.94 | −1.41 to −0.7 | 6.16E-06 |
| Cry2 | 325.46 | 271.15 | −1.18 to 109.72 | 5.43E-02 | 149.78 | 106.24 | −34.83 to 122.01 | 2.58E-01 | 15.14 | 19.44 | −1.76 to −0.48 | 1.66E-03 |
| Nr1d1 | 229.57 | 217.56 | −169.54 to 193.59 | 8.91E-01 | 350.18 | 328.97 | −235.54 to 278 | 8.64E-01 | 7.88 | 12.29 | −1.91 to −0.4 | 4.96E-03 |
| Nr1d2 | 675.70 | 529.14 | −25.37 to 318.22 | 8.98E-02 | 721.67 | 559.49 | −80.81 to 404.92 | 1.78E-01 | 10.26 | 14.27 | −1.44 to −0.66 | 2.18E-05 |
| Rorc | 408.07 | 450.15 | −143.04 to 58.81 | 3.93E-01 | 438.37 | 449.39 | −153.7 to 131.76 | 8.73E-01 | 19.24 | 23.63 | −1.47 to −0.83 | 5.97E-07 |
| Bhlhe40 | 194.02 | 199.58 | −38.91 to 27.74 | 7.30E-01 | 93.66 | 79.87 | −33.34 to 60.92 | 5.47E-01 | 14.00 | 18.17 | −1.64 to −0.54 | 5.57E-04 |
CCG, core clock genes; CI, confidence interval; CJ, chronic jetlag; mesor, midline estimating statistic of rhythm; NC, normal circadian.
Chronic Jetlag Shifts the Timing of Metabolic Gene Expression
We had found phase differences among the CCGs of male and female mice. Consequently, we wanted to understand if the CJ-induced phase differences extended to the rest of the rhythmic pancreatic transcriptome, which include, but are not limited to, the clock-controlled genes or those rhythmically expressed genes downstream of the CCGs. Notably, evaluation of the genes in the transcriptome that became arrhythmic or exhibited inducible rhythmicity may also hold importance for further investigation of chronic jetlag-induced changes. However, because we found that CCGs maintained rhythmicity but exhibited a phase shift, we focused on the stably rhythmic genes in the pancreatic transcriptome. We examined the entire stably rhythmic transcriptome for differential rhythmicity. Differences in mesor were found in 146/335 (43.58%) male and 37/297 (12.5%) female stably rhythmic genes, and differences in amplitude were identified in 19/335 (5.67%) male and 12/297 (4.04%) female stably rhythmic genes. Among the stably rhythmic genes, 328/335 male (97.9%) and 288/297 female genes (96.97%) had a statistically significant phase shift, indicating the predominant effect of CJ on the pancreatic transcriptome of stably rhythmic genes was alterations in the phase of expression. The average phase shift among differentially rhythmic genes following CJ was 4.35 ± 1.50 h in males and 3.89 ± 1.18 h in females.
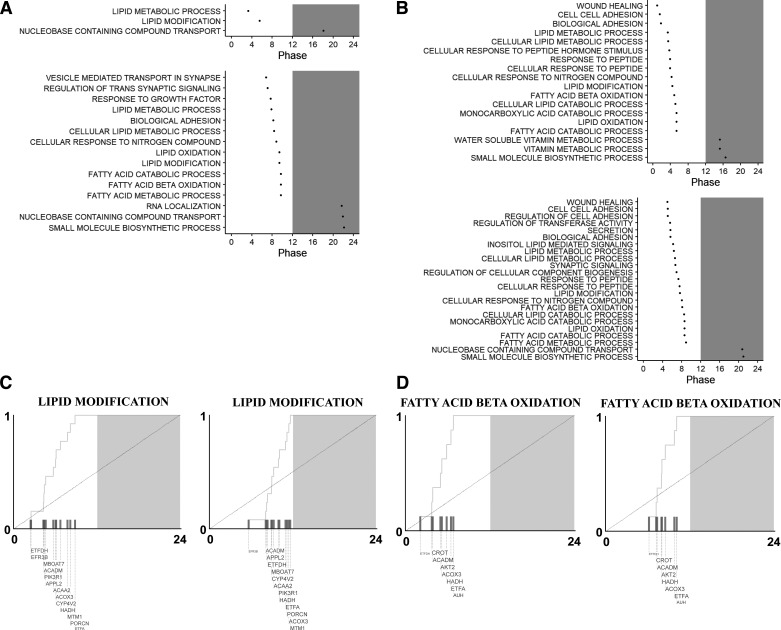
We then sought to understand the pathways associated with phase shift in the pancreatic transcriptome. Given that we did not find differences in pathway enrichment analysis when comparing the NC and CJ rhythmic gene sets, we hypothesized that the timing of pathway activation is of greater importance. Therefore, all stably rhythmic genes in the transcriptome with statistically significant phase shifts were entered into to the phase set enrichment analysis (PSEA) tool. PSEA identifies biologically related gene sets showing temporally coordinated expression based on the Kuiper test (26). As expected, based on the pathway enrichment analysis of the rhythmic pancreatic genes (Supplemental Tables S1 and S2), the overrepresented pathways on PSEA analysis were similar between NC and CJ conditions (Fig. 6). We observed that many of the pathways in both males (Fig. 6A) and females (Fig. 6B) involved metabolic pathways, especially lipid metabolism. Meanwhile, the timing of expression of these pathways was altered in response to CJ. Collectively, this suggested that pathway enrichment for rhythmically expressed genes may be similar between NC and CJ, but CJ alters the timing of pathway activation.
Figure 6.
Phase set enrichment analysis demonstrates preferential shifts in the expression of metabolic pathways. Phase set enrichment analysis (PSEA) for male (A) and female (B) normal circadian (NC; A and B, top) and chronic jetlag (CJ; A and B, bottom). All stably rhythmic genes in the transcriptome were entered into the PSEA JAVA script tool along with their respective phase (time of peak expression). Pathways were examined for differences from a uniform background based on the Kuiper test. Statistically significant (q < 0.05) gene ontology (GO) biologic process (BP) pathways are shown in A and B along with their respective phase. Shading represents the period of darkness [ZT12-ZT24 (zeitgeber time)]. Pathways were similar between NC and CJ conditions. Many metabolism-related pathways, especially lipid metabolism pathways, were present in both NC and CJ conditions and underwent a phase shift. Selected pathways are shown for both males (C) and females (D). Contributing genes for each pathway are shown as space allows. Gene font size is proportional to the magnitude of the contribution of a gene to each pathway.
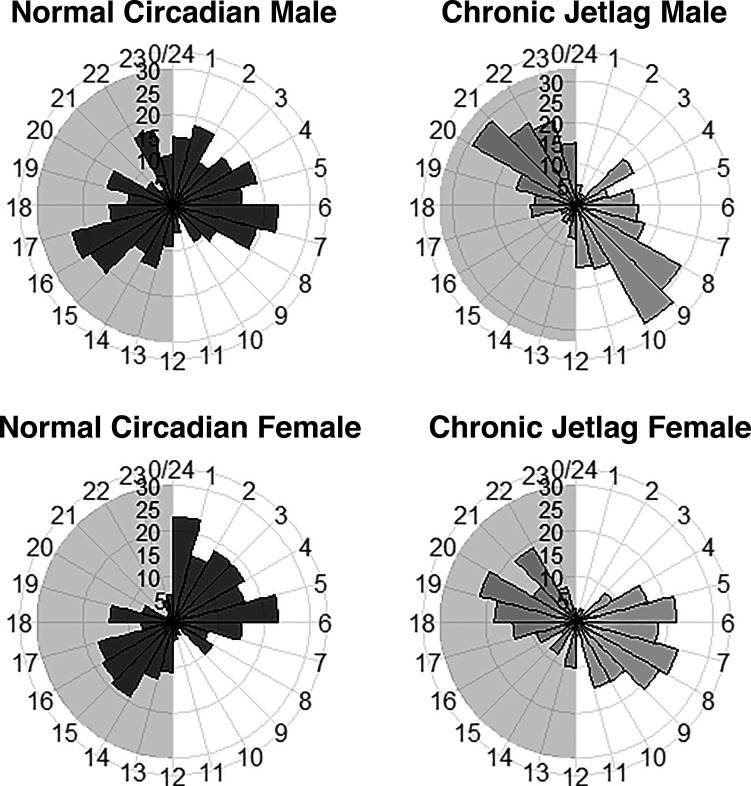
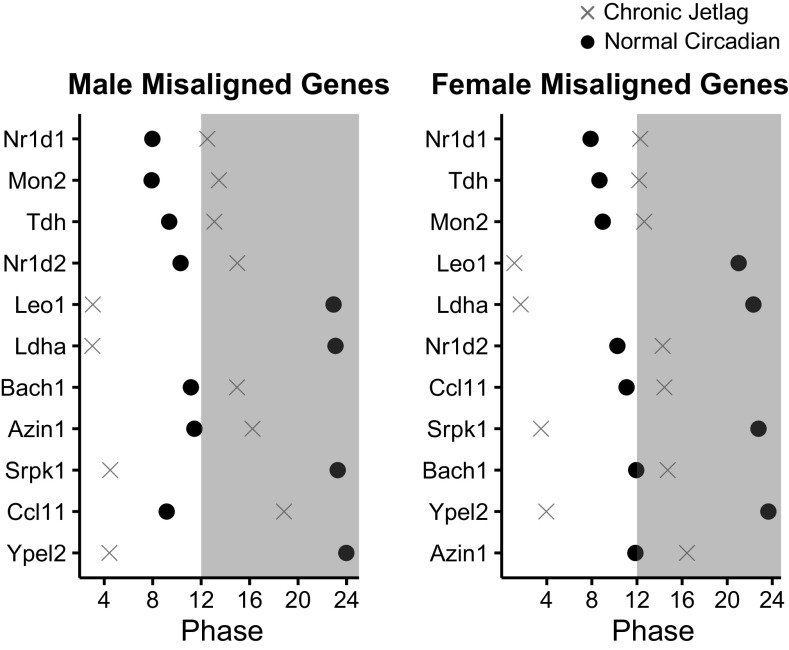
To further understand the impact of the phase shift on rhythmic gene expression, we plotted all stably rhythmic transcripts by their phase (Fig. 7). We found that the phase of rhythmic genes exhibited a bimodal distribution in both male and female mice, which shifted in response to CJ conditions. Interestingly, several rhythmic genes were found to shift across the LD cycle. A change in the phase of gene expression relative to the LD cycle is known as gene misalignment (20). Prior studies examining this phenomenon have demonstrated that misalignment between the internal circadian clock and the external LD cycle can result in pathology such as prolonged cardiac conduction, among other physiologic derangements (20, 36). We found that 60/335 (17.9%) male and 37/297 (12.5%) female rhythmic genes were misaligned relative to the LD cycle due to CJ. We then looked for those genes that were misaligned in both male and female mice. A total of 11 genes were identified (Fig. 8). These genes included the CCGs Nr1d1 and Nr1d2 and the metabolism-related genes Ldha, Tda, and Azin1 (Supplemental Fig. S2; see https://doi.org/10.6084/m9.figshare.14331188.v1, Supplemental Fig. S3; see https://doi.org/10.6084/m9.figshare.14331194.v1, and Supplemental Table S3; see https://doi.org/10.6084/m9.figshare.14036711.v1). Therefore, we found that CJ was associated with the misalignment of several core clock and metabolism-related genes.
Figure 7.
Chronic jetlag promotes a phase shift in stably rhythmic genes. Histograms demonstrating the phase of peak expression are shown in 1-h bins. All stably rhythmic genes which exhibited a statistically significant phase shift on differential rhythmicity analysis were included. The scale originating from the center of each graph represents the number of genes at a particular zeitgeber time (ZT). The numbers along the periphery of each circle represent the ZT from ZT0-ZT24. Plot background shading represents the period of the night from ZT12-ZT24. Both male and female histograms demonstrate a bimodal curve that shifts in response to chronic jetlag conditions.
Figure 8.
Chronic jetlag leads to the misalignment of genes relative to their light-dark cycle. Graphs demonstrating the phases of the 11 misaligned genes common in both males and females. The phase, representing the peak expression relative to the time of day, is plotted for each gene under normal circadian (black dot) and chronic jetlag (gray X) conditions. Shading represents the period of the night from ZT12-ZT24 (zeitgeber time).
Rhythmic Expression of Genes Involved in Pancreatic Cell Function
We next sought to examine the genes involved in normal pancreatic cellular function. Thus, we queried the KEGG database for genes involved in either the pancreatic exocrine secretion or insulin signaling pathways. We evaluated 253 genes, including 114 exocrine and 139 endocrine genes. A total of 21/253 (8.3%) genes in males and 28/253 (11.1%) genes in females under NC conditions, and 27/253 (10.7%) in males and 23/253 (9.1%) in females under CJ conditions were found to be rhythmic (q < 0.1). Stable rhythmicity was observed in 9/27 (33.3%) male and 11/23 (47.8%) female genes. Of these, five male (Kcnq1, Pik3r1, Plcb4, Ppp1r3c, and Rab27b) and six female (Akt2, Cela3a, Kcnq1, Kras, Plcb4, and Rab27b) genes involved in exocrine secretion or insulin signaling pathways were found to have undergone a statistically significant phase shift when evaluated by CircaCompare (P < 0.05). Thus, like the global gene assessment, the number of diurnally expressed genes involved in pancreatic cellular functions was on the order of 8%–11%, and several underwent a phase shift similar to what was seen with our previous evaluations.
Chronic Jetlag Produced Alterations Which Resisted Reentrainment
Whereas differences in core clock gene expression were evident up to 48 h, the chronicity of the effect remained unknown. The process by which a mouse adapts to and realigns to a new series of external cues is known as reentrainment. Prior research has demonstrated that reentrainment differs based on the physiologic process (gene expression vs. behavior) and gene or tissue of interest (37, 38).
To understand when CJ mice reentrained, we started by replicating our initial transcriptomic (chronic jetlag) experiment. Ninety-six WT mice were subjected to NC conditions (n = 48) or CJ conditions (n = 48). All mice were then transitioned back to NC conditions 12 h before ZT0 (ZT0 corresponds to 06:00 on experimental day 1). To track reentrainment across the assessment period, the time where CCG expression showed the greatest separation in the first 24 h (and concomitantly the second 24 h) was selected as the daily time point (Fig. 9A). This equated to ZT8 over the first two periods. Mice in each condition (n = 6 NC, three male/three female; n = 6 CJ, three male/three female) were euthanized every 24 h starting at ZT8 on day 3 postnormalization until day 10. During this period, we measured the time to convergence of gene expression (i.e., reentrainment). To accomplish this, pancreatic RNA was isolated as previously described and qRT-PCR performed for Arntl, Per2, and Per3, representing opposing arms of the CCG TTFL for postnormalization days 1–10. In both males and females, as indicated by Arntl, Per2, and Per3, reentrainment did not occur, with statistically significant differences continuing through day 10 of normalization (Fig. 9B). Interestingly, gene expression of Arntl, Per2, and Per3 appeared to converge by days 3–4, but then demonstrated a “crossover effect” with a divergence that persisted for the duration of the evaluation. Although Per2 is one of the predominant CCGs used in prior reentrainment experiments, experiments have shown that Per2 oscillates despite key core clock knockout—indicating systemic signals exert control over its rhythmic expression (39). Therefore, we additionally profiled the reentrainment of Per3 which demonstrated a similar morphology.
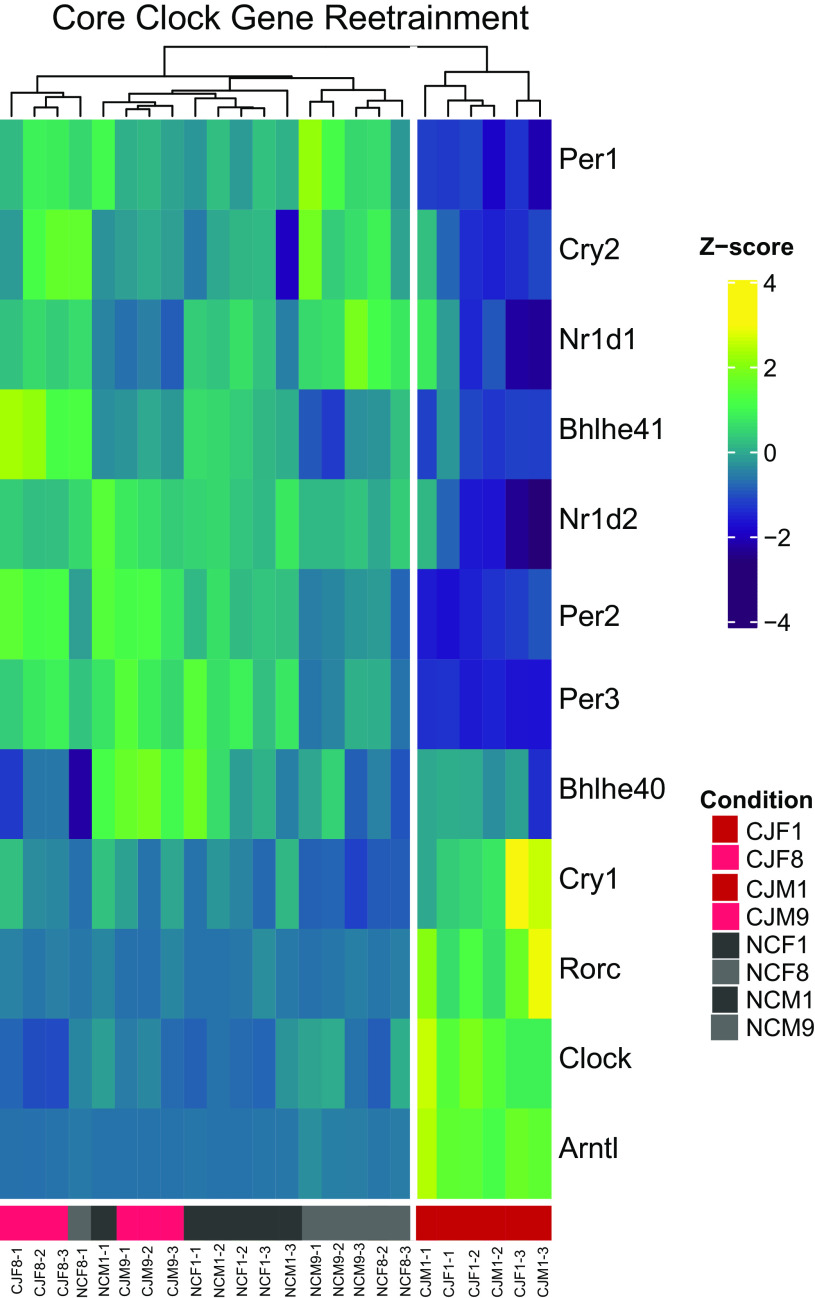
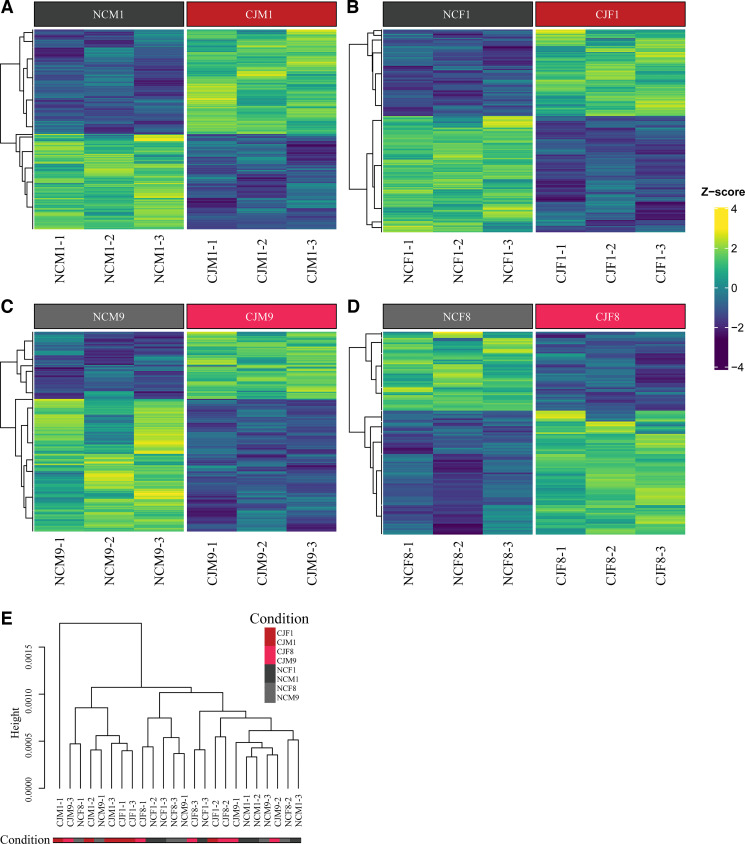
To further understand the observed crossover event and the regulation of other CCGs and rhythmically expressed genes during normalization, we performed additional bulk RNAseq. Pancreatic mRNA from early normalization at ZT8 (n = 12, 6 males/6 females) was compared to ZT8 during late normalization on day 8 in females and day 9 in males. The late time points were chosen due to their ongoing statistical significance on the qRT-PCR analysis (Fig. 9). When specifically evaluating the CCGs (Fig. 10), the heatmap dendrogram revealed the CCG signature clearly distinguished NC from CJ mice on day 1. CJ mice on day 8/9 exhibited some similarity to NC mice but appeared to segregate on the dendrogram. Both differed from CJ mice on day 1. Thus, these findings suggested that the CCG expression of CJ mice may be in the process of reentrainment by day 8/9. Interestingly, whereas the heatmap dendrogram analysis suggested convergence may be occurring, this was different than our qRT-PCR data. To better understand the putative discrepancy between the two results, we performed differential gene expression testing for males and females between NC and CJ mice on day 1 and day 8/9 (Fig. 11). The subsequent heatmaps revealed persistent differences between male (Fig. 11, A and C) and female (Fig. 11, B and D) NC and CJ mice. In total, on day 8/9, we found that 131 female genes and 229 male genes were differentially expressed between NC and CJ mice (Supplemental Tables S4–S7; see https://doi.org/10.6084/m9.figshare.14331155.v1, https://doi.org/10.6084/m9.figshare.14331176.v1, https://doi.org/10.6084/m9.figshare.14331179.v1, https://doi.org/10.6084/m9.figshare.14331182.v1). Thirteen genes were found to be differentially expressed in both males and females. Remarkably, of the 13 combined male and female differentially expressed genes, 12/13 (Aqp8, Ccbe1, Ciart, Dbp, Per2, Per3, Ranbp3l, Sdc4, Tef, Trim50, Usp2, Ypel2) underwent a crossover, similar to what we observed with our qPCR analysis, including the CCGs Per2 and Per3. For example, on day 1, male CJ mice exhibited a 2.32 log-fold downregulation of Per2 expression compared to NC mice (q = 2.83E-14); however, on day 9 male CJ mice exhibited a 1.08 log-fold upregulation in Per2 expression compared to NC mice (q = 2.52E-15). Thus, these data reveal that there were ongoing statistical differences in clock gene expression even after days 8–9 postnormalization. However, evaluation of a single daily time point cannot distinguish between differences in rhythmicity caused by a persistent phase shift or concomitant change in mesor or amplitude.
Figure 10.
Chronic jetlag core clock gene transcriptomic signatures demonstrate movement toward reentrainment after normalization. Heatmap representing the differential gene expression analysis output from edgeR for each of the pancreatic core clock genes (CCGs) during early (day 1) and late (day 8/9) reentrainment. Unsupervised dendrogram clustering demonstrates a signature from chronic jetlag (CJ) male and female mice on day 1 that is different from normal circadian (NC) mice. CJ mice on day 8/9 are more similar to NC mice than CJ mice on day 9. {NCM1 = normal circadian male day 1 of normalization [zeitgeber time (ZT) 8], NCM9 = normal circadian male day 9 of normalization [ZT8], NCF1 = normal circadian female day 1 of normalization [ZT8], NCF8 = normal circadian female day 8 of normalization [ZT8], CJM1 = chronic jetlag male day 1 of normalization [ZT8], CJM9 = chronic jetlag male day 9 of normalization [ZT8], CJF1 = chronic jetlag female day 1 of normalization [ZT8], CJF8 = chronic jetlag female day 8 of normalization [ZT8]}.
Figure 11.
Bulk RNA-sequencing following chronic jetlag reveals persistent pancreatic differential gene expression despite normalization. Heatmaps were created following differential gene expression testing with edgeR. All significantly different genes (q < 0.05) were included. Results are shown for males (A and C) and females (B and D) during early {day 1 [zeitgeber time (ZT) 8]; Fig. 11, A and B} and late [day 8/9 (ZT8); C and D] normalization. Three mice were assessed for each time point and condition. The data demonstrate that significant differences between normal circadian and chronic jetlag mice exist even after 8/9 days of normalization. Hierarchical clustering (E) was performed on the Euclidean distances computed between samples. With few exceptions, chronic jetlag mice on day 1 exhibited transcriptomic signatures that clustered separately from normal circadian mice. [NCM1 = normal circadian male day 1 of normalization (zeitgeber time 8), NCM9 = normal circadian male day 9 of normalization (ZT8), NCF1 = normal circadian female day 1 of normalization (ZT8), NCF8 = normal circadian female day 8 of normalization (ZT8), CJM1 = chronic jetlag male day 1 of normalization (ZT8), CJM9 = chronic jetlag male day 9 of normalization (ZT8), CJF1 = chronic jetlag female day 1 of normalization (ZT8), CJF8 = chronic jetlag female day 8 of normalization (ZT8)].
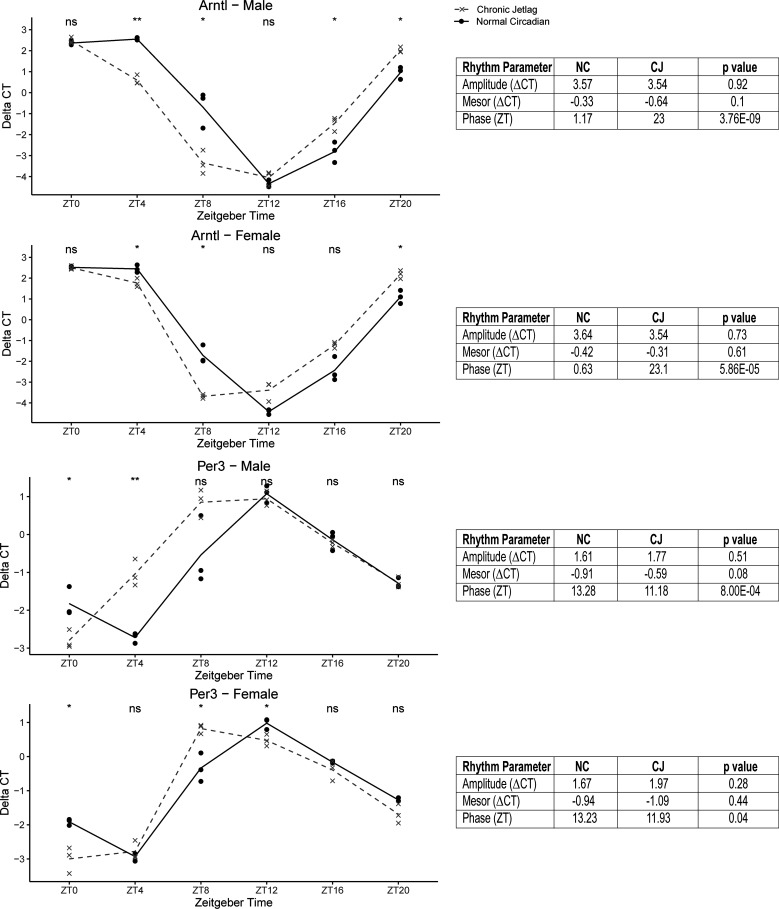
Therefore, to further understand the implications of the ongoing differences we had observed, we elected to evaluate mice for a full period on day 9 postnormalization. An additional 72 mice were subjected to either our NC or CJ protocol and euthanized at 4-h intervals for 24 h (n = 12 per time point with 3 males/females per condition). qRT-PCR was performed for both Arntl and Per3 (Fig. 12). Our evaluation of the expression of Arntl and Per3 demonstrated no differences in amplitude or mesor. Instead, we found that ongoing phase differences existed for both males and females for both genes assessed, with an average difference of 1.79 ± 0.44 h. Therefore, CJ led to a persistent phase difference in the CCGs assessed even after 9 days, and the phase difference was consistent with the “crossover” effect that was observed (i.e., direction of phase difference).
Figure 12.
Reentrainment of mouse pancreas did not occur by day 9 postnormalization. The graphs represent the diurnal expression of Arntl and Per3 for normal circadian (NC; solid black) and chronic jetlag (CJ; dashed grey) mice at day 9 postnormalization. Expression was measured by quantitative real-time PCR at 4-h intervals (n = 12 per condition; 6 males/females) from zeitgeber time (ZT) 0-ZT20, and comparisons at each time point were made with Student’s t test. Differential rhythmicity testing was performed with CircaCompare, and the results are shown in the table associated with each graph. All four graphs demonstrate a statistically significant phase shift without associated changes in amplitude or mesor. ns, Not significant, ***P < 0.001, ****P < 0.0001.
Mouse Behavior Adapts Quickly under Chronic Jetlag Conditions
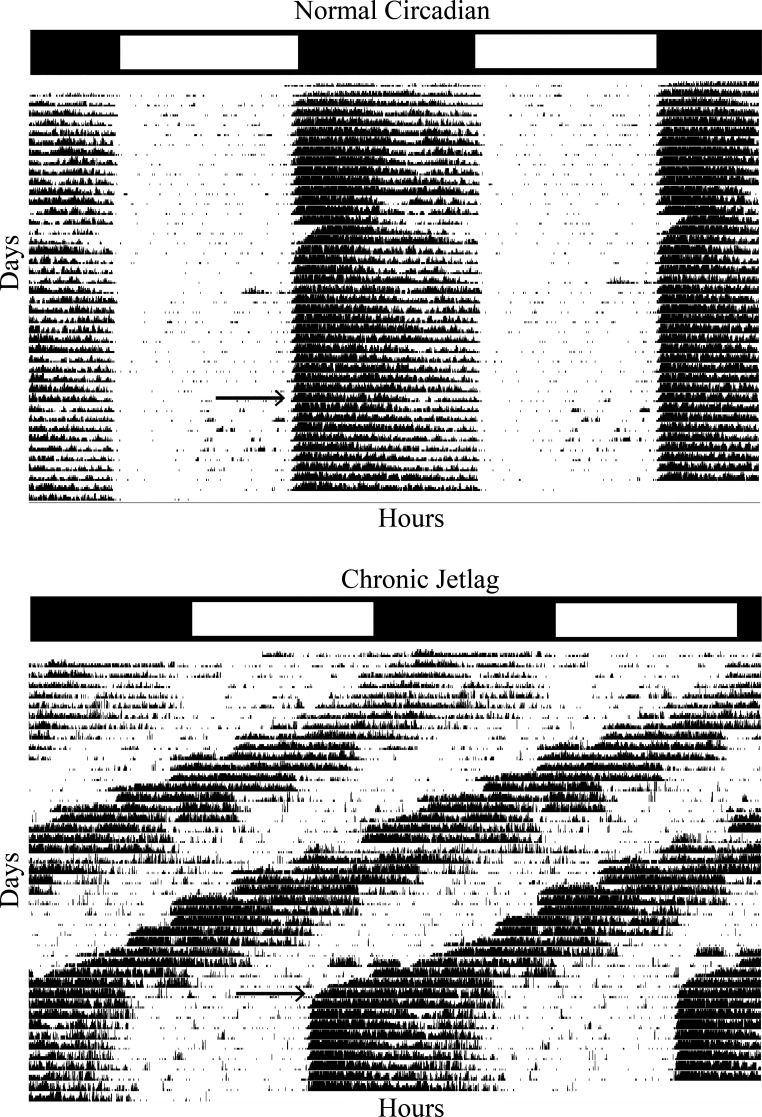
Wheel running data were obtained from mice under NC (n = 7) and CJ (n = 7) conditions, and reentrainment was measured. One mouse in each group failed to complete the experiment. The normalized average double plotted actograms for each condition are shown (Fig. 13). Both conditions demonstrated rhythmic behavior (P < 0.01 following Cosinor testing). From these data, it appears that CJ mice behaviorally reentrained to changes in their LD cycle with similar wheel running attributes to NC mice after 2–3 days—considerably quicker than what was seen with the pancreas gene expression. This indicates that behavioral reentrainment is discordant with reentrainment as measured by gene expression.
Figure 13.
Behavioral reentrainment occurs more quickly than pancreatic transcriptomic reentrainment. Double plotted behavioral actograms for normal circadian (NC) and chronic jetlag (CJ) mice utilizing the ClockLab software. Behavioral activity is a normalized average of seven mice (NC: n = 3 males/n = 4 females and CJ: n = 4 males/n = 3 females) in each condition and manually checked for masking effects. The initial light-dark (LD) cycle is shown for each condition in a bar above each plot, with white indicating light and black indicating darkness. The arrow indicates the onset of darkness on day one of normalization. Reentrainment occurred behaviorally when activity became vertically aligned with the LD cycle. Following normalization after CJ conditions, reentrainment occurred within 2−3 days.
DISCUSSION
Chronic jetlag in the form of shift work is associated with the development of several conditions in humans, including obesity, the metabolic syndrome, and cancer, and appears to be end organ specific (40–42). For instance, in a study evaluating CJ on the formation of liver pathology, CJ in mice led to the suppression and arrhythmic expression of the hepatic CCG Arntl compared to normal lighting conditions (15). This was associated with the development of NAFLD in 100% of mice and heightened susceptibility to nonalcoholic steatohepatitis (NASH) and, subsequently, hepatocellular carcinoma formation. The authors also described the formation of additional tumors in their studies of CJ, including pancreatic tumors. The finding of Arntl suppression and arrhythmicity in the liver study was particularly interesting, given the protocol (CJ) and the fact that suppression of Arntl has been identified in tumors from the pancreas, suggesting a link between CCG suppression and cancer formation of the pancreas (12, 13). However, the assessment of CCG expression in the whole pancreas in these studies was relatively limited, and the effects of CJ on the pancreatic transcriptome had not been determined. Thus, we assessed the core circadian clock and rhythmic gene expression in whole pancreas and ascertained how CJ impacted variations in diurnal expression. Following our evaluation, in contrast to the CJ-induced changes of CCG expression in the liver, we found that the core molecular clock remained rhythmic, albeit with a shift in the phase of expression. The findings of a phase shift rather than arrhythmicity between their study and ours are likely multifactorial, including tissue-specific differences (liver vs. pancreas), differences in CJ protocol duration (8 wk vs. 4 wk), differences in the frequency and extent of LD cycle changes (weekly vs. every 2–3 days and 8- vs. 4-h shifts), and the number of periods evaluated (24 vs. 48 h). We also found similar phase shifts in genes involved in multiple metabolic pathways, especially lipid metabolism pathways, and misalignment of genes relative to the LD cycle. Furthermore, we found that there were persistent phase differences 9 days after the LD cycle was normalized, indicating a failure to reentrain to the new LD cycle.
To date, the focus of prior chronobiology work in the pancreas has been on islet cells. Islet cells act as the endocrine organ of the pancreas and function to coordinate the secretion of hormones, such as glucose, glucagon, somatostatin, and pancreatic polypeptide, which are important for digestion and metabolism (7). Marcheva et al. performed an intricate set of studies to determine the effects of pancreas-specific CCG knockout (Arntlfx/fx-Pdx-1 Cre mice and ClockΔ19/Δ19 mice) in pancreatic islets and demonstrated that islets displayed decreased size and increased apoptosis as compared to wild-type mice (6). Furthermore, they found that Clock mutant mice showed altered expression or phase shift of four different rhythmically expressed genes involved in insulin signaling. Notably, two of the genes that demonstrated phase shift in Clock mutant mice, Pik3r1 and Akt2, were among the pancreatic genes that demonstrated a phase shift with CJ perturbation in our study. Analysis of pancreatic exocrine and endocrine specific genes in our study also revealed that a gene encoding for a potassium voltage-gated channel protein (Kcnq1) was rhythmically expressed in both males and females and CJ resulted in phase shift. This finding suggests but does not definitely determine that Kcnq1 may be regulated by the CCGs (i.e., clock-controlled gene). Mutation of this gene in humans is associated with type 2 diabetes mellitus— thought to be secondary to a reduction in beta cell mass (beta cells comprise ∼80% of pancreatic islets) (43). Moreover, Marcheva et al. demonstrated that islets isolated from Clock and Arntl mutant mice failed to increase insulin with potassium-chloride stimulation as compared to wild-type mice, indicating aberrant potassium-regulated insulin exocytosis. Although the channel protein Kcnq1 was not specifically identified in the study by Marcheva et al., these findings reveal some similarities between CJ-induced perturbation of the pancreas and core clock gene mutation-induced circadian disruption. In the present study, we analyzed the pancreatic parenchyma of CJ and NC mice, but we did not find evidence that the pancreatic parenchyma (including islets) was affected by our CJ protocol (Supplemental Fig. S1; see https://doi.org/10.6084/m9.figshare.14036741.v1). It is possible that there may be changes in islet cell populations with long-standing CJ (our study involved 4 wk of CJ). In support of this suggestion, Marcheva et al. found that glucose-stimulated insulin secretion was impaired at 3 mo of age in Clock and Arntl mutant mice, yet they did not see differences in fasting and fed glucose levels or islet size. The change in islet size only became apparent by age 8 mo. Thus, the impact of long-standing CJ along with a deeper investigation of Kcnq1 will be an important follow-up evaluation.
We also profiled the diurnal variations of the stably rhythmic CCGs followed by the rest of the pancreatic transcriptome. We found that a striking degree of these genes exhibited a phase shift, subsequently resulting in the misalignment of several genes with the mouse light-dark cycle. This misalignment was characterized by West et al., who described that phase misalignment produced by non-24-h cycles (e.g., 20 h and 22.5 h) could lead to sustained cardiac and metabolic pathology (20). In particular, the group managed to link cardiac conduction aberrations with phase misalignment. In the present study, we identified 11 genes that exhibited expression that was misaligned relative to the light-dark cycle in both male and female mice. This included several metabolism-related genes, including the anaerobic glycolysis gene Ldha, which has previously been shown to have reduced expression in skeletal muscle and increased expression in the liver of Arntl knockout mice (44, 45). Thus, the CJ-induced misalignment of these key metabolism genes will be a focus of future studies evaluating pancreatic metabolic dysfunction with long-term CJ or CJ in disease-prone (e.g., diabetes- or cancer-prone) mice. Of note, the mice in our study had access to food ad libitum, and thus we are not able to fully untangle the metabolic genes regulated by feeding behavior from those affected by shifting of the LD cycle. It is entirely possible that changes in the LD cycle promoted alterations in feeding behavior and thus the rhythmic expression of metabolic genes. The effect of feeding patterns on mice has been demonstrated by Greenwell et al. who exposed mice to time-restricted (e.g., access to feeding during the active phase alone), arrhythmic, or ad libitum feeding patterns and then measured hepatic gene expression (35). They subsequently found that feeding time was a potent driver of many metabolic genes. Interestingly, they found that most of the CCGs were not affected by rhythmic food intake but were affected by molecular (Arntl) knockout. For this reason, the effects that we saw (particularly on the CCGs) are unlikely to be entirely accounted for by changes in the timing of feeding. Time-restricted feeding paradigms will help to evaluate the separate contributions of light and food in producing the variations in diurnal expression observed.
From this study of CJ-induced phase shifts in rhythmic pancreatic gene expression, another relevant question, particularly for humans, is how long the effects of the CJ endure. Human studies, under laboratory conditions, demonstrate that following phase shift protocols, entrainment occurs at a rate of 1–2 h per day (14, 46). In murine studies, qRT-PCR analysis of a limited number of pancreatic transcripts has shown the pancreas to be more resistant to reentrainment than brain, liver, adrenal, and kidney, taking between 3.5−5 days for each CCG to normalize to a single 6-h phase shift (38). Another study examining suprachiasmatic nuclei (SCN) from mice subjected to a single 6-h phase shift took 8 days to reentrain (47). Finally, a study examining a chronic shift work protocol on rat liver found that expression of the CCG Arntl, but not Per2 reentrained over 7 days (48). Although related, these studies are not likely to fully explain the effects of CJ seen in our experimental model. Complicating matters further, behavioral and transcriptomic data do not appear to reentrain at the same rate, as indicated in our study and by others (38). Given the tissue specificity and lack of studies examining a CJ protocol (i.e., most examine an acute phase shift) in the pancreas, we sought to investigate the time to reentrainment following our protocol (which is more representative of humans performing shift work). To accomplish this, we serially euthanized mice at a single time point, daily, for a total of 10 days. Even though this approach limited our ability to determine the specific reason for ongoing differences in gene expression (e.g., phase shift vs. changes in amplitude or mesor), it permitted us to track differences in expression through the lengthy follow-up required. We found that there were persistent differences at ZT8, up to 10 days following normalization. To further understand whether these differences were due to an ongoing phase difference or concomitant differences in amplitude or mesor, we profiled the diurnal expression of Arntl and Per3 over 24 h on day 9 postnormalization. Although we found no differences in amplitude or mesor, we found that there was an average 1.79-h phase difference observed for both male and female mice for each gene assessed. Interestingly, the observed phase differences were found to be in the opposite direction as compared to the 48-h data (days 1–2 postnormalization), which is concordant with the observed crossover at days 3–4 postnormalization. The reason for such a crossover is not known, but it may indicate a failure for the mice to entrain using the new LD cues or an overcompensation during reentrainment. Alternatively, this could indicate antidromic rather than orthodromic reentrainment, but this is felt to be less likely due to the observed crossover event (49). Collectively, these findings have implications for shift workers when discussing the risk of repeated disruption events.
To our knowledge, ours is the first study to measure the pancreatic transcriptome and diurnal variations in response to CJ using both the endocrine and exocrine cells of the pancreas over two complete periods (48 h). Contrary to our hypothesis, there was not significant dysregulation of the core clock machinery as it remained rhythmic despite CJ but uniformly demonstrated phase shifts. Evaluation of the rhythmic pancreatic transcriptome affected by the phase shift revealed that metabolic and pancreas-specific (both exocrine and endocrine) pathways were altered. Additionally, the CJ-induced changes did not completely resolve over 10 days of normalization. Given the prevalence of chronic jet lag (e.g., shift work and sleep disturbance) in human society, the information from these studies will serve as a foundation for investigators aiming to understand how CJ may impact the pancreas in both normal and disease-prone states.
SUPPLEMENTAL DATA
Supplemental Table S1: https://doi.org/10.6084/m9.figshare.14331143.v1.
Supplemental Table S2: https://doi.org/10.6084/m9.figshare.14036720.v1.
Supplemental Table S3; https://doi.org/10.6084/m9.figshare.14036711.v1.
Supplemental Table S4; https://doi.org/10.6084/m9.figshare.14331155.v1.
Supplemental Table S5; https://doi.org/10.6084/m9.figshare.14331176.v1.
Supplemental Table S6: https://doi.org/10.6084/m9.figshare.14331179.v1.
Supplemental Table S7: https://doi.org/10.6084/m9.figshare.14331182.v1.
Supplemental Fig. S1; https://doi.org/10.6084/m9.figshare.14036741.v1.
Supplemental Fig. S2; https://doi.org/10.6084/m9.figshare.14331188.v1.
Supplemental Fig. S3; https://doi.org/10.6084/m9.figshare.14331194.v1.
GRANTS
The research reported in this publication was supported by the National Institutes of Health under Award Number T32 ES007015 and the University of Wisconsin Carbone Cancer Center (UWCCC), Paul P. Carbone Memorial Foundation. This work is also supported in part by the NIH/NCI P30CA014520-UW Comprehensive Cancer Center Support Grant (CCSG) and the Michael W. Oglesby Foundation.
DISCLAIMERS
The content is solely the responsibility of the authors and does not necessarily represent the official views of the National Institutes of Health.
DISCLOSURES
No conflicts of interest, financial or otherwise, are declared by the authors.
AUTHOR CONTRIBUTIONS
P.B.S. and S.M.R. conceived and designed research; P.B.S., M.T.W., M.N., N.D.C., K.A.M., and S.M.R. performed experiments; P.B.S., M.B., G.W., K.A.M., and S.M.R. analyzed data; P.B.S., G.W., and S.M.R. interpreted results of experiments; P.B.S., M.B., and S.M.R. prepared figures; P.B.S. drafted manuscript; P.B.S., M.N., G.W., and S.M.R. edited and revised manuscript; P.B.S., M.T.W., M.B., M.N., G.W., N.D.C., K.A.M., and S.M.R. approved final version of manuscript.
ACKNOWLEDGMENTS
We take the opportunity to acknowledge the University of Wisconsin Carbone Cancer Center Support Grant P30 CA014520, which provides funding for the Experimental Animal Pathology Lab Core; acknowledge the Gene Expression Center and the Bioinformatics Resource Center (BRC) at the University of Wisconsin-Madison for their contributions to this work; and finally, thank the Michael W. Oglesby Foundation for their funding support of our work in chronic jetlag and pancreas pathology.
REFERENCES
- 1.Bass J, Lazar MA. Circadian time signatures of fitness and disease. Science 354: 994–999, 2016. doi: 10.1126/science.aah4965. [DOI] [PubMed] [Google Scholar]
- 2.McIntosh BE, Hogenesch JB, Bradfield CA. Mammalian Per-Arnt-Sim proteins in environmental adaptation. Annu Rev Physiol 72: 625–645, 2010. doi: 10.1146/annurev-physiol-021909-135922. [DOI] [PubMed] [Google Scholar]
- 3.Aryal RP, Kwak PB, Tamayo AG, Gebert M, Chiu P-L, Walz T, Weitz CJ. Macromolecular assemblies of the mammalian circadian clock. Mol Cell 67: 770–782.e6, 2017. doi: 10.1016/j.molcel.2017.07.017. [DOI] [PMC free article] [PubMed] [Google Scholar]
- 4.Pizarro A, Hayer K, Lahens NF, Hogenesch JB. CircaDB: a database of mammalian circadian gene expression profiles. Nucleic Acids Res 41: D1009–1013, 2013. doi: 10.1093/nar/gks1161. [DOI] [PMC free article] [PubMed] [Google Scholar]
- 5.Zhang R, Lahens NF, Ballance HI, Hughes ME, Hogenesch JB. A circadian gene expression atlas in mammals: implications for biology and medicine. Proc Natl Acad Sci USA 111: 16219–16224, 2014. doi: 10.1073/pnas.1408886111. [DOI] [PMC free article] [PubMed] [Google Scholar]
- 6.Marcheva B, Ramsey KM, Buhr ED, Kobayashi Y, Su H, Ko CH, Ivanova G, Omura C, Mo S, Vitaterna MH, Lopez JP, Philipson LH, Bradfield CA, Crosby SD, JeBailey L, Wang X, Takahashi JS, Bass J. Disruption of the clock components CLOCK and BMAL1 leads to hypoinsulinaemia and diabetes. Nature 466: 627–631, 2010. doi: 10.1038/nature09253. [DOI] [PMC free article] [PubMed] [Google Scholar]
- 7.Rakshit K, Qian J, Ernst J, Matveyenko AV. Circadian variation of the pancreatic islet transcriptome. Physiol Genomics 48: 677–687, 2016. doi: 10.1152/physiolgenomics.00019.2016. [DOI] [PMC free article] [PubMed] [Google Scholar]
- 8.Xu L, Wu T, Li H, Ni Y, Fu Z. An individual 12-h shift of the light-dark cycle alters the pancreatic and duodenal circadian rhythm and digestive function. Acta Biochim Biophys Sin (Shanghai) 49: 954–961, 2017. doi: 10.1093/abbs/gmx084. [DOI] [PubMed] [Google Scholar]
- 9.Mühlbauer E, Wolgast S, Finckh U, Peschke D, Peschke E. Indication of circadian oscillations in the rat pancreas. FEBS Lett 564: 91–96, 2004. doi: 10.1016/S0014-5793(04)00322-9. [DOI] [PubMed] [Google Scholar]
- 10.Maouyo D, Sarfati P, Guan D, Morisset J, Adelson JW. Circadian rhythm of exocrine pancreatic secretion in rats: major and minor cycles. Am J Physiol Gastrointest Liver Physiol 264: G792–G800, 1993. doi: 10.1152/ajpgi.1993.264.4.G792. [DOI] [PubMed] [Google Scholar]
- 11.Völkl A, Poort C. Circadian rhythm of protein synthesis activity in the exocrine pancreas of fed and starved rats. J Cell Sci 61: 467–473, 1983. doi: 10.1242/jcs.61.1.467. [DOI] [PubMed] [Google Scholar]
- 12.Li W, Liu L, Liu D, Jin S, Yang Y, Tang W, Gong L. Decreased circadian component Bmal1 predicts tumor progression and poor prognosis in human pancreatic ductal adenocarcinoma. Biochem Biophys Res Commun 472: 156–162, 2016. doi: 10.1016/j.bbrc.2016.02.087. [DOI] [PubMed] [Google Scholar]
- 13.Relles D, Sendecki J, Chipitsyna G, Hyslop T, Yeo CJ, Arafat HA. Circadian gene expression and clinicopathologic correlates in pancreatic cancer. J Gastrointest Surg 17: 443–450, 2013. doi: 10.1007/s11605-012-2112-2. [DOI] [PubMed] [Google Scholar]
- 14.Eastman CI, Gazda CJ, Burgess HJ, Crowley SJ, Fogg LF. Advancing circadian rhythms before eastward flight: a strategy to prevent or reduce jet lag. Sleep 28: 33–44, 2005. doi: 10.1093/sleep/28.1.33. [DOI] [PMC free article] [PubMed] [Google Scholar]
- 15.Kettner NM, Voicu H, Finegold MJ, Coarfa C, Sreekumar A, Putluri N, Katchy CA, Lee C, Moore DD, Fu L. Circadian homeostasis of liver metabolism suppresses hepatocarcinogenesis. Cancer Cell 30: 909–924, 2016. doi: 10.1016/j.ccell.2016.10.007. [DOI] [PMC free article] [PubMed] [Google Scholar]
- 16.Inokawa H, Umemura Y, Shimba A, Kawakami E, Koike N, Tsuchiya Y, Ohashi M, Minami Y, Cui G, Asahi T, Ono R, Sasawaki Y, Konishi E, Yoo S-H, Chen Z, Teramukai S, Ikuta K, Yagita K. Chronic circadian misalignment accelerates immune senescence and abbreviates lifespan in mice. Sci Rep 10: 2569, 2020. doi: 10.1038/s41598-020-59541-y. [DOI] [PMC free article] [PubMed] [Google Scholar]
- 17.Davidson A, Sellix M, Daniel J, Yamazaki S, Menaker M, Block G. Chronic jet-lag increases mortality in aged mice. Curr Biol 16: R914–R916, 2006. doi: 10.1016/j.cub.2006.09.058. [DOI] [PMC free article] [PubMed] [Google Scholar]
- 18.Dastgheib S, Irajie C, Assaei R, Koohpeima F, Mokarram P. Optimization of RNA extraction from rat pancreatic tissue. Iran J Med Sci 39: 282–288, 2014. [PMC free article] [PubMed] [Google Scholar]
- 19.Griffin M, Abu-El-Haija M, Abu-El-Haija M, Rokhlina T, Uc A. Simplified and versatile method for isolation of high-quality RNA from pancreas. BioTechniques 52: 332–334, 2012. doi: 10.2144/0000113862. [DOI] [PMC free article] [PubMed] [Google Scholar]
- 20.West AC, Smith L, Ray DW, Loudon ASI, Brown TM, Bechtold DA. Misalignment with the external light environment drives metabolic and cardiac dysfunction. Nat Commun 8: 417, 2017. doi: 10.1038/s41467-017-00462-2. [DOI] [PMC free article] [PubMed] [Google Scholar]
- 21.Hughes ME, Abruzzi KC, Allada R, Anafi R, Arpat AB, Asher G, et al. Guidelines for genome-scale analysis of biological rhythms. J Biol Rhythms 32: 380–393, 2017. doi: 10.1177/0748730417728663. [DOI] [PMC free article] [PubMed] [Google Scholar]
- 22.Jiang H, Lei R, Ding S-W, Zhu S. Skewer: a fast and accurate adapter trimmer for next-generation sequencing paired-end reads. BMC Bioinformatics 15: 182, 2014. doi: 10.1186/1471-2105-15-182. [DOI] [PMC free article] [PubMed] [Google Scholar]
- 23.Wu G, Anafi RC, Hughes ME, Kornacker K, Hogenesch JB. MetaCycle: an integrated R package to evaluate periodicity in large scale data. Bioinformatics 32: 3351–3353, 2016. doi: 10.1093/bioinformatics/btw405. [DOI] [PMC free article] [PubMed] [Google Scholar]
- 24.Parsons R, Parsons R, Garner N, Oster H, Rawashdeh O. CircaCompare: a method to estimate and statistically support differences in mesor, amplitude and phase, between circadian rhythms. Bioinformatics 36: 1208–1212, 2020. doi: 10.1093/bioinformatics/btz730. [DOI] [PubMed] [Google Scholar]
- 25.Thaben PF, Westermark PO. Differential rhythmicity: detecting altered rhythmicity in biological data. Bioinformatics 32: 2800–2808, 2016. doi: 10.1093/bioinformatics/btw309. [DOI] [PubMed] [Google Scholar]
- 26.Zhang R, Podtelezhnikov AA, Hogenesch JB, Anafi RC. Discovering biology in periodic data through Phase Set Enrichment Analysis (PSEA). J Biol Rhythms 31: 244–257, 2016. doi: 10.1177/0748730416631895. [DOI] [PubMed] [Google Scholar]
- 27.Reimand J, Isserlin R, Voisin V, Kucera M, Tannus-Lopes C, Rostamianfar A, Wadi L, Meyer M, Wong J, Xu C, Merico D, Bader GD. Pathway enrichment analysis and visualization of omics data using g:Profiler, GSEA, Cytoscape and enrichmentmap. Nat Protoc 14: 482–517, 2019. doi: 10.1038/s41596-018-0103-9. [DOI] [PMC free article] [PubMed] [Google Scholar]
- 28.Tenenbaum D. Bioconductor Package Maintainer. KEGGREST: Client-side REST access to the Kyoto Encyclopedia of Genes and Genomes (KEGG). 2020.
- 29.Robinson MD, McCarthy DJ, Smyth GK. edgeR: a Bioconductor package for differential expression analysis of digital gene expression data. Bioinformatics 26: 139–140, 2010. doi: 10.1093/bioinformatics/btp616. [DOI] [PMC free article] [PubMed] [Google Scholar]
- 30.Love MI, Huber W, Anders S. Moderated estimation of fold change and dispersion for RNA-seq data with DESeq2. Genome Biol 15: 550, 2014. doi: 10.1186/s13059-014-0550-8. [DOI] [PMC free article] [PubMed] [Google Scholar]
- 31.Jud C, Schmutz I, Hampp G, Oster H, Albrecht U. A guideline for analyzing circadian wheel-running behavior in rodents under different lighting conditions. Biol Proced Online 7: 101–116, 2005. doi: 10.1251/bpo109. [DOI] [PMC free article] [PubMed] [Google Scholar]
- 32.Aschoff J, Daan S, Groos GA. Vertebrate Circadian Systems: Structure and Physiology. Berlin, Germany: Springer Science & Business Media, 2012. [Google Scholar]
- 33.Nicolaides NC, Chrousos GP. Sex differences in circadian endocrine rhythms: clinical implications. Eur J Neurosci 52: 2575–2585, 2005. doi: 10.1111/ejn.14692. [DOI] [PubMed] [Google Scholar]
- 34.Schoenrock SA, Kumar P, Gómez-A A, Dickson PE, Kim S-M, Bailey L, Neira S, Riker KD, Farrington J, Gaines CH, Khan S, Wilcox TD, Roy TA, Leonardo MR, Olson AA, Gagnon LH, Philip VM, Valdar W, de Villena FP-M, Jentsch JD, Logan RW, McClung CA, Robinson DL, Chesler EJ, Tarantino LM. Characterization of genetically complex collaborative cross mouse strains that model divergent locomotor activating and reinforcing properties of cocaine. Psychopharmacology (Berl) ) 237: 979–996, 2020. doi: 10.1007/s00213-019-05429-3. [DOI] [PMC free article] [PubMed] [Google Scholar]
- 35.Greenwell BJ, Trott AJ, Beytebiere JR, Pao S, Bosley A, Beach E, Finegan P, Hernandez C, Menet JS. Rhythmic food intake drives rhythmic gene expression more potently than the hepatic circadian clock in mice. Cell Rep 27: 649–657.e5, 2019. doi: 10.1016/j.celrep.2019.03.064. [DOI] [PubMed] [Google Scholar]
- 36.Bittman EL. Entrainment is NOT synchronization: an important distinction and its implications. J Biol Rhythms 36: 196–199, 2021. doi: 10.1177/0748730420972817. [DOI] [PMC free article] [PubMed] [Google Scholar]
- 37.Yamazaki S, Numano R, Abe M, Hida A, Takahashi R, Ueda M, Block GD, Sakaki Y, Menaker M, Tei H. Resetting central and peripheral circadian oscillators in transgenic rats. Science 288: 682–685, 2000. doi: 10.1126/science.288.5466.682. [DOI] [PubMed] [Google Scholar]
- 38.Kiessling S, Eichele G, Oster H. Adrenal glucocorticoids have a key role in circadian resynchronization in a mouse model of jet lag. J Clin Invest 120: 2600–2609, 2010. doi: 10.1172/JCI41192. [DOI] [PMC free article] [PubMed] [Google Scholar]
- 39.Kornmann B, Schaad O, Bujard H, Takahashi JS, Schibler U. System-driven and oscillator-dependent circadian transcription in mice with a conditionally active liver clock. PLoS Biol 5: e34, 2007. doi: 10.1371/journal.pbio.0050034. [DOI] [PMC free article] [PubMed] [Google Scholar]
- 40.Roenneberg T, Allebrandt KV, Merrow M, Vetter C. Social jetlag and obesity. Curr Biol 22: 939–943, 2012. [Erratum in Curr Biol 23: 737, 2013]. doi: 10.1016/j.cub.2012.03.038. [DOI] [PubMed] [Google Scholar]
- 41.Parsons MJ, Moffitt TE, Gregory AM, Goldman-Mellor S, Nolan PM, Poulton R, Caspi A. Social jetlag, obesity and metabolic disorder: investigation in a cohort study. Int J Obes 39: 842–848, 2015.doi: 10.1038/ijo.2014.201. [DOI] [PMC free article] [PubMed] [Google Scholar]
- 42.Schernhammer ES, Laden F, Speizer FE, Willett WC, Hunter DJ, Kawachi I, Fuchs CS, Colditz GA. Night-shift work and risk of colorectal cancer in the nurses’ health study. J Natl Cancer Inst 95: 825–828, 2003.doi: 10.1093/jnci/95.11.825. [DOI] [PubMed] [Google Scholar]
- 43.Asahara S, Etoh H, Inoue H, Teruyama K, Shibutani Y, Ihara Y, Kawada Y, Bartolome A, Hashimoto N, Matsuda T, Koyanagi-Kimura M, Kanno A, Hirota Y, Hosooka T, Nagashima K, Nishimura W, Inoue H, Matsumoto M, Higgins MJ, Yasuda K, Inagaki N, Seino S, Kasuga M, Kido Y. Paternal allelic mutation at the Kcnq1 locus reduces pancreatic β-cell mass by epigenetic modification of Cdkn1c. Proc Natl Acad Sci USA 112: 8332–8337, 2015. doi: 10.1073/pnas.1422104112. [DOI] [PMC free article] [PubMed] [Google Scholar]
- 44.Peek CB, Affinati AH, Ramsey KM, Kuo H-Y, Yu W, Sena LA, Ilkayeva O, Marcheva B, Kobayashi Y, Omura C, Levine DC, Bacsik DJ, Gius D, Newgard CB, Goetzman E, Chandel NS, Denu JM, Mrksich M, Bass J. Circadian clock NAD+ cycle drives mitochondrial oxidative metabolism in mice. Science 342: 1243417, 2013. doi: 10.1126/science.1243417. [DOI] [PMC free article] [PubMed] [Google Scholar]
- 45.Peek CB, Levine DC, Cedernaes J, Taguchi A, Kobayashi Y, Tsai SJ, Bonar NA, McNulty MR, Ramsey KM, Bass J. Circadian clock interaction with HIF1α mediates oxygenic metabolism and anaerobic glycolysis in skeletal muscle. Cell Metab 25: 86–92, 2017. doi: 10.1016/j.cmet.2016.09.010. [DOI] [PMC free article] [PubMed] [Google Scholar]
- 46.Aschoff J, Hoffmann K, Pohl H, Wever R. Re-entrainment of circadian rhythms after phase-shifts of the Zeitgeber. Chronobiologia 2: 23–78, 1975. [PubMed] [Google Scholar]
- 47.Reddy AB, Field MD, Maywood ES, Hastings MH. Differential resynchronisation of circadian clock gene expression within the suprachiasmatic nuclei of mice subjected to experimental jet lag. J Neurosci 22: 7326–7330, 2002. doi: 10.1523/JNEUROSCI.22-17-07326.2002. [DOI] [PMC free article] [PubMed] [Google Scholar]
- 48.Saderi N, Báez-Ruiz A, Azuara-Álvarez LE, Escobar C, Salgado-Delgado RC. Differential recovery speed of activity and metabolic rhythms in rats after an experimental protocol of shift-work. J Biol Rhythms 34: 154–166, 2019. doi: 10.1177/0748730419828534. [DOI] [PubMed] [Google Scholar]
- 49.Leloup J-C, Goldbeter A. Critical phase shifts slow down circadian clock recovery: implications for jet lag. J Theor Biol 333: 47–57, 2013. doi: 10.1016/j.jtbi.2013.04.039. [DOI] [PubMed] [Google Scholar]


