

Abstract
Nuclear compartments are thought to play a role in 3-dimensional (3D) genome organization and gene expression. In mammalian brain, the architecture and dynamics of nuclear compartment-associated genome organization is not known. Here we develop Genome Organization using CUT and RUN Technology (GO-CaRT) to map genomic interactions with two nuclear compartments – the nuclear lamina and nuclear speckles – from different regions of the developing mouse, macaque and human brain. Lamina-associated domain (LAD) architecture in cells in vivo is distinct from that of cultured cells, including major differences in LADs previously considered cell-type invariant. In the mouse and human forebrain, dorsal and ventral neural precursor cells (NPCs) have differences in LAD architecture that correspond to their regional identity. LADs in the human and mouse cortex contain transcriptionally highly active sub-domains characterized by broad depletion of histone-3-lysine-9 di-methylation (H3K9me2). Evolutionarily conserved LADs in human, macaque and mouse brain are enriched for transcriptionally active neural genes associated with synapse function. By integrating GO-CaRT maps with genome-wide association study (GWAS) data, we find speckle-associated domains (SPADs) to be enriched for schizophrenia risk loci, indicating a physical relationship between these disease-associated genetic variants and a specific nuclear structure. Our work lays a framework for understanding the relationship between distinct nuclear compartments and genome function in brain development and disease.
Introduction
The spatial organization of the genome relative to distinct nuclear compartments is crucial for regulating the mammalian genome in development and disease1,2. Lamina-associated domains (LADs) are variably sized genomic regions (10KB to 1MB) that interact with the nuclear lamina, which is the meshwork of proteins underneath the nuclear membrane that generally forms a transcriptionally repressive compartment3. In contrast, speckle-associated domains (SPADs) are transcriptionally active genomic regions that interact with nuclear speckles, a non-membranous nuclear body with roles in transcription and mRNA splicing4,5.
In cell culture studies, the re-organization of spatial genome organization correlates with lineage-specific gene expression changes during cellular differentiation6–8. For example, the differentiation of mouse embryonic stem cells (mESCs) into the neural lineage is accompanied by repositioning of pluripotency genes to the nuclear lamina, whereas neural genes are detached from the nuclear lamina and move towards the nuclear interior6. Similar repositioning of lineage-specific genes relative to the nuclear lamina has also been observed in in vitro models of cardiac development and myogenesis7,8.
Although these studies indicate an important role of genome organization in cell fate specification, it has been difficult to study nuclear compartment-associated genome organization in the developing brain due to technical limitations. LADs have been primarily mapped using DNA adenine methyltransferase identification (DamID)6,9,10. Tyramide signal amplification-sequencing (TSA-seq) enabled the first genome-wide view of SPADs in human K562 cells4. The need to express a fusion protein for DamID and the requirement of hundreds of millions of cells for TSA-seq have precluded their application to the study of spatial genome organization and dynamics in vivo, such as that occurring in human brain development.
In this study, we developed Genome Organization using CUT and RUN Technology (GO-CaRT) to profile LADs and SPADs in cells directly isolated from the developing mammalian brain. Using GO-CaRT in mouse brain, lung and liver, we found that many previously annotated cell-type invariant constitutive LADs (cLADs)6 are not observed in vivo. By profiling LADs in neural precursor cells (NPCs) isolated from the dorsal and ventral mouse and human forebrain, we identified brain region-specific LADs which correlated with regional differences in gene expression. Although LADs are generally heterochromatic, our analysis of LADs in mouse and human brain identified transcriptionally highly active LAD sub-domains (‘escaper domains’) that were characterized by broad depletion of histone-3-lysine-9 di-methylation (H3K9me2). Comparative analysis of LAD profiles from mouse, human and macaque brain identified conserved genome-lamina interactions across these three species, and these conserved LADs were enriched for transcriptionally active genes involved in synapse function. Finally, profiling of SPADs and LADs in the human cortex allowed spatial mapping of genetic risk loci identified by genome-wide association studies (GWAS) revealing SPADs to be enriched for genetic risk loci for schizophrenia. This study provides key insights into the spatial organization of the genome in the developing brain and lays a foundation for understanding the relationship between nuclear compartments and genome function.
Results
GO-CaRT enables LAD mapping in the mammalian brain
GO-CaRT is an adaptation of CUT&RUN11 for the mapping of large genomic interactions with nuclear compartments that are defined by specific antibody interactions. Besides the use of antibodies that target nuclear compartments, GO-CaRT uses a new nuclei isolation method that works better with cells isolated acutely from tissues in vivo including the human brain. The use of GO-CaRT terminology is to emphasize the special application of CUT&RUN for mapping of genomic interactions with nuclear compartments rather than with transcription factors and histone modifications.
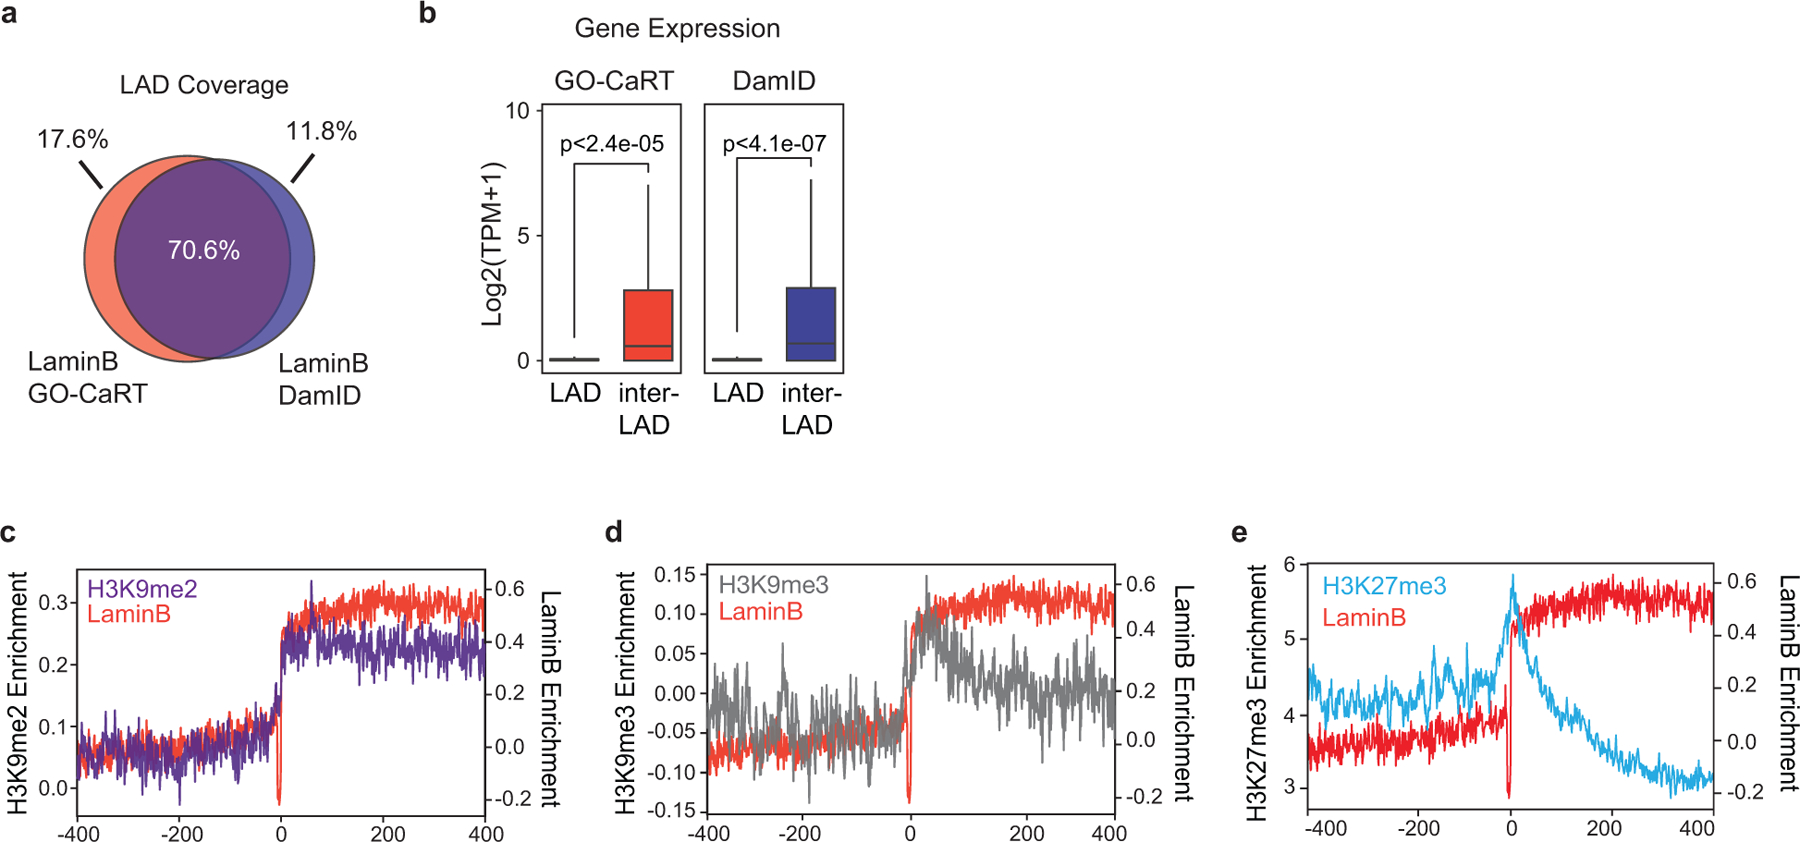
For mapping LADs, we used a LaminB1 antibody to tether protein A micrococcal nuclease (pA-MNase) to the nuclear lamina and identified the pA-MNase cleaved DNA fragments with paired end sequencing (LaminB GO-CaRT, Fig. 1a). We validated LaminB GO-CaRT by profiling LADs in mouse embryonic fibroblasts (MEFs) that have been previously mapped by LaminB DamID6. Similar to DamID, ~40% of the genome in MEFs was lamina-associated. LaminB enrichment, LADs and gene expression were highly similar between GO-CaRT and DamID (Fig. 1b, 1c, Extended Data Fig. 1a–b). GO-CaRT LADs were highly enriched in H3K9me2 along with moderate levels of histone-3-lysine-9 tri-methylation (H3K9me3), while histone-3-lysine-27 tri-methylation (H3K27me3) was markedly pronounced at LAD borders and low within LADs (Extended Data Fig. 1c–e), consistent with the proposed roles of H3K9me2 and H3K27me3 in LAD tethering and confinement, respectively9,12,13.
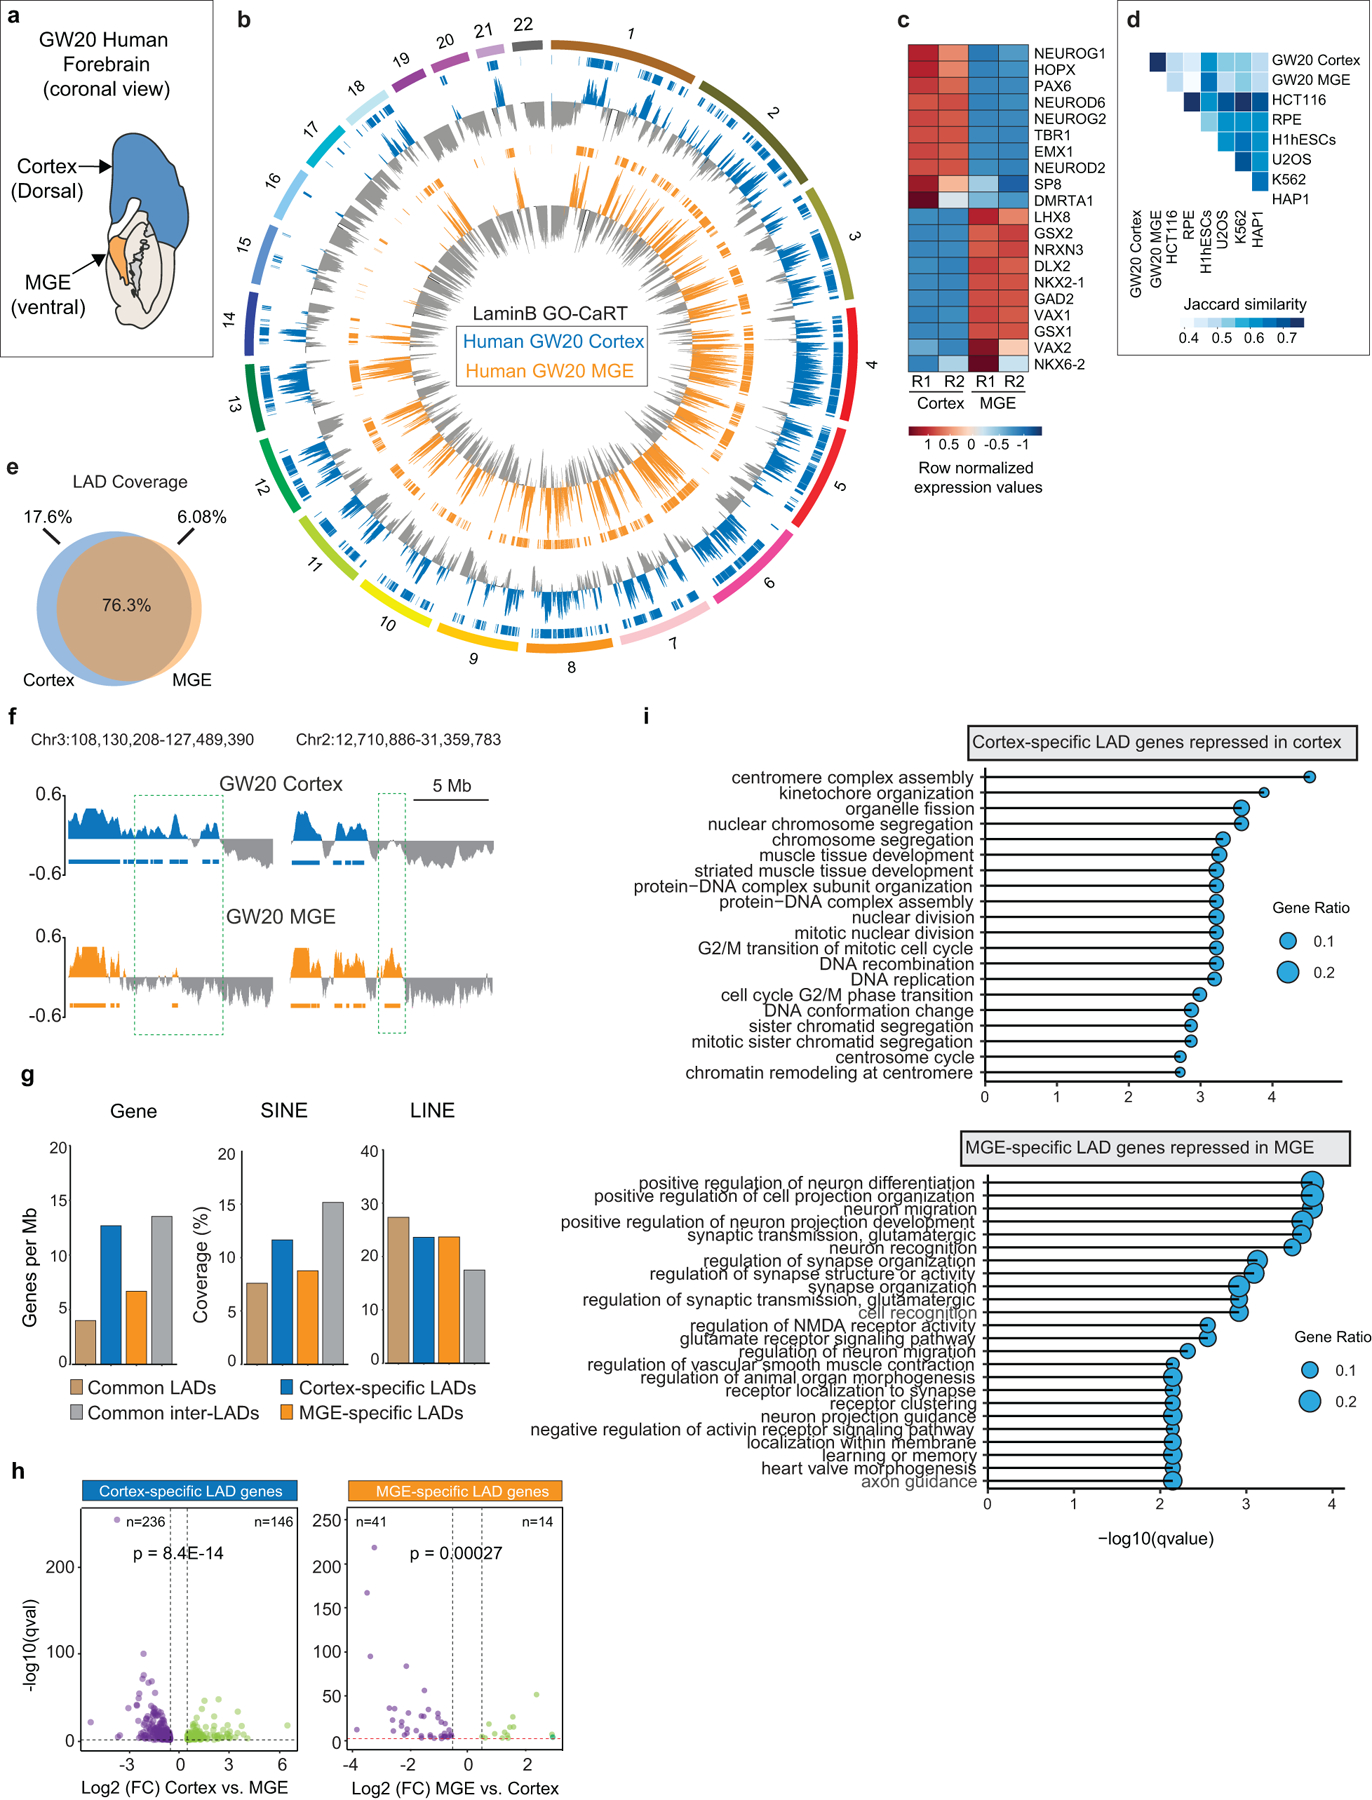
Figure 1 |. GO-CaRT enables mapping of genome-lamina interactions in mammalian brain.
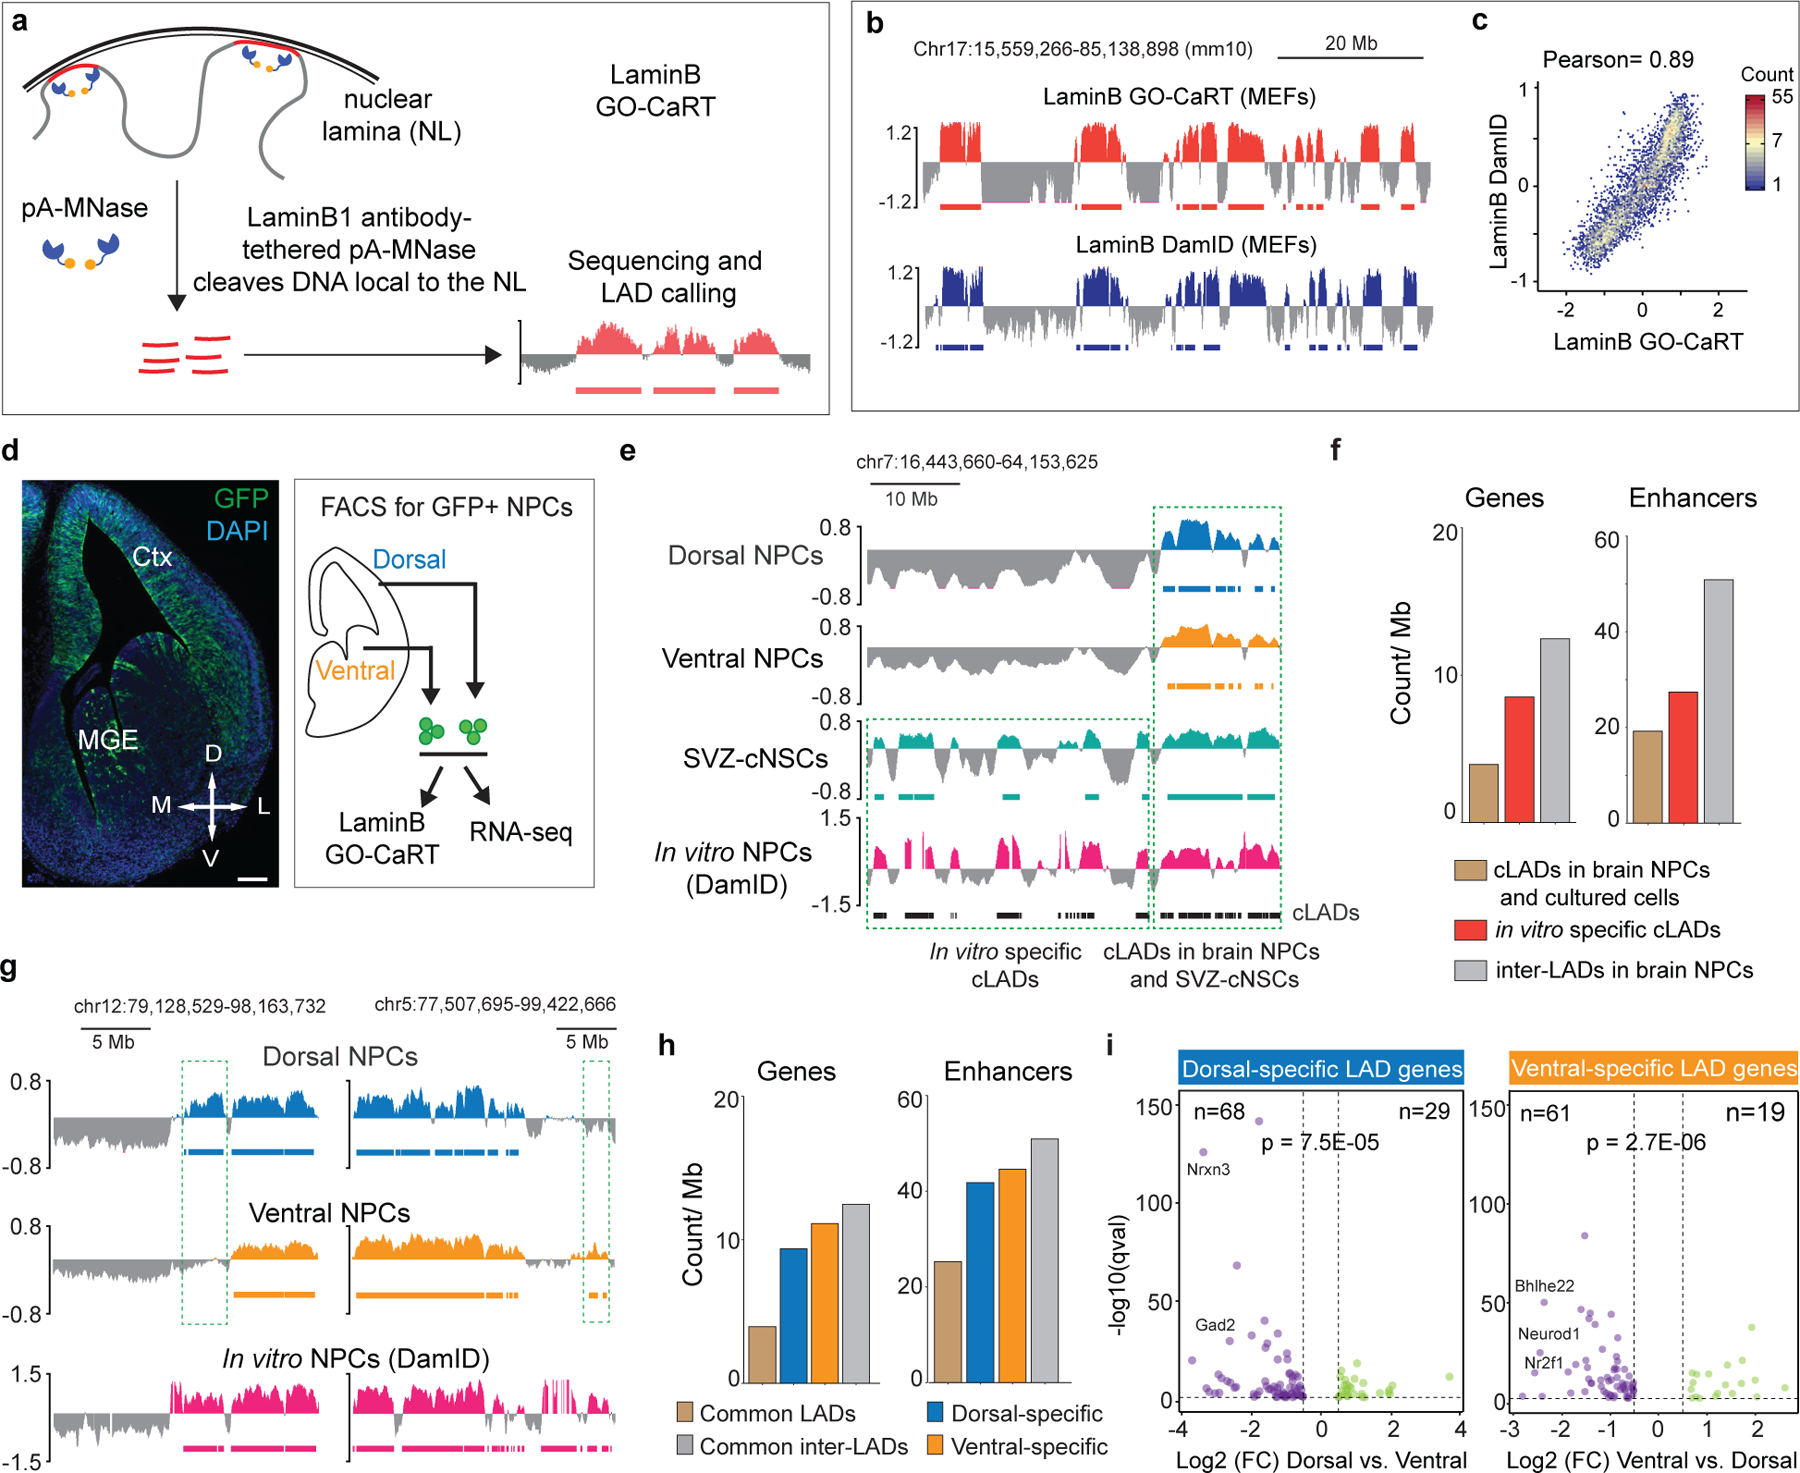
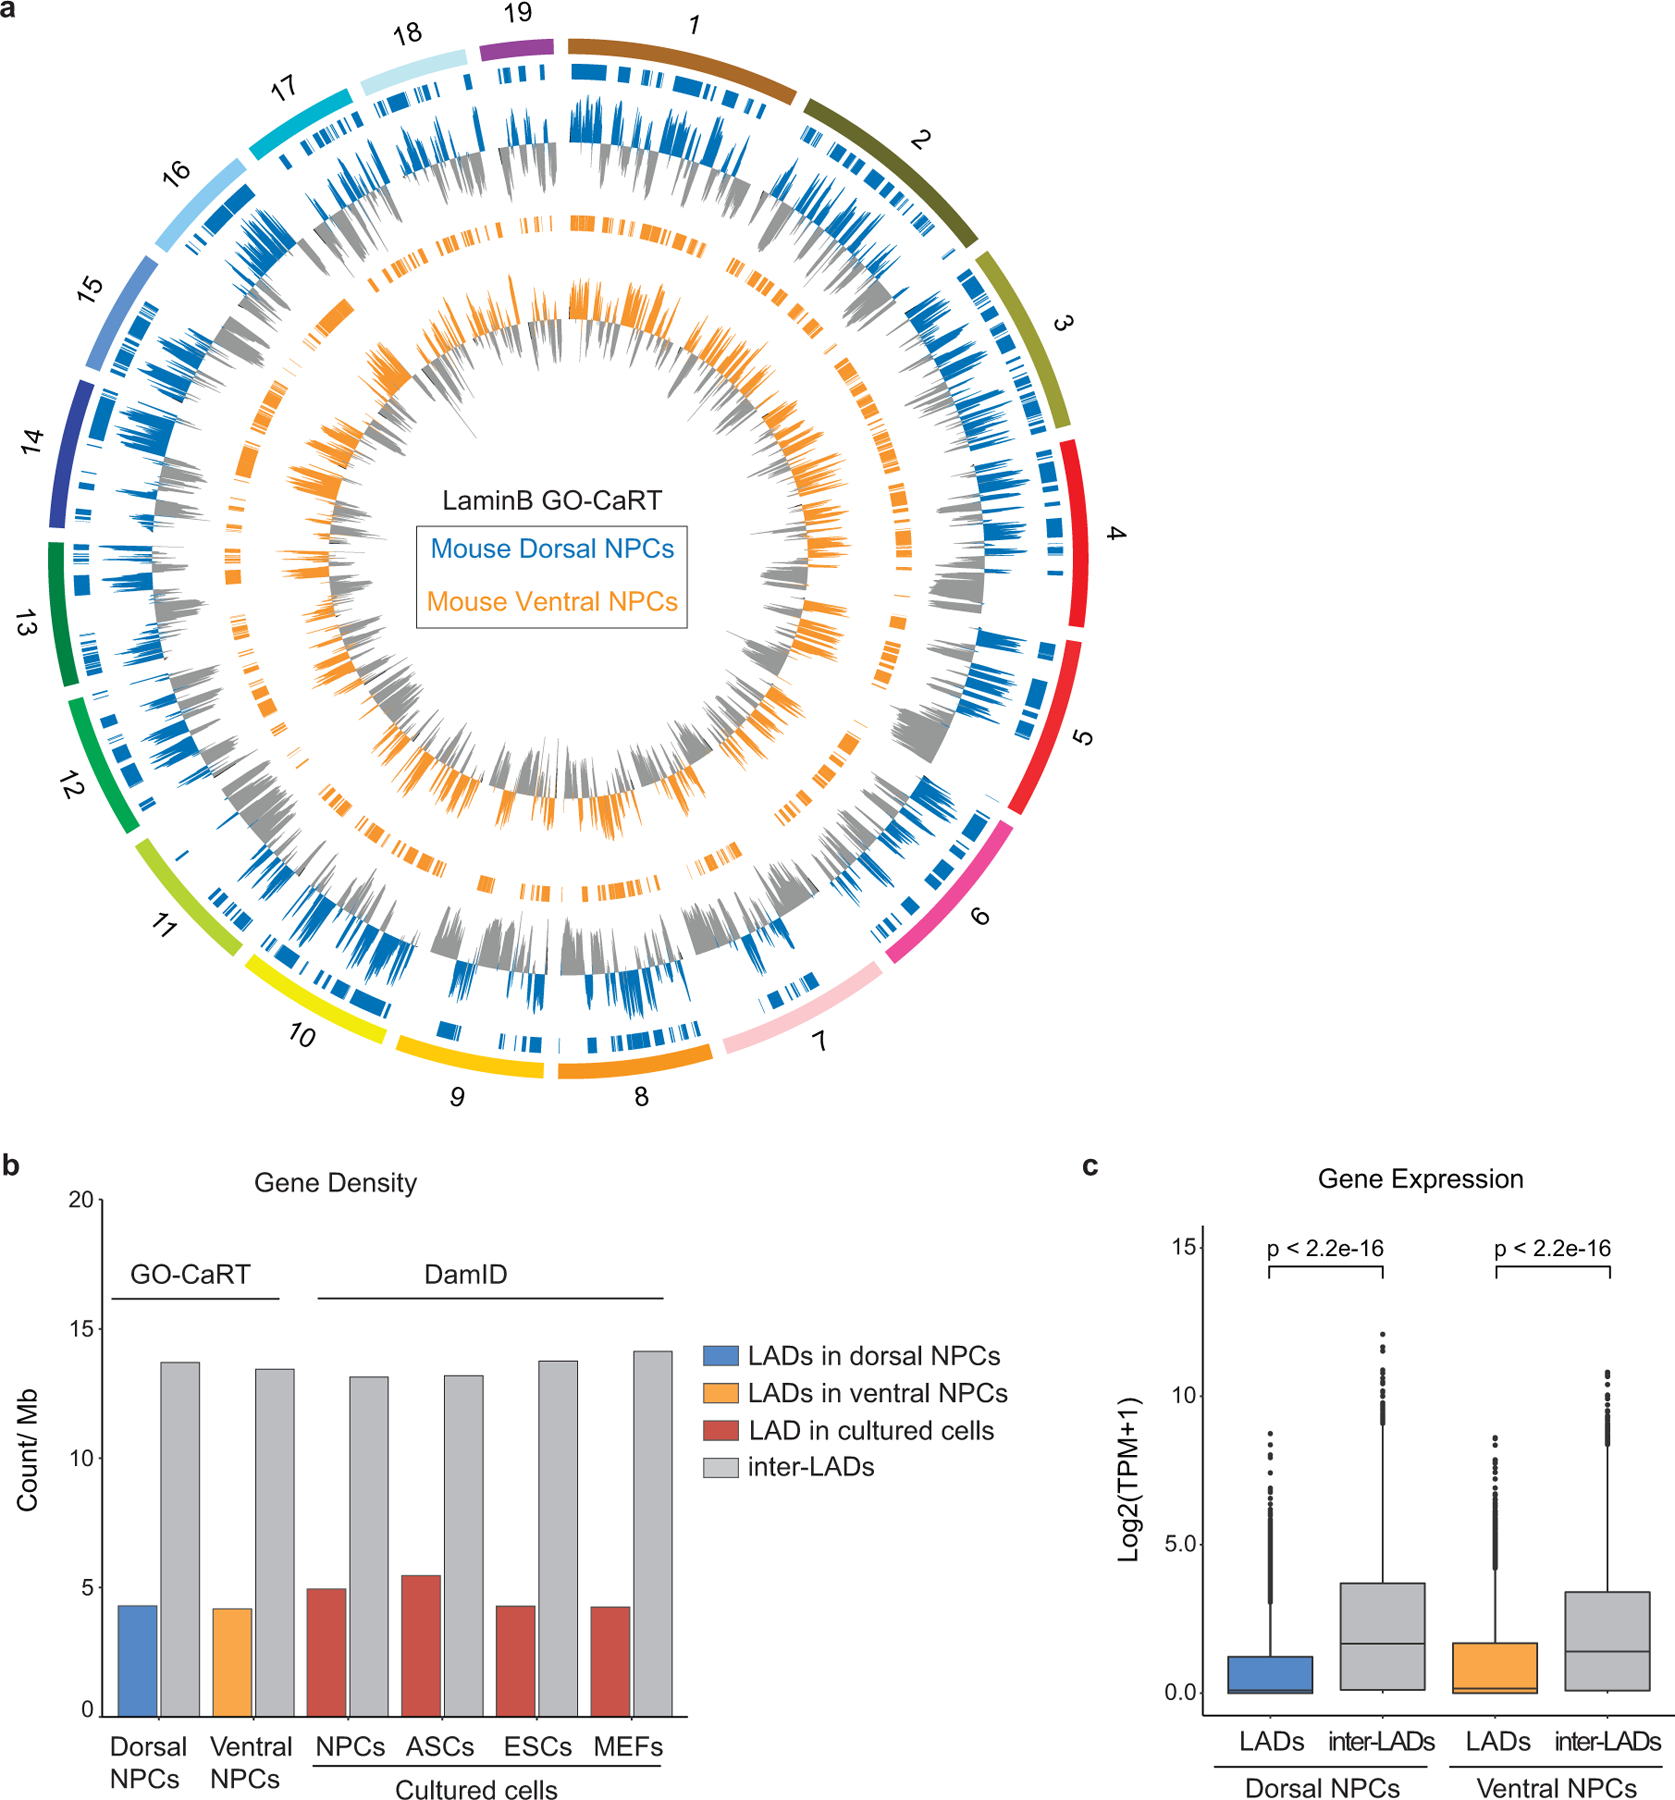
a, Schematic of LaminB GO-CaRT, wherein pA-MNase is recruited to the nuclear lamina (NL) by a LaminB1 antibody resulting in cleavage of NL proximal DNA, followed by DNA extraction, sequencing and LAD calling. b, Representative LaminB interaction profiles generated by LaminB GO-CaRT and LaminB DamID6 in 3T3 MEFs. Y-axis depict log2 ratio of LaminB over IgG (LaminB GO-CaRT) or LaminB-Dam over Dam only (DamID). LADs are depicted below traces by solid horizontal bars. c, Genome-wide scatter plot showing Pearson correlation between LaminB GO-CaRT and LaminB DamID in 3T3 MEFs. d, Coronal section of E13 mouse brain from Nes-TK-GFP mice and FACS isolation of GFP+ Nestin- (a neural stem cell marker) expressing NPCs (green) from the dorsal and ventral forebrain for LaminB GO-CaRT and RNA-seq. Ctx- Cortex; MGE- Median ganglionic eminence; Scale bar 100 μm. Similar staining was observed from two E13 brains. e, Representative LaminB GO-CaRT profiles of dorsal and ventral brain NPCs, SVZ-cNSCs and LaminB-DamID profile of in vitro NPCs (ESC-derived NPCs)6. Dashed box shows a region where some previously annotated “cLADs”6 (black horizontal bars) were not observed in brain NPCs but were detected in SVZ-cNSCs by LaminB GO-CaRT. f, Gene and enhancer density of in vitro specific cLADs, cLADs that were observed in both brain NPCs and cultured cells and inter-LADs in brain NPCs. g, Representative LaminB GO-CaRT profiles of dorsal and ventral NPCs. Dashed boxes show brain region-specific LADs. h, Gene and enhancer density in brain region-specific LADs, common LADs and inter-LADs. i, Volcano plot showing differentially expressed genes in mouse dorsal and ventral-specific LADs. Each dot represents a single gene with its differential gene expression level plotted on the x-axis and statistical significance (q-value <0.5) on y-axis. Some dorsally and ventrally important genes are indicated. p= Chi-square goodness of fit test.
We next performed LaminB GO-CaRT on NPCs (~100,000) purified by fluorescence activated cell sorting (FACS) from dorsal and ventral regions of the mouse embryonic day 13 (E13) brain of Nes-Tk-GFP mice14 (Fig. 1d, Extended Data Fig. 2a). In NPCs isolated from both dorsal and ventral forebrain, ~35% of the genome mapped to LADs, which exhibited expected genomic characteristics including lower gene density and expression (Extended Data Fig. 2b, c). Thus, LaminB GO-CaRT provides an easy workflow for LAD mapping from reduced numbers of unfixed cells including those freshly isolated from the brain.
In vivo and in vitro differences in LAD architecture
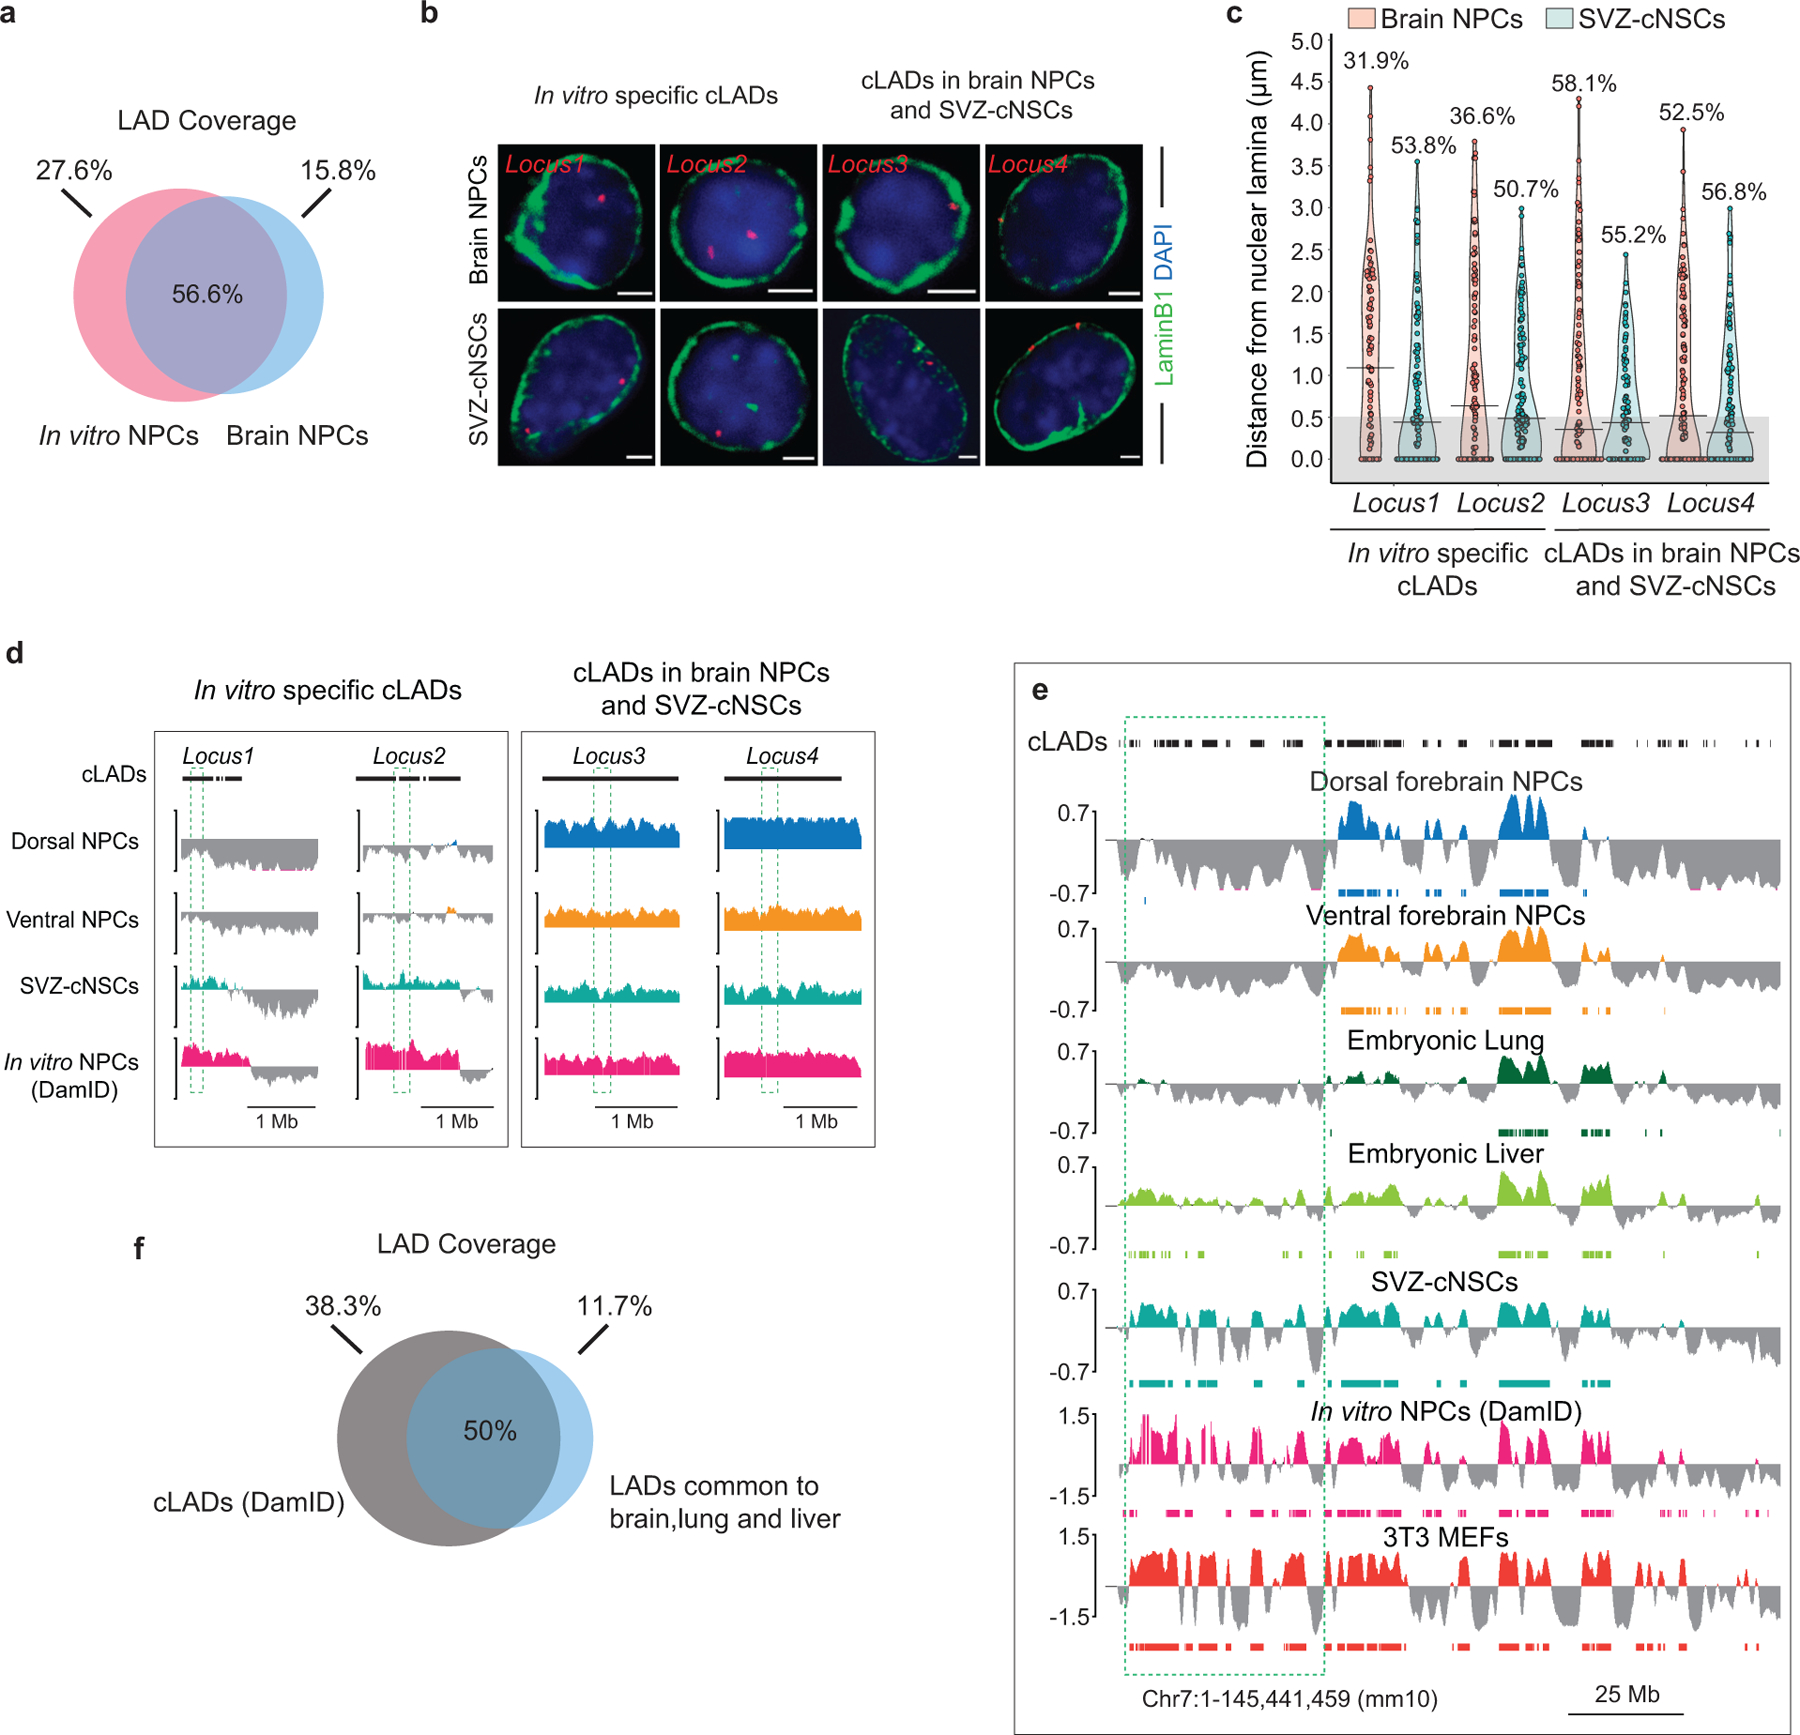
Previous studies have identified LADs in NPCs that are generated in vitro from mouse ESCs (in vitro NPCs)6. We compared LAD profiles of brain NPCs with those of in vitro NPCs and found 57% overlap (Extended Data Fig. 3a). Interestingly, among the LADs that were in vitro NPC-specific (not observed in brain NPCs but detected in cultured neural stem cells from subventricular zone-SVZ-cNSCs), ~56% were previously annotated as cell type-invariant constitutive LADs (cLADs) (Fig. 1e). In vitro specific cLADs exhibited features of facultative LADs, such as higher gene and enhancer density (Fig. 1f). DNA fluorescent in situ hybridization (DNA-FISH) with LaminB1 immunocytochemistry (ICC) in brain NPCs and SVZ-cNSCs validated differences between LADs observed in vivo and in vitro (Extended Data Fig. 3b–d). We also performed LaminB GO-CaRT in E13 lung and liver and observed that ~38% of cLADs previously mapped in cultured cells are not LADs common to brain, lung and liver (Extended Data Fig. 3e, f). Of note, 77% of cLADs were also reported to be located away from the nuclear lamina in mouse 2-cell stage embryo15. Thus, the overall LAD architecture of cells in brain NPCs and other in vivo tissues is distinct from that of cells grown in culture, suggesting that a subset of LADs reflects the conditions of growth in vitro.
Region-specific NPCs have differences in LAD architecture
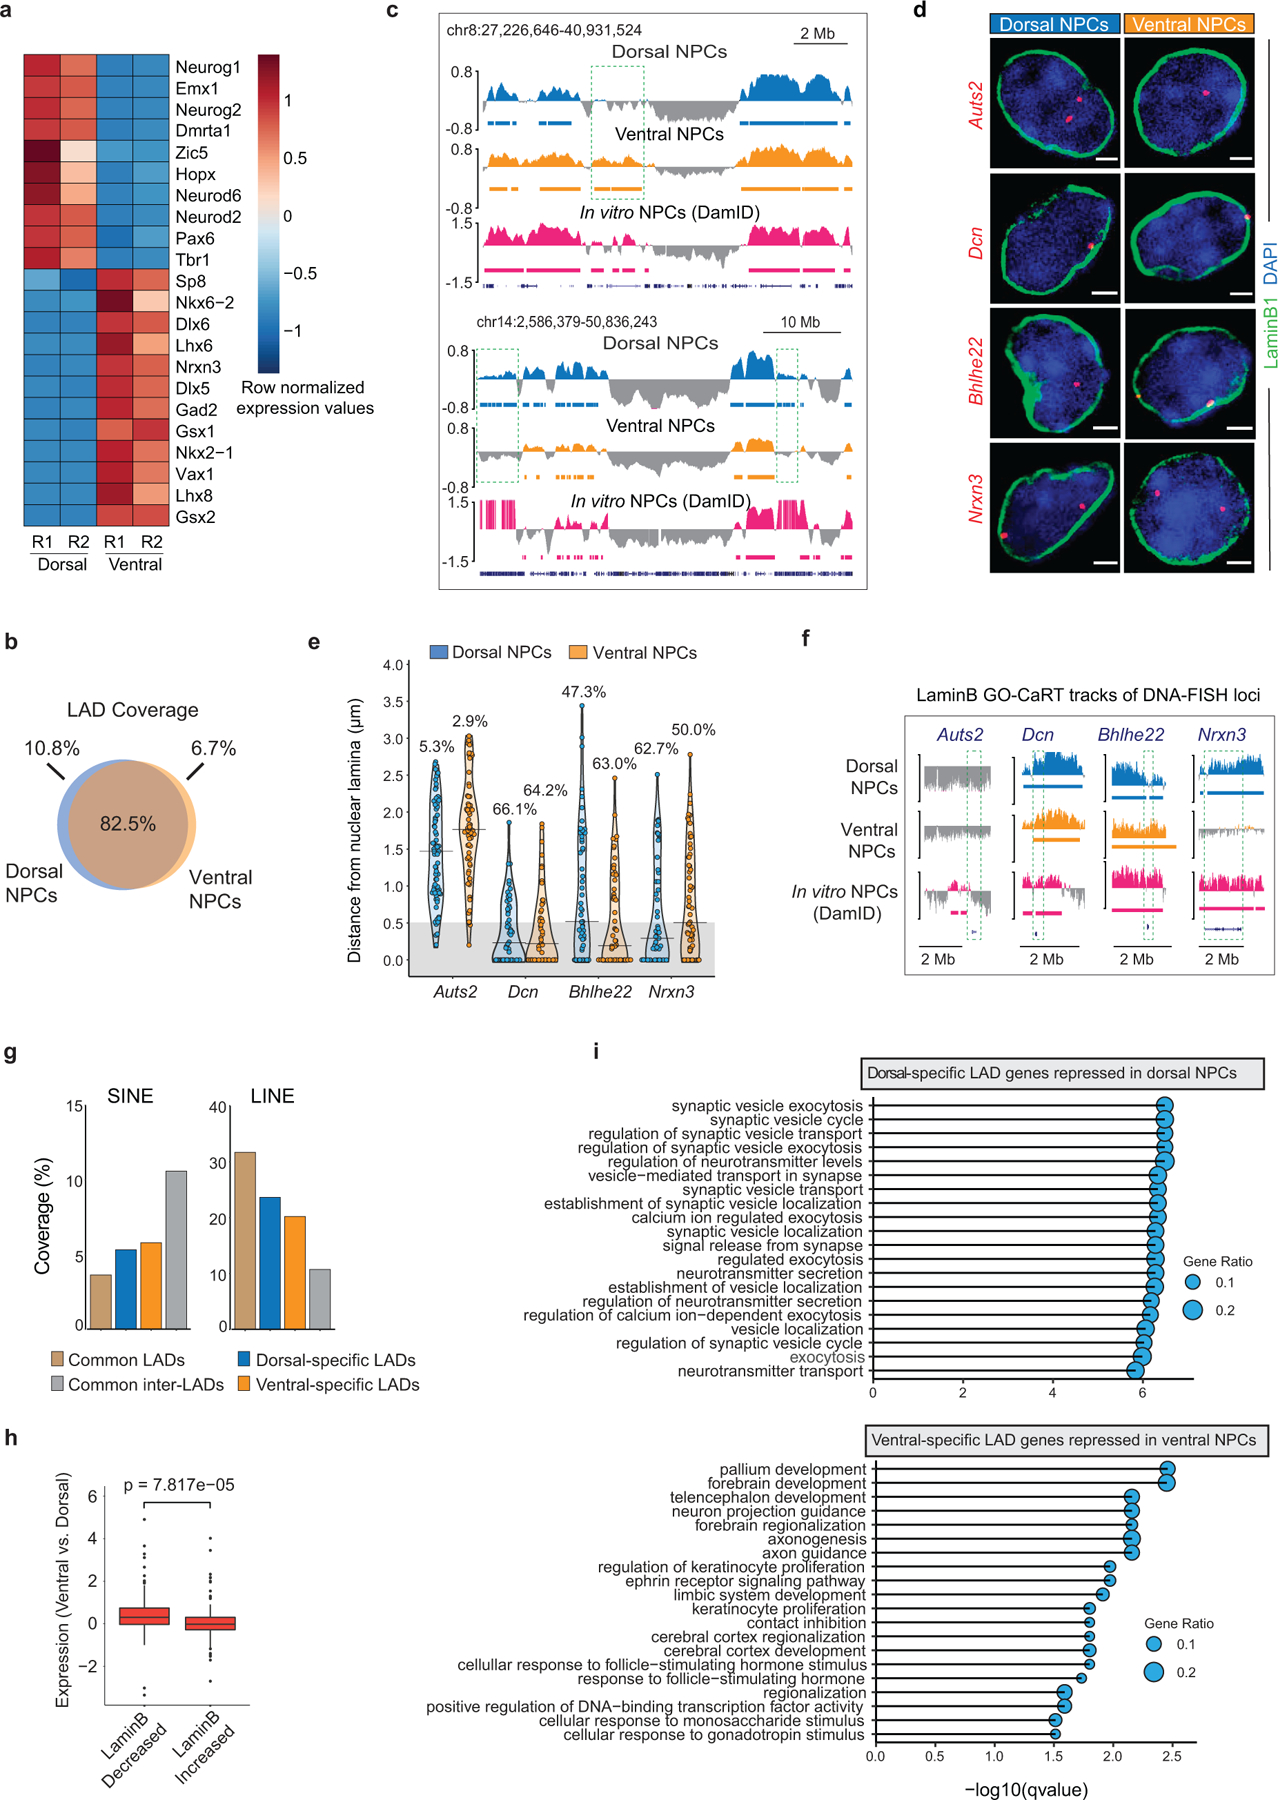
During embryonic brain development, cortical projection neurons are born locally from NPCs in the dorsal brain (cortex), whereas cortical interneurons arise from NPCs in ventral regions (medial ganglionic eminence, MGE)16,17. Region-specific differences in NPC gene expression underlie their developmental potential18 and were observed by RNA-seq of ventral and dorsal NPCs isolated from the E13 mouse brain (Extended Data Fig. 4a).
While ~82% of LAD coverage was shared between dorsal and ventral NPCs, ~11% of dorsal and ~7% of ventral LADs were brain region-specific (Fig. 1g, Extended Data Fig. 4b, c). DNA-FISH with LaminB ICC validated peripheral versus central nuclear localization of genes (n=3) in dorsal and ventral mouse brain cells as was observed by LaminB GO-CaRT (Extended Data Fig. 4d–f). As compared to LADs common to dorsal and ventral NPCs, brain region-specific LADs had features typical of facultative LADs, which include higher density of genes, enhancers, short interspersed nuclear elements (SINE) and lower density of long interspersed nuclear elements (LINE) (Fig. 1h, Extended Data Fig. 4g). Region-specific differences in LAD architecture correlated significantly (dorsal p= 7.5E-05, ventral p= 2.7E-06, Chi square goodness of fit test) with differential gene expression between ventral and dorsal NPCs (Fig. 1i). Differential expression was also observed for genes that exhibited quantitative differences in LaminB enrichment without necessarily a change in LAD status (Extended Data Fig. 4h). As a group, differentially expressed genes in region-specific LADs were enriched in multiple gene ontology (GO) terms related to forebrain development and regionalization (Extended Data Fig. 4i) and included important dorsal (Bhlhe22, Neurod1, Nr2f1) and ventral (Nrxn3, Gad2) genes (Fig. 1i). Thus, variation in genome-lamina interactions relate to the regional identity of mouse NPCs.
To examine if the developing human forebrain also exhibits regional differences in LAD architecture, we profiled LADs in cortex and MGE at gestational week 20 (GW20) (Extended Data Fig. 5a, b). RNA-seq performed on the same samples revealed differential expression that corresponded to each anatomical region (Extended Data Fig. 5c). In cortex and MGE, ~33% and 29% of the genome mapped to LADs, respectively, which showed moderate similarity (Jaccard index= 0.43–0.63) to LADs mapped by DamID in cultured human cell lines19 (Extended Data Fig. 5d). Importantly, we observed differences in LADs between cortex and MGE (~17% cortex-specific and 6% MGE-specific, Extended Data Fig. 5e, f), and these region-specific LADs exhibited features of facultative LADs (Extended Data Fig. 5g), as was observed in the mouse. Gene location in region-specific LADs correlated significantly (cortex p= 8.4E-14; MGE p= 0.00027, Chi square goodness of fit test) with differential expression between cortex and MGE (Extended Data Fig. 5h). Genes in cortex-specific LADs were enriched in GO-terms related to cell division and cell proliferation whereas those in MGE-specific LADs associated with neuronal differentiation and neural development (Extended Data Fig. 5i). Thus, in both the developing human and mouse brain, differences in LAD architecture relate to the regional identity of NPCs.
LADs contain transcriptionally active sub-domains
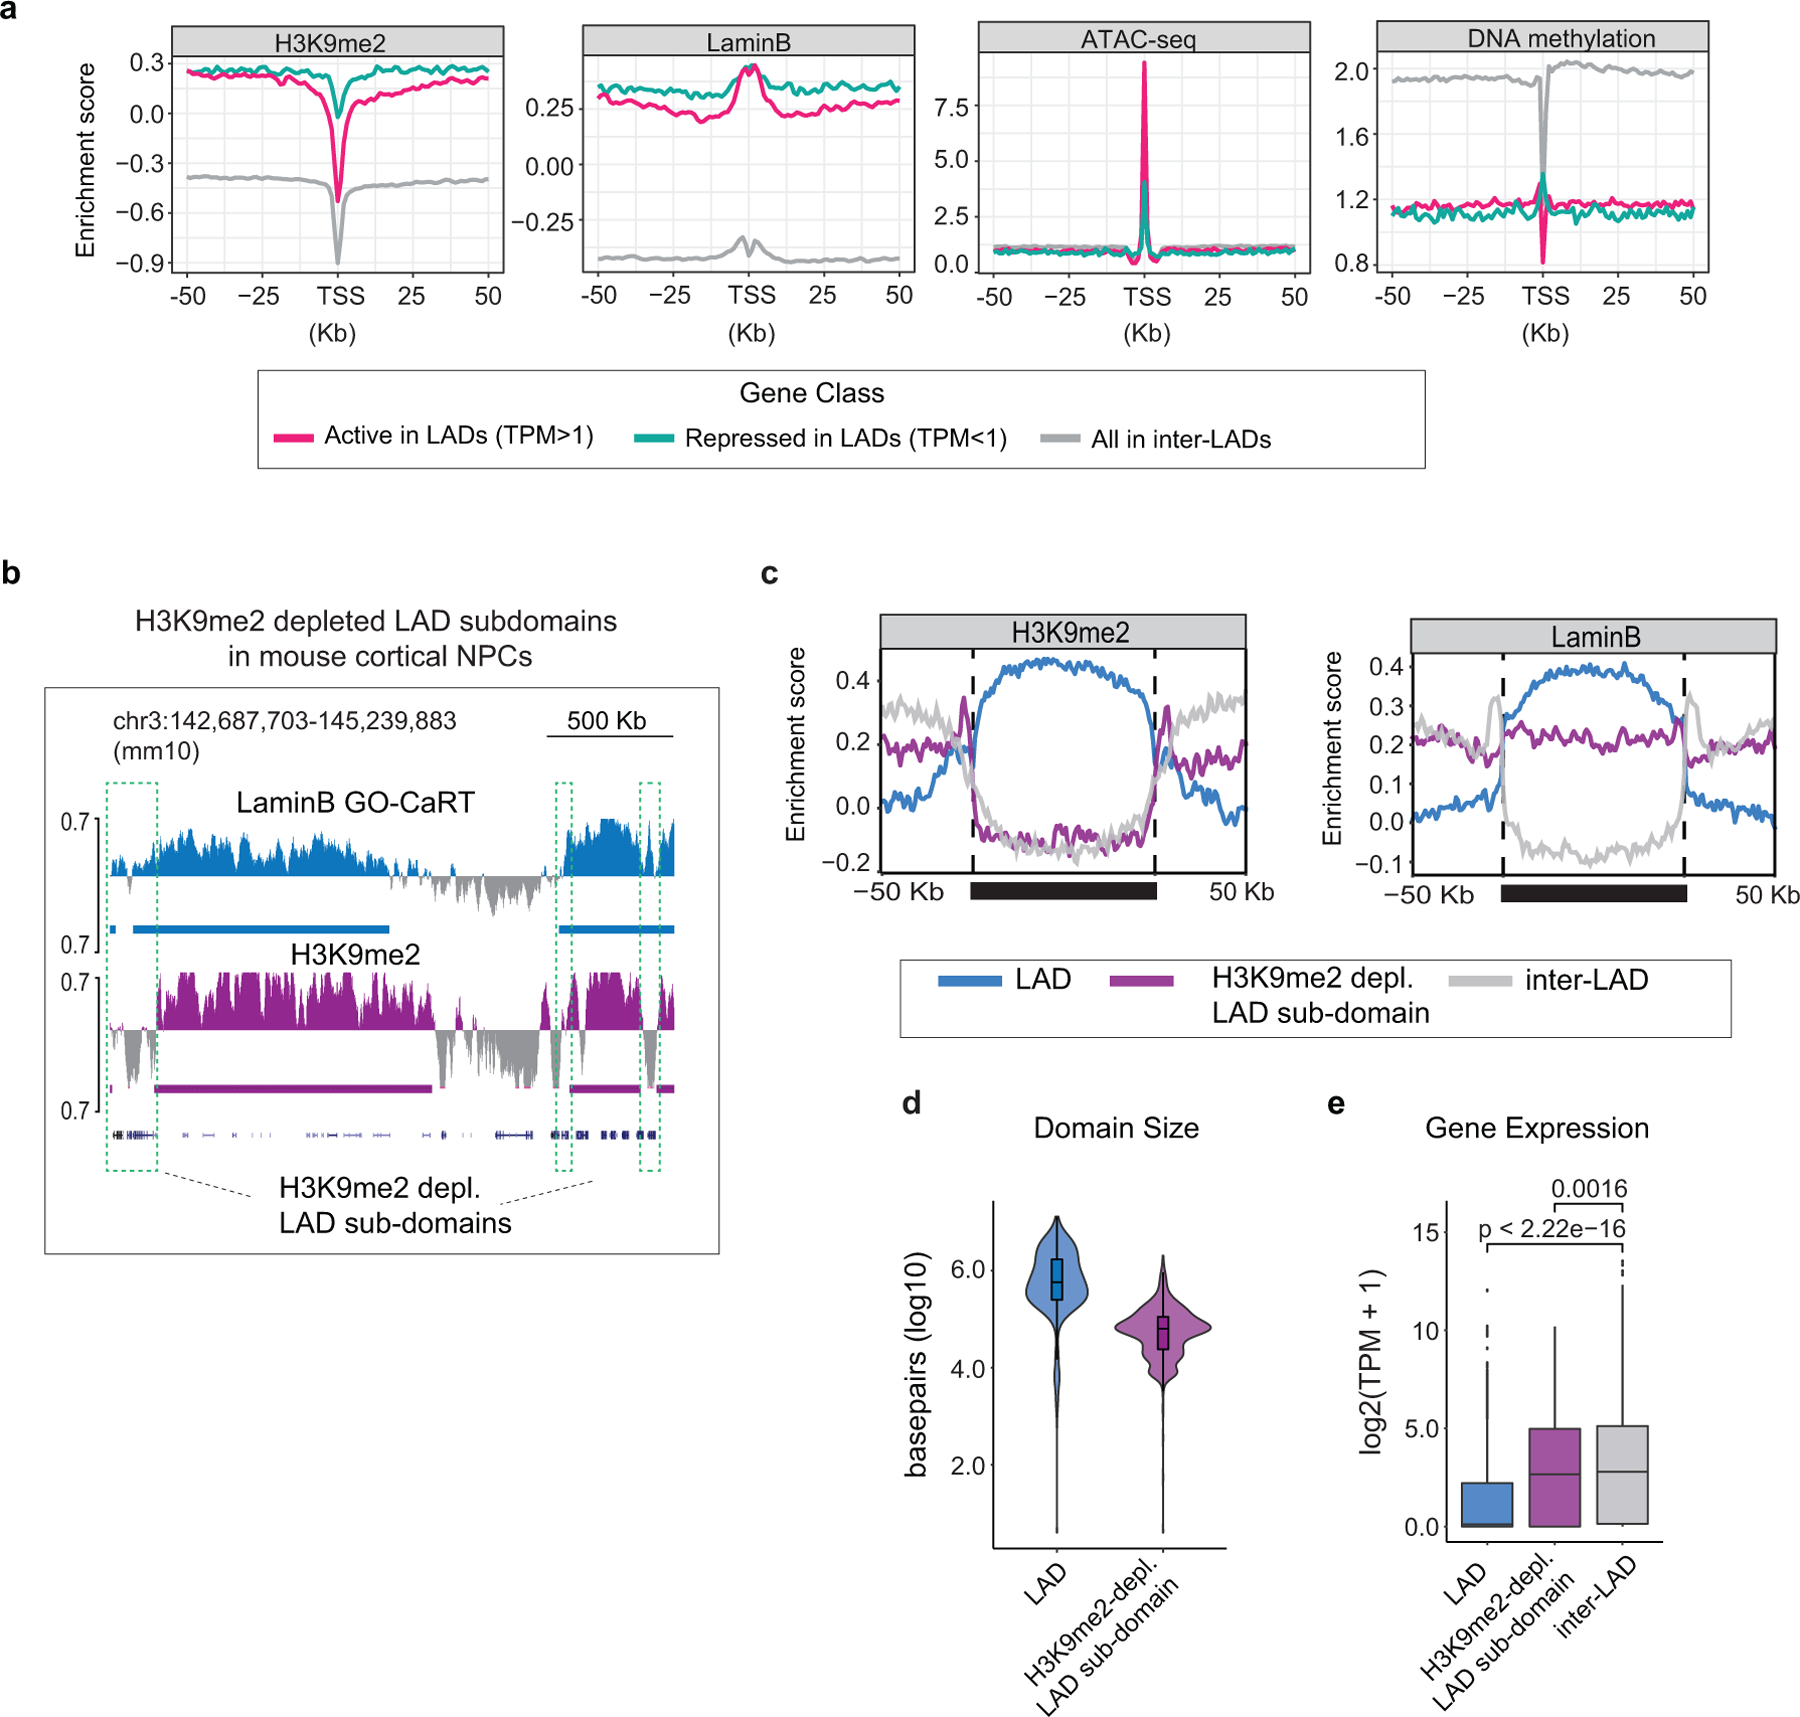
In cultured cells, approximately 10% of genes within LADs are expressed9,13. Transcription of a subset of such LAD “escaper” genes has been correlated with variation in local chromatin features including a focal depletion of LaminB and H3K9me2/3 around promoter regions13,20. In the developing human cortex, ~17% of genes embedded in LADs were expressed, and these exhibited local (around promoter region) depletion of H3K9me2, DNA hypomethylation and increased chromatin accessibility without significant difference in LaminB levels between active and repressed LAD genes. (Extended Data Fig. 6a). Interestingly, ~25% of the expressed LAD genes (n=614) had their transcriptional start site (TSS) located in LAD sub-domains that exhibited broad depletion of H3K9me2 and a moderate decrease in LaminB (Fig. 2a). H3K9me2-depleted LAD sub-domains in human cortex comprised ~5% of LAD coverage with size ranging up to several hundred kilobases (Fig. 2b). In cultured cells, LAD escaper genes are expressed at levels ~5-fold lower than genes located in inter-LAD regions20. In contrast, genes within H3K9me2-depleted LAD sub-domains in the human cortex were expressed at levels comparable to those in the inter-LADs (Fig. 2c). To more directly assess histone modifications within LADs, we performed chromatin immunoprecipitation-sequencing (ChIP-seq) analysis with H3K9me2 antibodies on the chromatin released by LaminB GO-CaRT (Fig. 2d), demonstrating regional depletion of H3K9me2 in LaminB-enriched chromatin (Fig. 2e). The enrichment of LaminB in H3K9me2-depleted LAD sub-domains suggested their proximity to the nuclear lamina. CHD1 and SATB1 loci were located in H3K9me2-depleted LAD sub-domains (Fig. 2f), and DNA-FISH analysis in NPCs isolated from human cortex showed these loci to be near the nuclear lamina (Fig. 2g, h), similar to other LAD genes (CDH18 and LINC01677, Fig. 2f–h). To investigate if H3K9me2-depleted LAD sub-domains are a general feature of LADs, we analyzed LaminB and H3K9me2 data from mouse cortical NPCs. Similar to human cortex, we observed LAD sub-domains (comprising ~7% of LAD coverage) containing broad depletion of H3K9me2, a moderate decrease in LaminB and high level of transcriptional activity (Extended Data Fig. 6b–e). Thus, in the human and mouse cortex, H3K9me2-depleted LAD sub-domains encompass a set of highly transcribed genes that can be localized close to the repressive nuclear lamina.
Figure 2 |. LAD mapping in human brain identifies transcriptionally active, H3K9me2-depleted LAD sub-domains.
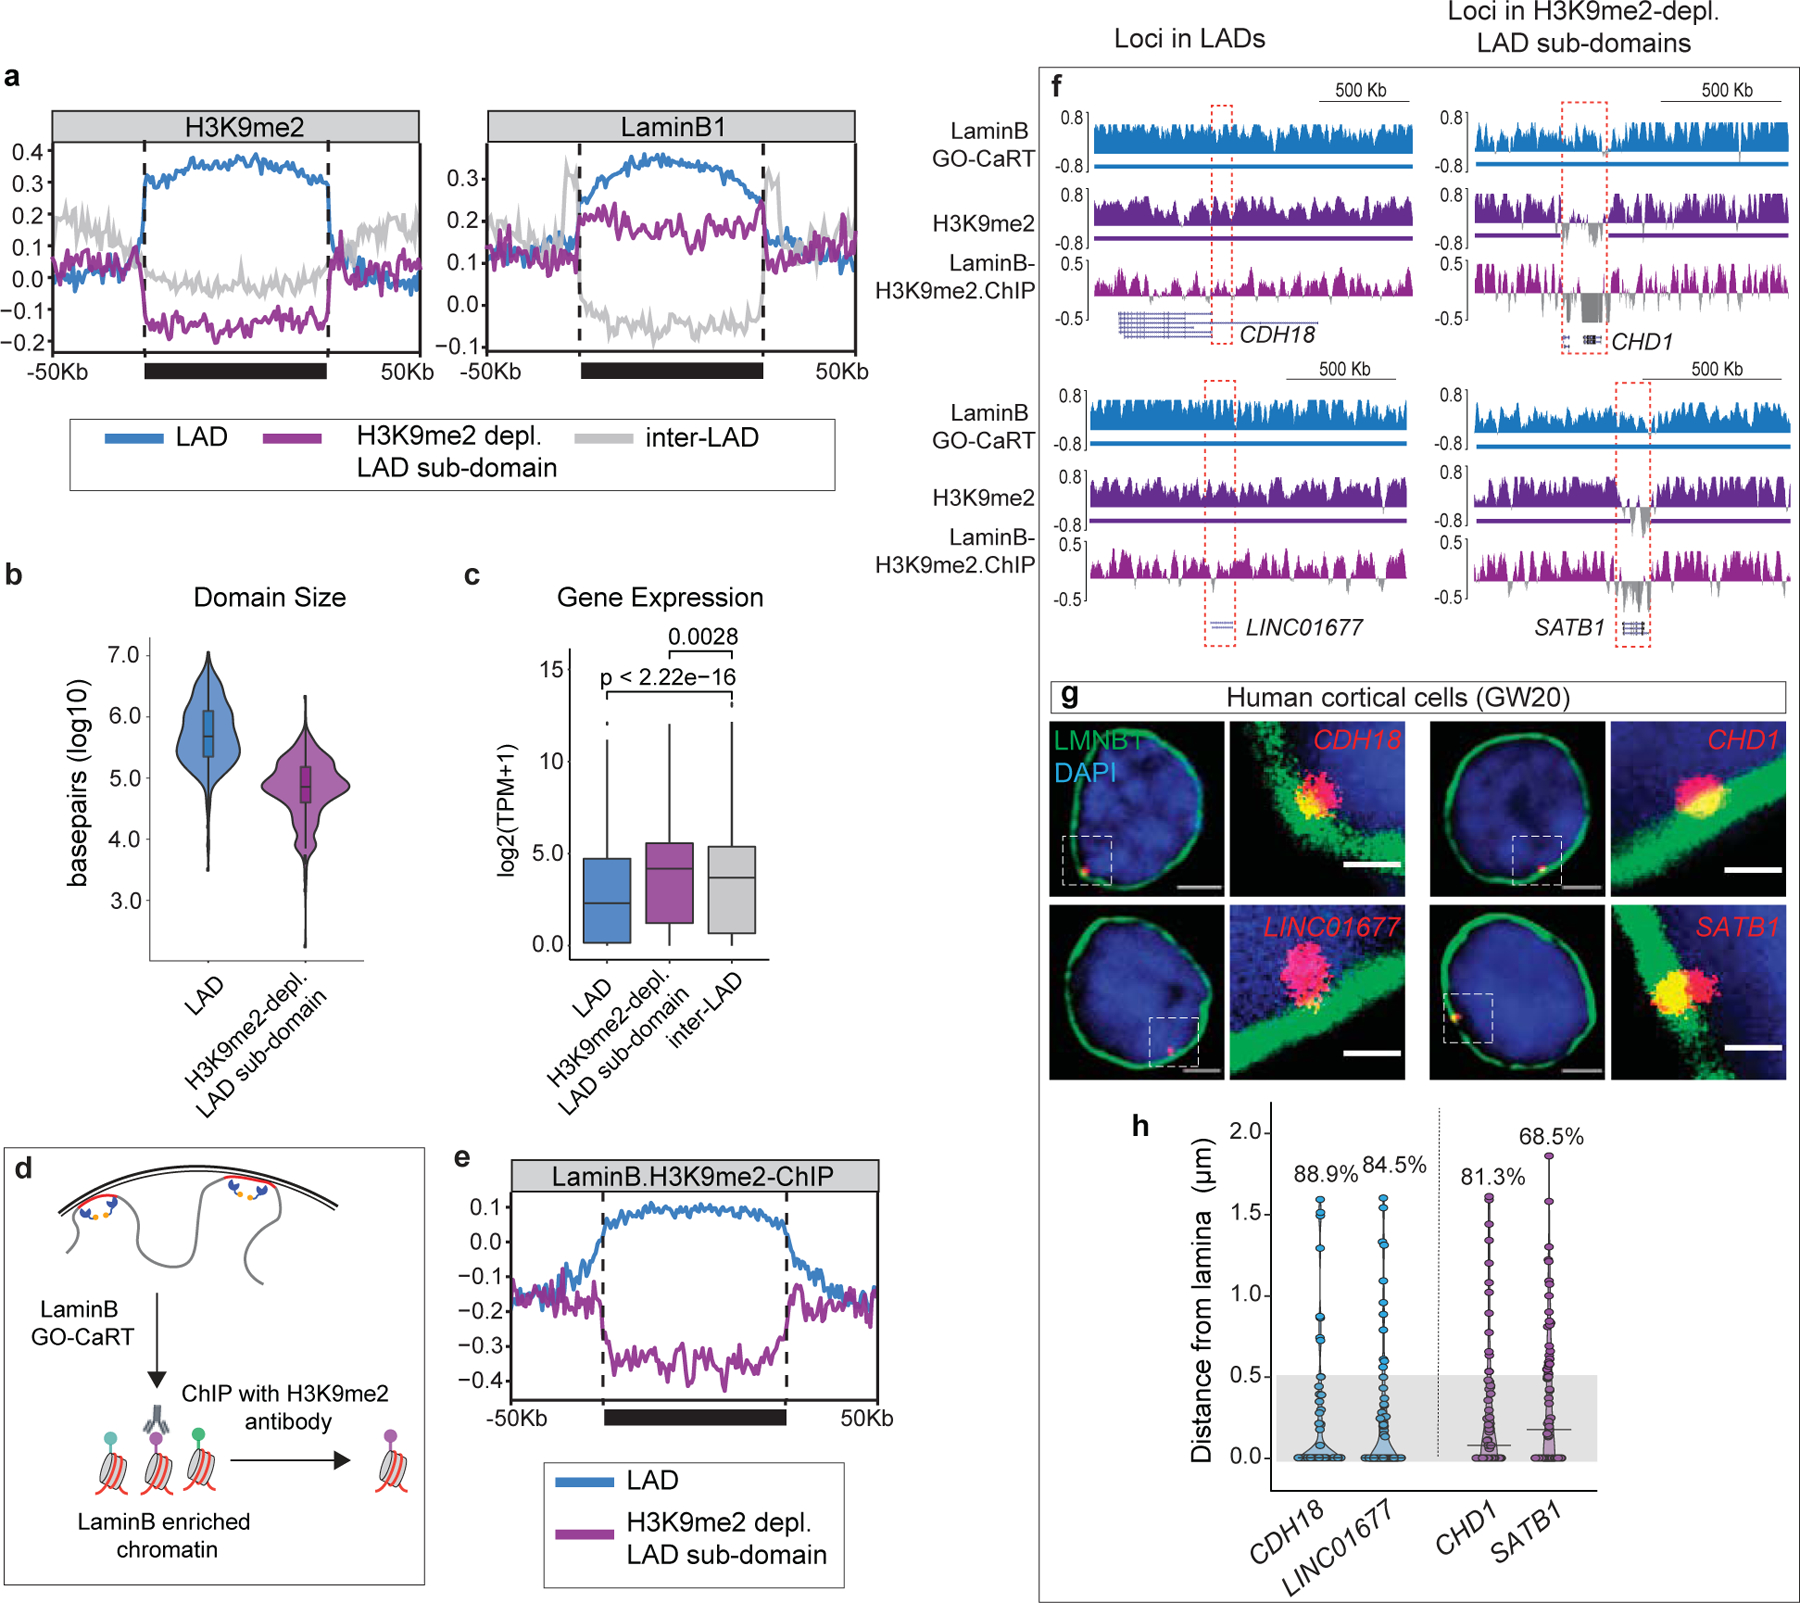
a, Average H3K9me2 and LaminB signal over LADs (blue), H3K9me2-depleted LAD sub-domains (purple) and inter-LADs (grey) scaled to the same relative size depicted by a solid horizontal bar. Traces in the 50Kb flanking proximal and distal regions are unscaled. b, Violin plot depicting the size in base pairs (log10) of LADs (n=742) and H3K9me2-depleted LAD sub-domains (n=492) identified in GW20 cortex. c, Average gene expression in LADs (n=3105), H3K9me2-depleted LAD sub-domains (n=614) and inter-LADs (n=17045), n= number of genes. p= Wilcoxon rank sum test. Two-sided. Non-adjusted. Boxes show the range from lower (25th percentile) to upper quartiles (75th percentile), with the median line (50th percentile); whiskers extend 1.5 times the inter-quartile range from bounds of box. d, Schematic of LaminB GO-CaRT.ChIP, wherein LaminB enriched chromatin is immunoprecipitated with an H3K9me2 antibody. e, Average LaminB-H3K9me2 ChIP signal over LADs and H3K9me2-depleted LAD sub-domains scaled to the same relative size depicted by a solid horizontal bar. Traces in the 50Kb flanking proximal and distal regions are unscaled. f, LaminB GO-CaRT tracks of DNA-FISH loci (marked by dashed box) located in LADs and H3K9me2-depleted LAD sub-domains. g, Representative micrographs of DNA-FISH with LaminB ICC (green) in human GW20 cortical cells for loci located in LADs (CDH18, LINC01677) and H3K9me2-depleted LAD sub-domains (CHD1, SATB1). Scale bar 2 μm, higher magnification 0.5 μm. Multiple images were taken to quantitate sub-nuclear localization of the DNA-FISH loci. h, Quantifications of DNA-FISH loci shown in g. Percentages indicate loci within 0.5 μm (grey area) from the nuclear lamina. 50–60 nuclei were quantified for each locus.
LAD organization in brain is evolutionarily conserved
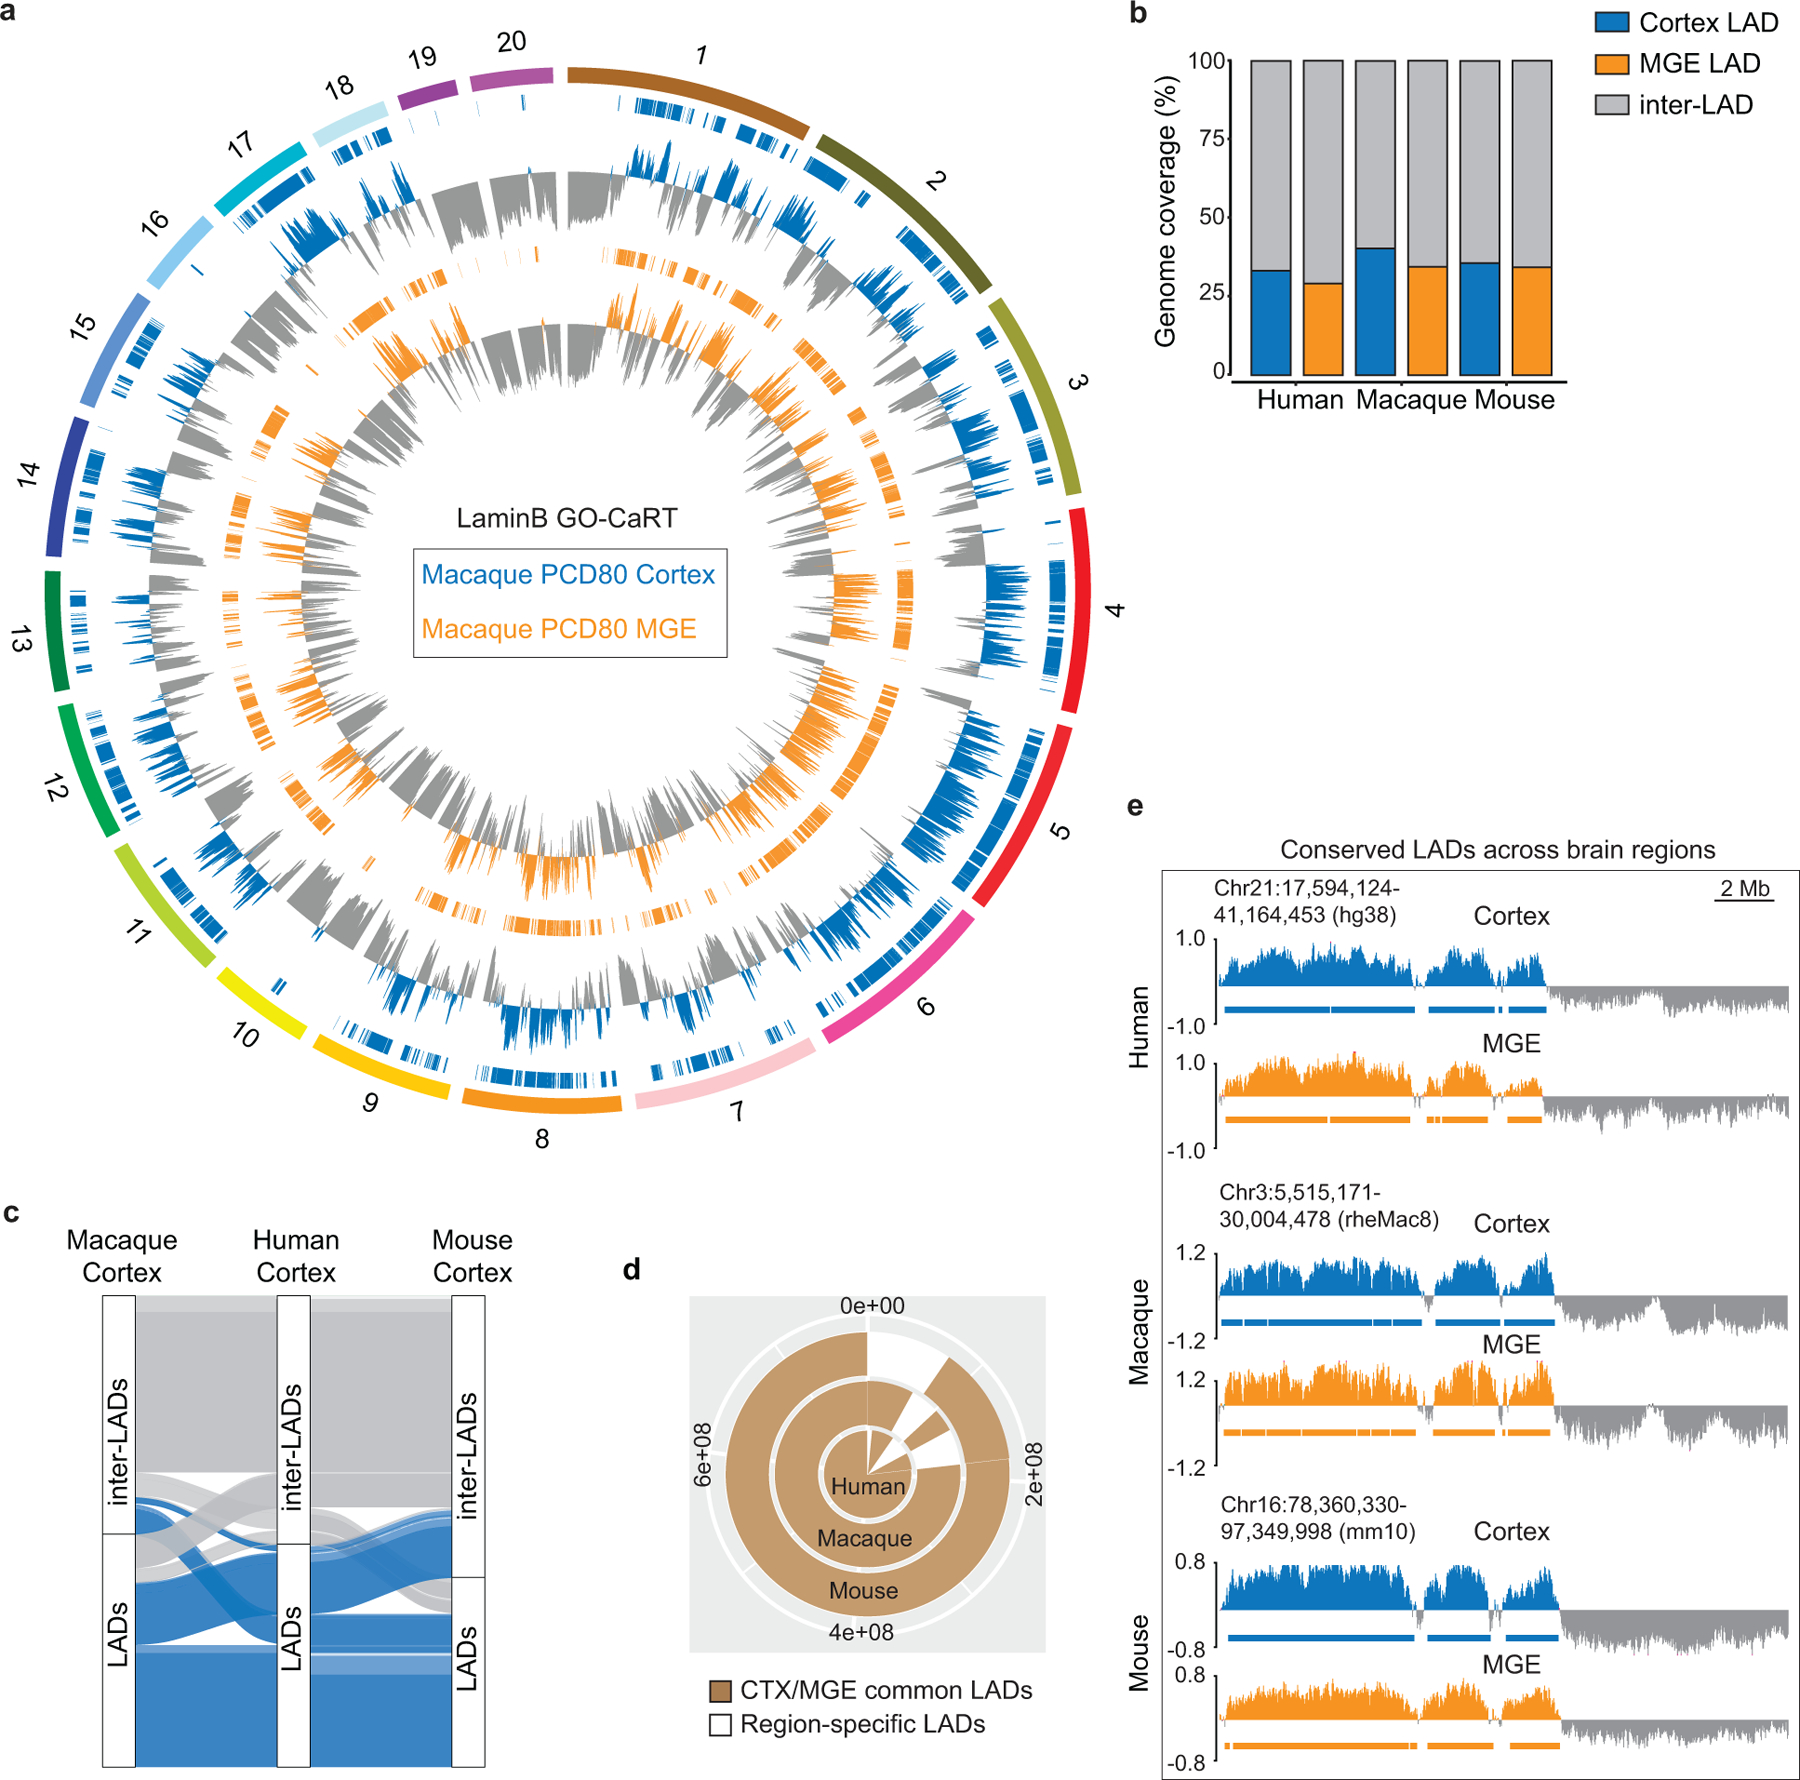
To gain insights into the evolutionary conservation of LAD architecture in brain, we profiled LADs in macaque cortex and MGE (Extended Data Fig. 7a) at post conception day 80 (PCD80), which is developmentally comparable to human GW2021. In macaque cortex and MGE, ~40% and ~35% of the genome mapped to LADs, respectively (Extended Data Fig. 7b).
We next performed liftover analysis between the human, macaque and mouse genomes which shared a common ancestor ~75 million years ago (mya) (Fig. 3a). Approximately 74% of mouse cortex LADs and 68% of MGE LADs were also LADs in the corresponding brain regions of human and macaque, which was significantly higher than random (p-value <2.2×10⁻¹⁶, Fisher’s Exact Test) (Fig. 3b, c). When human was used as the anchor species for liftover, LAD conservation was ~71% for cortex and ~70% for MGE (Extended Data Fig. 7c). Between human and macaque, LADs showed exceptional conservation (91% in cortex and 85% in MGE), suggesting that LAD architecture has changed little since the divergence of these two-primate species, ~25 mya (Fig. 3d, e). Notably, the majority of the LADs (~85%) that were common to mouse cortex and MGE were also common between these two brain regions in human and macaque (Extended Data Fig. 7d, e). Thus, LADs – particularly those that are shared across brain regions – are under strong evolutionary selection pressure.
Figure 3 |. Evolutionarily conserved LADs are enriched in transcriptionally active neural genes.
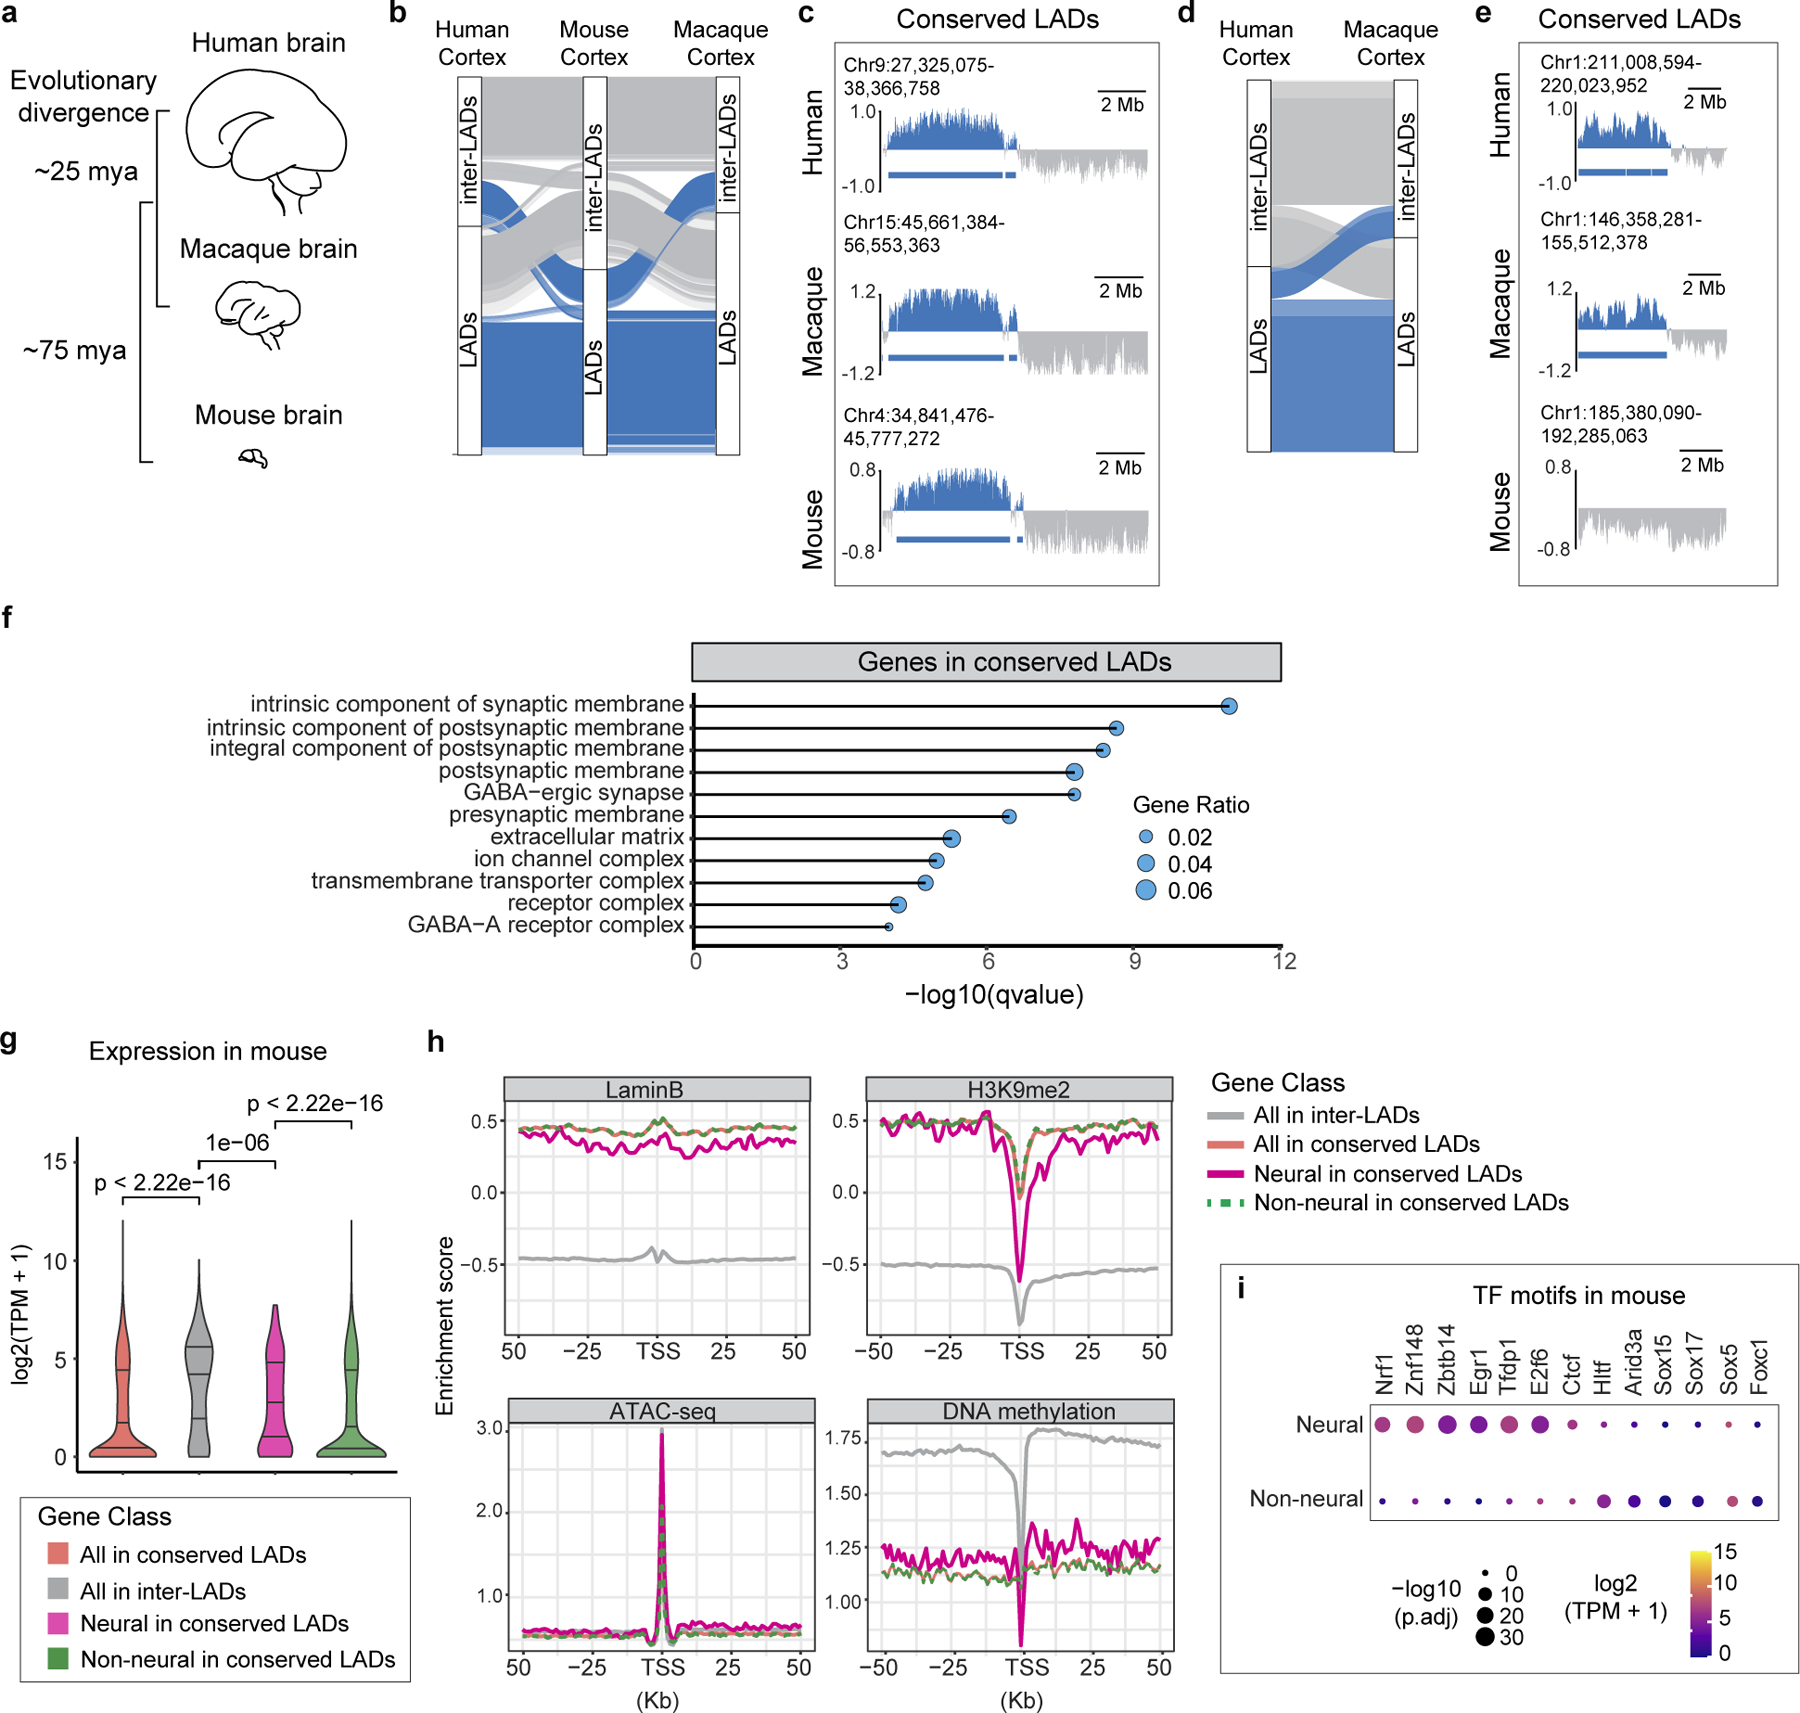
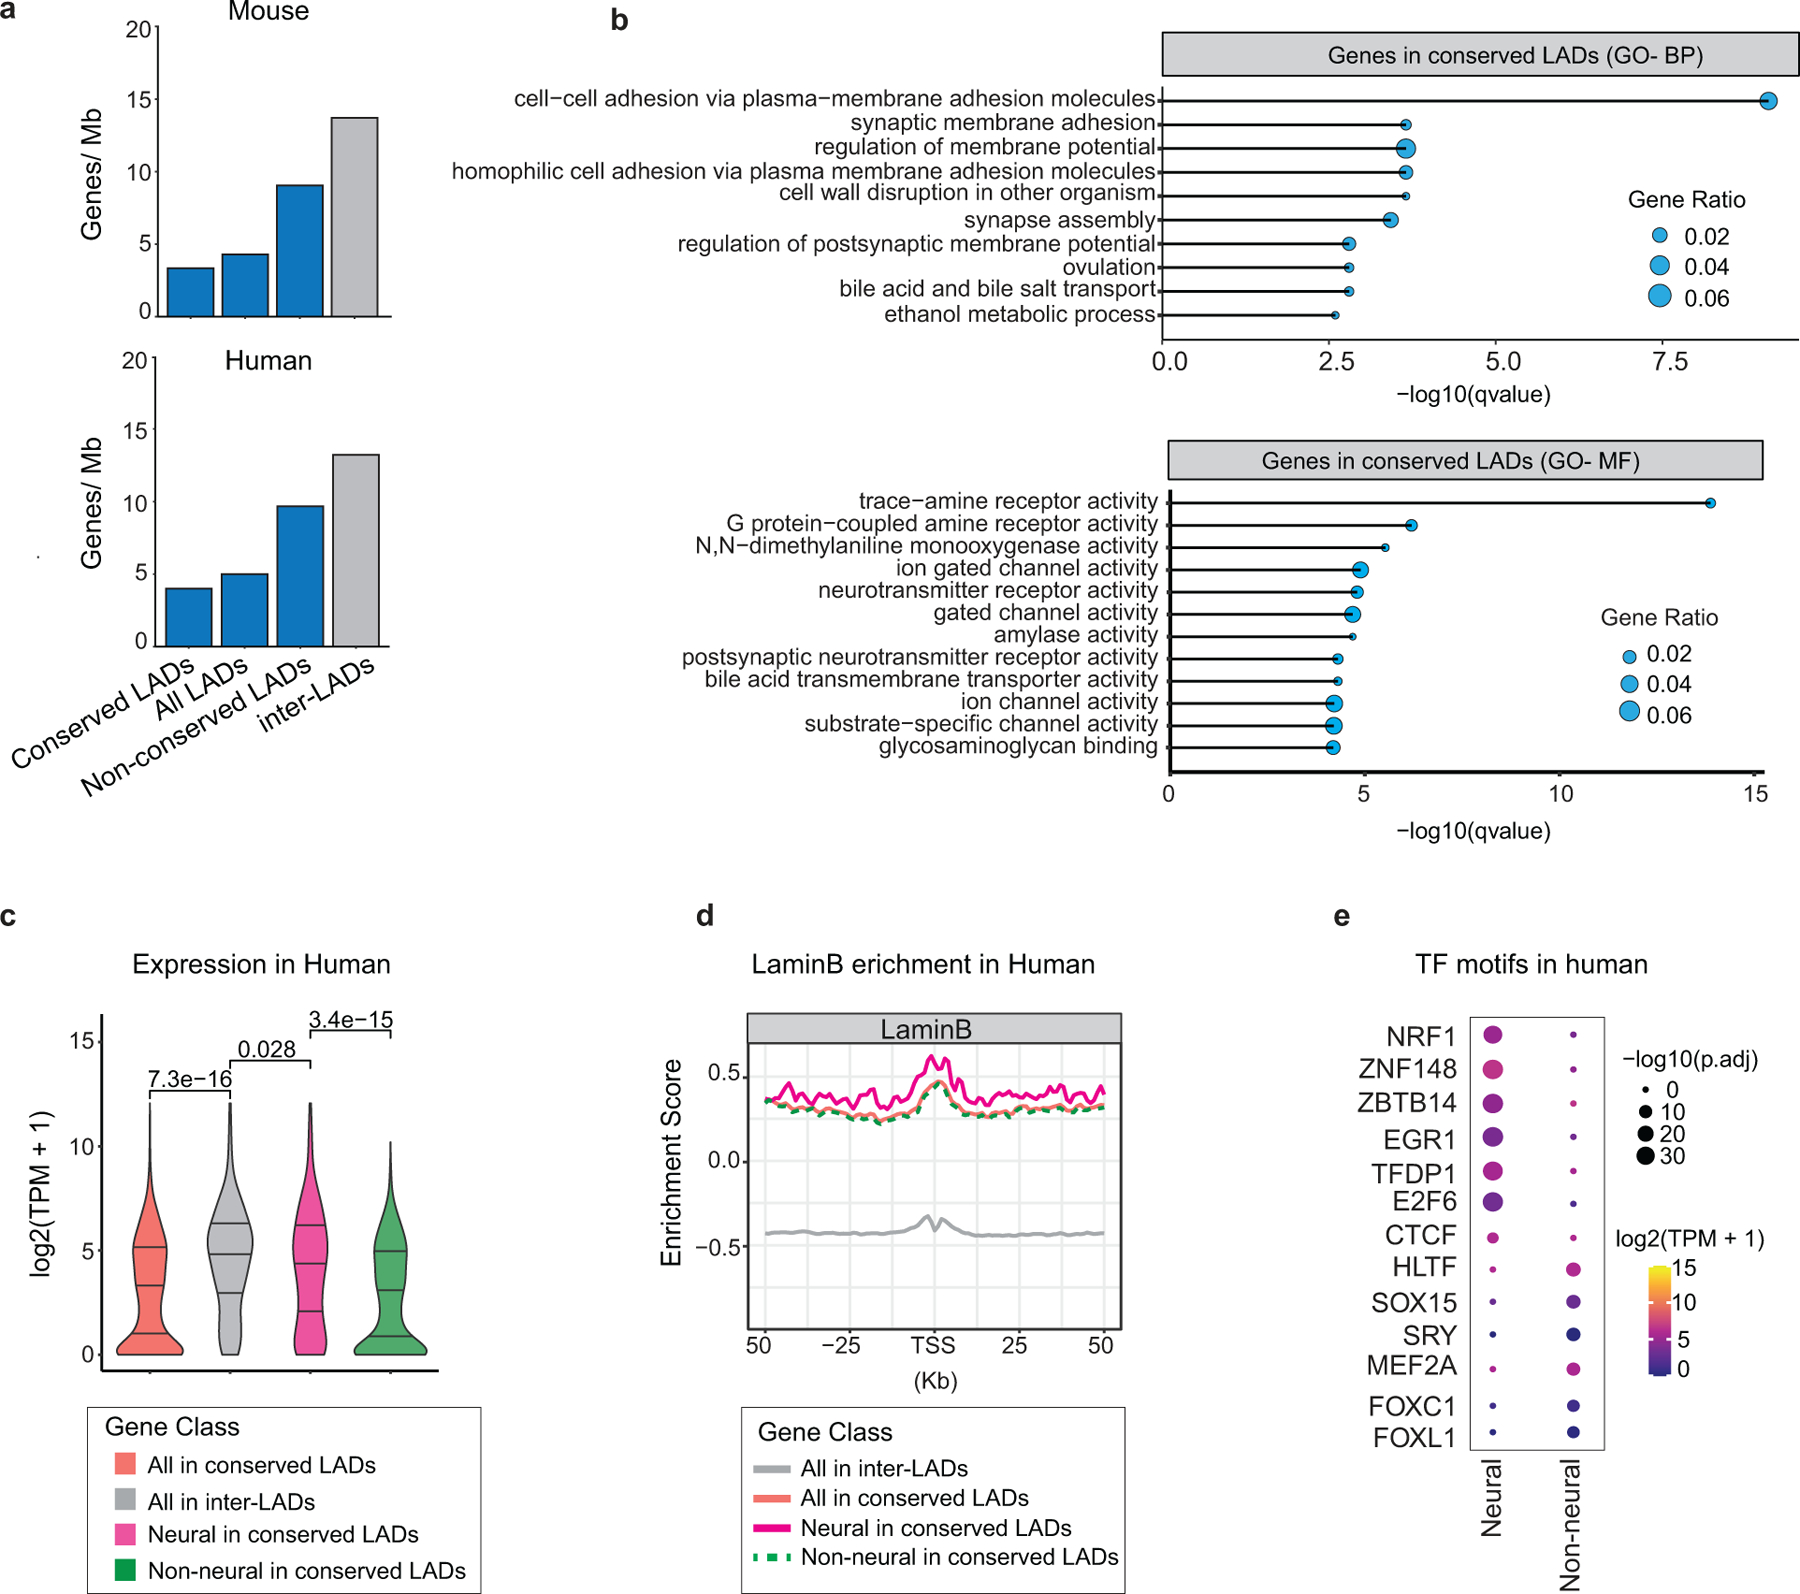
a. Schematic of the developing human, macaque and mouse brain and their evolutionary divergence in million years. b, Alluvial plot depicting conserved LADs (blue) across human, macaque and mouse cortex using mouse as anchor species for liftover. Inter-LADs are shown in grey. c, Representative LaminB GO-CaRT profiles over a conserved LAD in human, macaque and mouse cortex. d, Alluvial plot depicting conserved LADs (blue) between human and macaque cortex using human as anchor species for liftover. Inter-LADs are shown in grey. e, Representative LaminB GO-CaRT profiles over a LAD that is conserved in human and macaque but not in mouse. f, Top enriched GO-terms (cellular component) of genes in conserved LADs based on mouse liftover. GO terms were sorted based on their significance, -log10(qvalue), the size of the bubble represents the gene ratio for each term. g, Violin plot showing average gene expression for all genes (red, n=1625), neural genes (pink, n=279) and non-neural genes (green, n=1346) in conserved LADs. For comparison, expression is also shown for genes in inter-LADs (grey, n=18657). p= Wilcoxon rank sum test. Two-sided. Non-adjusted. h, LaminB, H3K9me2, ATAC-seq and DNA methylation signal over TSS and surrounding regions over the same gene sets as in g. i, Enriched motifs in neural and non-neural gene promoters based on mouse liftover. The size of the circle represents enrichment scores based on the P value from HOMER and color indicates the gene expression of the corresponding TFs in mouse cortex.
Conserved LADs are enriched in neuronal gene expression
Conserved LADs are thought to play a structural role in chromosome organization22. Although conserved LADs in brain were gene poor (Extended Data Fig. 8a), they were enriched in neural genes related to synapse function and cell-adhesion (Fig. 3f, Extended Data Fig. 8b). Analysis of mouse and human RNA-seq data showed that neural genes in conserved LADs were expressed at higher levels as compared to non-neural genes (Fig. 3g, Extended Data Fig. 8c). Local decrease of LaminB can contribute to expression of LAD genes13,20, however, LaminB levels were not significantly different between the neural and non-neural genes in both mouse and human (Fig. 3h, Extended Data Fig. 8d). Instead, neural gene promoters showed strong depletion in H3K9me2, DNA hypomethylation and increased chromatin accessibility when compared to the non-neural genes (Fig. 3h).
We next performed transcription factor (TF) motif analysis in neural and non-neural gene promoters in conserved LADs. In both mouse and human, neural gene promoters were enriched in binding sites for TFs that have known role in brain development such as NRF1, EGR1/NGFI-A, ZNF148, ZBTB14, TFDP1 and E2F6. (Fig. 3i, Extended Data Fig. 8e). NRF1 is linked to activation of genes involved in synaptogenesis and EGR1 regulates DNA methylation of neural genes23,24. We note that the neural genes in conserved LADs do not reside within the H3K9me2-depleted LAD sub-domains which partially overlapped with conserved LADs (~39% in mouse and ~14% in human). This suggests that genes located in H3K9me2 depleted LAD sub-domains and neural genes in conserved LADs are distinct classes of LAD escaper genes. Thus, in addition to being evolutionarily ancient structural elements to 3D genome organization, conserved LADs also contain regions of expressed LAD genes involved in brain development.
Nuclear speckle-associated domains in the human cortex
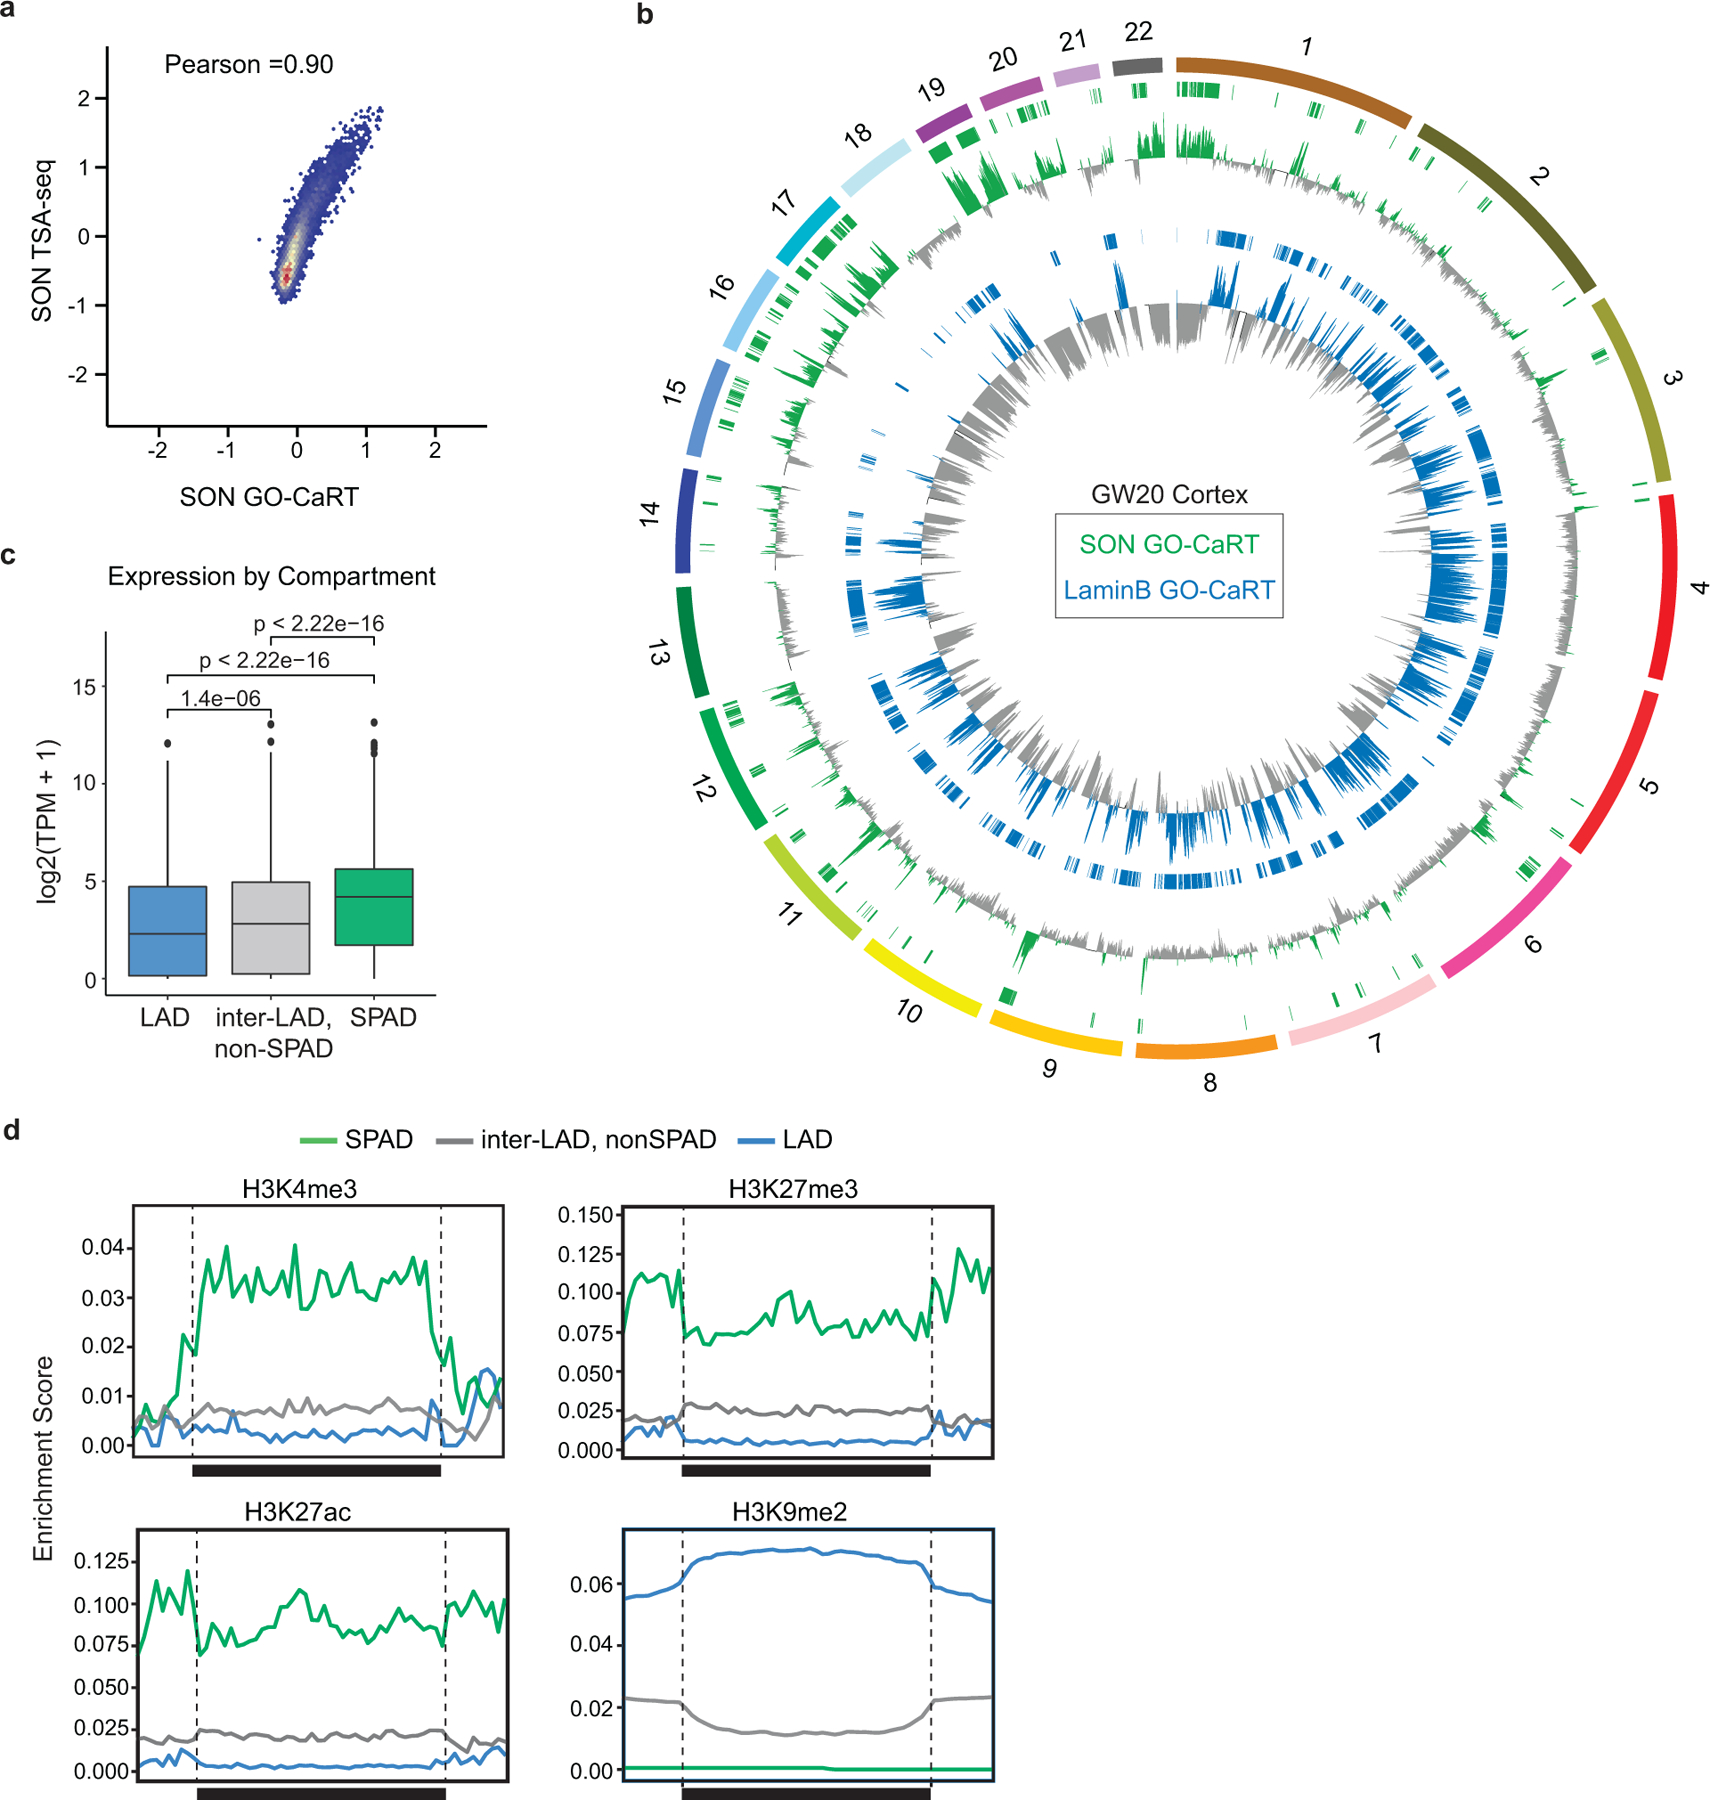
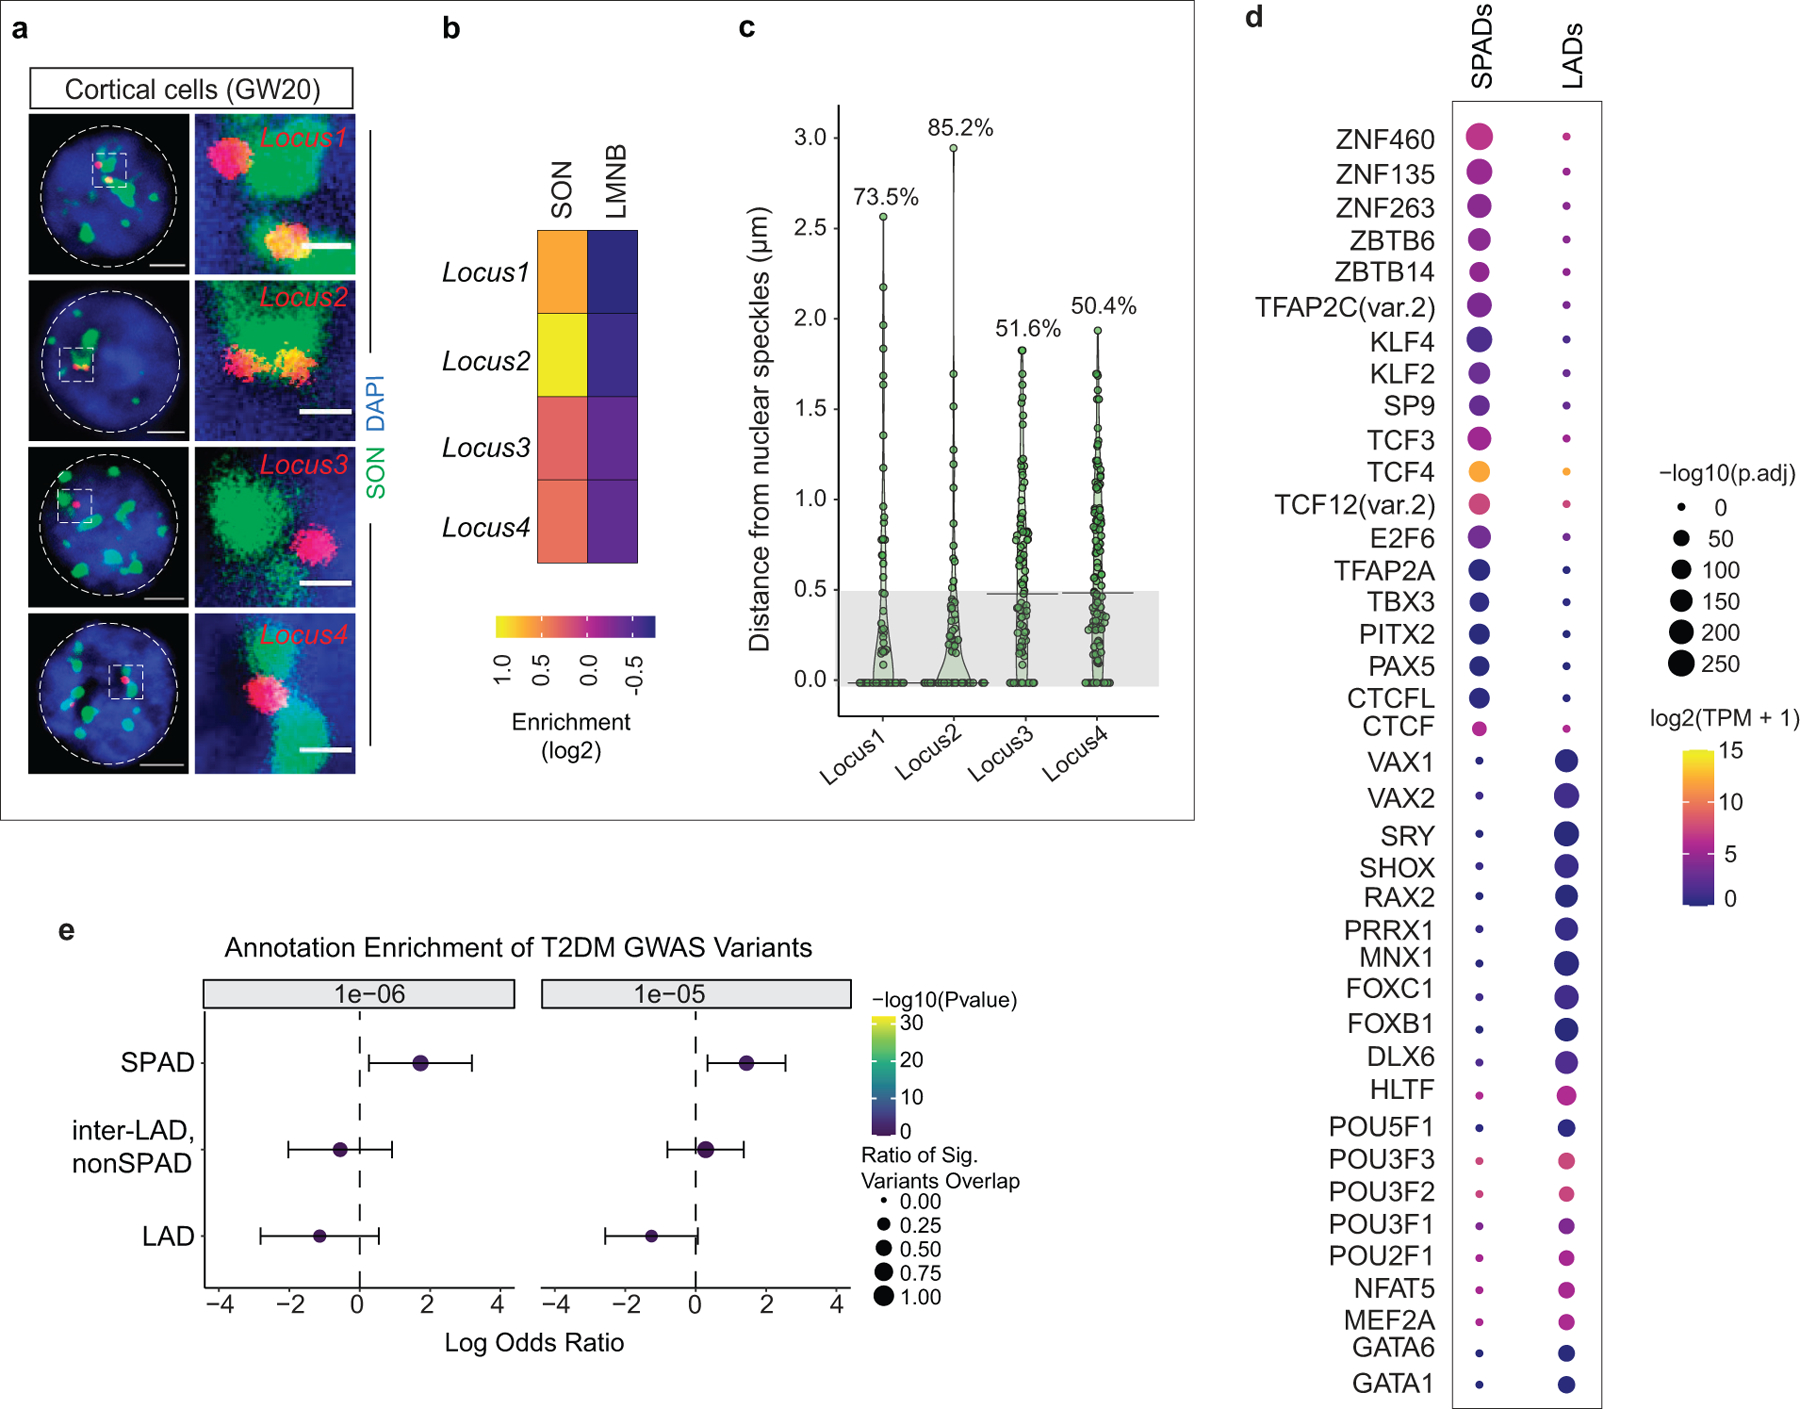
We applied GO-CaRT to study speckle-associated genome organization using antibodies to the speckle protein SON (SON GO-CaRT) (Fig. 4a). SON GO-CaRT profiles using ~75,000 HEK293T cells were highly similar (Pearson =0.9) to those generated by SON TSA-seq that required ~400 million K562 cells4 (Extended Data Fig. 9a). Next, we profiled SPADs in ~75,000 cells acutely isolated from GW20 human cortex (Extended Data Fig. 9b) and found that SPADs were inversely correlated with LADs (Pearson= −0.8) (Fig. 4b, c). SPADs defined a subset of inter-LAD regions whose average expression and enrichment of active chromatin marks was higher as compared to inter-LADs that did not associated with speckles (non-SPAD, inter-LADs) (Extended Data Fig. 9c, d). DNA-FISH with co-staining for SON in cortical cells showed that SPAD loci highly enriched in SON were found closer to the nuclear speckles more frequently as compared to loci with lower levels of SON enrichment (Extended Data Fig. 10a–c).
Figure 4 |. SPADs identified in the human cortex are enriched in schizophrenia risk loci.
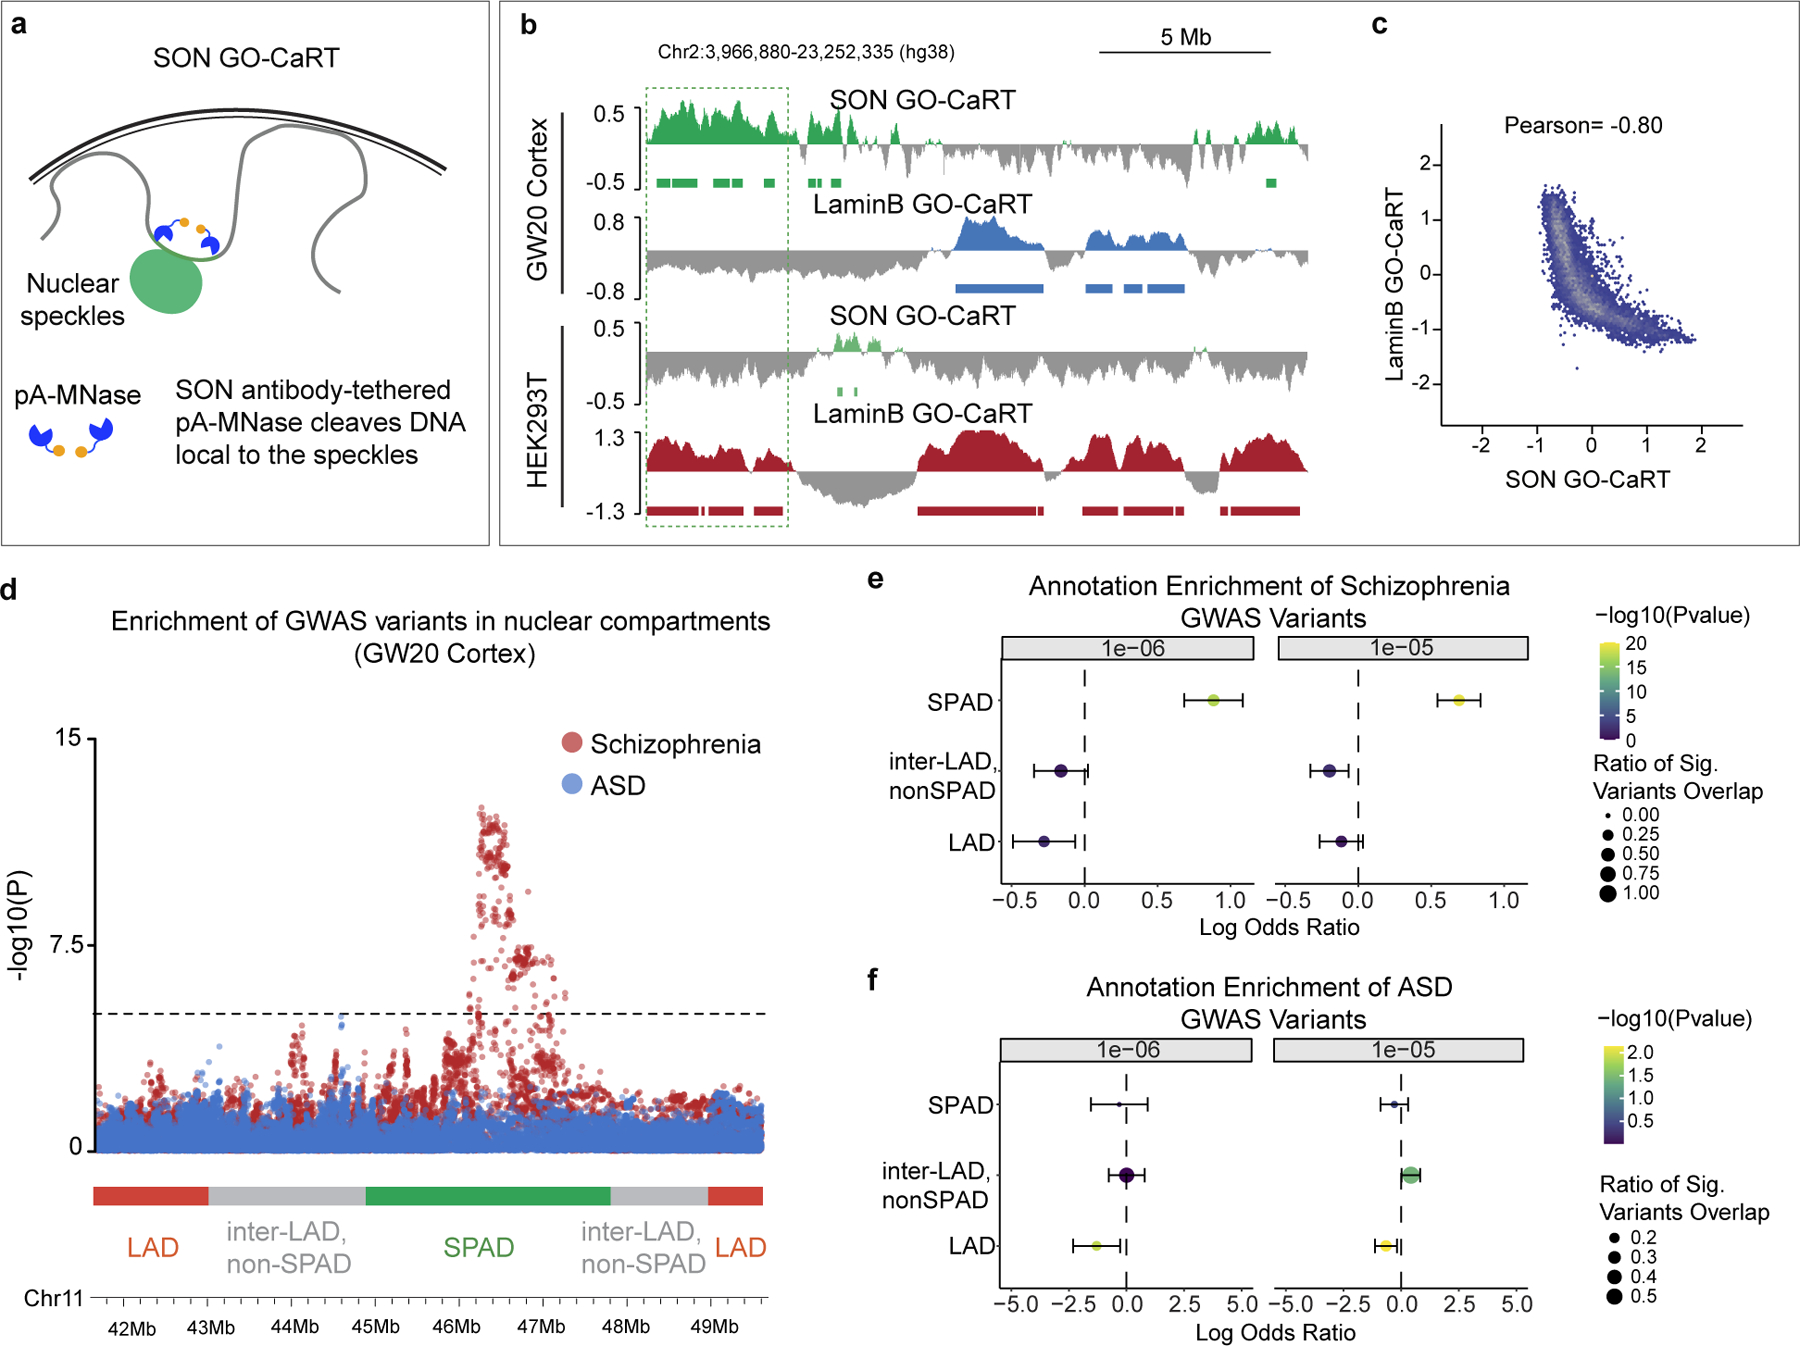
a, Schematic of SON GO-CaRT for mapping genomic regions proximal to the nuclear speckles with SON antibody. b, Representative SON GO-CaRT and LaminB GO-CaRT profiles in the GW20 human cortex and HEK293T cells. Dashed line illustrates a SPAD in human cortex that become a LAD in HEK293T cells. c, Genome-wide scatter plot showing Pearson correlation between SON GO-CaRT and LaminB GO-CaRT. d, Representative genomic region showing enrichment of GWAS risk variants for schizophrenia and ASD in nuclear compartments. Dashed line indicate threshold for statistical significance. Each circle represents a variant for SCZ (red) or ASD (blue). Red, green and grey horizontal bars represent LAD, SPAD and non-SPAD inter-LAD compartments, respectively. e-f, Log odds ratio of enrichment of significant variants overlapping a given genomic compartment with 95% confidence intervals for schizophrenia (e) or ASD (f) GWAS, where significant variants are defined as having a GWAS summary statistic of P < 1e-6 (left) or P < 1e-5 (right). Size of circle represents the fraction of significant variants overlapping a genomic compartment. Wald Test. Two-sided. Non-adjusted. Bars represent standard error. LAD, n=704, SPAD, n=1047, inter-LAD, non-SPAD, n=1810.
To identify TFs that may bind genomic regions in SPADs and LADs in human cortex, we performed TF motif analyses. In SPADs, binding sites for several zinc finger (ZNF) TFs that have known or potential roles in transcription/splicing (KLF/SP, CTCF, ZNF263) were enriched25 (Extended Data Fig. 10d). In contrast, LADs were predominantly enriched in motifs for homeodomain-containing TFs including those important for neural development (VAX1/2, POU3F1/2/3, DLX6). Together, these findings indicate that LAD and SPAD genomic compartments have distinct regulatory features.
Mapping GWAS disease risk loci to nuclear compartments
Genome-wide association studies (GWAS) have identified a large number of disease-risk loci and alleles for brain disorders. We reasoned that integrating GWAS data with nuclear compartments of the developing human cortex can provide new insights into disease pathology. Using a statistical approach that accounts for confounders such as linkage disequilibrium, local gene density and gene expression26, we assessed the enrichment of GWAS variants in distinct nuclear compartments (LADs; SPADs; non-SPAD, inter-LADs) in GW20 cortex. Across two GWAS P value thresholds tested, SPADs were significantly enriched for schizophrenia (SCZ)-associated risk loci27 as compared to LADs or the non-SPAD, inter-LAD regions (Fig. 4d, e). To evaluate the disease specificity of these findings, we analyzed GWAS data for autism spectrum disorder (ASD)28, which also is thought to have a neurodevelopmental origin, and type 2 diabetes (T2D)29, as a non-neurological disease. Variants linked to both ASD and T2D were not significantly enriched in SPADs or other nuclear compartments in the human cortex (Fig. 4d, f, Extended Data Fig. 10e). We speculate that the widespread splicing defects observed in schizophrenia30 could relate to spatial proximity of SCZ-GWAS risk loci to nuclear speckles.
Discussion
An understanding of 3D genome organization is important for uncovering the genetic basis of human brain development and the underlying mechanism of neurodevelopmental disorders. Our work provides key insights into how the genome is organized in the developing mammalian brain relative to two prominent nuclear compartments, the nuclear lamina and nuclear speckles. Previous analyses of genome organization associated with nuclear compartments have been largely limited to cultured cells4,6–8. GO-CaRT enabled profiling of LADs in the developing brain and revealed important differences in LAD architecture between cells cultured in vitro and cells isolated from tissues in vivo including in LADs that are thought to play a structural role in chromosome organization across diverse cell types6,22. These in vitro/in vivo differences in LAD architecture could relate to the three-dimensional morphology of cells in vivo and their complex native environment that are often difficult to fully recapitulate in vitro. This underscores the importance of characterizing the genomic interactions with nuclear compartments from cells in vivo for a physiologically more relevant picture of spatial genome organization.
In the developing brain, cell types from anatomically distinct regions possess unique signatures of chromatin accessibility and 3D chromatin interactions that influence cell type-specific gene expression31,32. In both mouse and human forebrain, we observed differences in LAD architecture between dorsal and ventral NPCs (which give rise to distinct neuronal subtypes), and gene expression corresponded to the region-specific differences in LADs. These findings suggest that differential positioning of genes relative to the nuclear lamina may be an important, additional layer of gene regulation that operates in the developing brain.
We observed two distinct classes of genes in the brain that were expressed despite mapping to LADs. “Escaper genes” located in evolutionarily conserved LADs contained local variation in chromatin structure including depletion of H3K9me2 around promoter regions. In contrast, genes residing in LAD “escaper domains” were characterized by broader regions of H3K9me2-depletion, comprising genomic sub-domains ranging up to hundreds of kb. Together, these data suggest that depletion of H3K9me2 can facilitate transcription of genes even within the context of the repressive nuclear lamina. Although the underlying mechanisms responsible for establishing and maintaining the H3K9me2 depleted state within LADs remain to be determined, we observed enrichment of binding sites for key transcriptional activators that may have a role. DNA-FISH analysis demonstrated that depletion of H3K9me2 within LAD escaper domains does not correlate with a repositioning of genes from the nuclear lamina toward the nuclear interior. This result is consistent with previous studies in mouse ESCs in which loss of H3K9me2 resulted in de-repression of genes but not their detachment from the nuclear periphery33. Although H3K9me2 is important for tethering of LADs to the nuclear lamina34, our results indicate that the tethering of certain genomic regions to the nuclear lamina may be independent of H3K9me2.
GO-CaRT maps provided 3D spatial information to the location of GWAS disease risk loci. The finding that SPADs in the developing human brain are enriched for schizophrenia GWAS variants (but not those of autism) points to a role of nuclear speckles in the pathogenesis of this disease. Previous studies have found that genes that undergo alternative splicing during development are more likely to reside within genomic regions implicated in schizophrenia risk35. Moreover, among other common brain disorders, schizophrenia has the highest burden of splicing defects30. Thus, a potential link emerges between the spatial proximity of the schizophrenia risk loci to nuclear speckles and the observed splicing dysregulation in schizophrenia. More generally, the integration of GWAS data with GO-CaRT maps illustrates how studies of nuclear compartments can provide new mechanistic hypotheses for complex human diseases.
GO-CaRT may be extended to map the genome to other non-membranous nuclear compartments (e.g. nucleolus, PML bodies, Cajal bodies etc.) in vivo and applied to other tissue types, developmental stages, and clinical specimens. Understanding spatial genome organization and its dynamics provides a nuclear anatomic map of genetic information that complements other aspects of chromatin architecture (e.g., histone modifications36, nucleosome positioning37, and topologically-associated domains or TADs38). Together, this growing understanding of 3D genome organization and its dynamics promises to bring new insights into the transcriptional regulatory mechanisms of neurodevelopment and disease.
Methods
Animals
Wildtype (C57bl/6J), and Nes-Tk-GFP mice14 were obtained from Jackson Laboratory and maintained locally in the University of California, San Francisco animal facility. E13 time pregnant females were used for all experiments. All mice were maintained under protocols approved by the Institutional Animal Care and Use Committee (IACUC). Mouse embryonic tissue was collected by microdissecting E13 embryonic forebrain into dorsal region (cortex) and ventral (Median ganglionic eminence- MGE) regions. Cells were acutely dissociated into single cells using papain tissue dissociation kit (Worthington Biochemical Corporation) following manufacturer’s instructions. Briefly, tissue samples were cut into small pieces and incubated in papain for 30 min at 37°C. Tissue was agitated every 10 min to facilitate dissociation. Tissue digestion was stopped with ovomucoid (Worthington) and filtered through a cell strainer. E13 lung and liver were cut into small pieces and dissociated in digestion buffer containing 2.5mL collagenase and 2.5 mL papain (Worthington) for 20–30 min at 37°C with intermittent agitation. The single cell suspension was filtered through a 100 μm cell strainer (BD Biosciences) to remove clumps and debris.
Primary human and macaque tissue collection and processing
Primary human brain tissue (Gestational week 20) was obtained from de-identified donors with previous patient consent in strict observance of the legal and institutional ethical regulations. Protocols were approved by the Human Gamete, Embryo, and Stem Cell Research Committee (institutional review board) at the University of California, San Francisco. Macaque brain tissue (PCD80) was generously provided from samples being used for other experiments from the UC Davis Primate Center.
Primary human brain tissue was processed as previously described by Nowakowski et al39. Briefly, cortex and MGE was collected by dissected primary brain tissue in artificial cerebrospinal fluid containing 125 mM NaCl, 2.5 mM KCl, 1mM MgCl2, 1 mM CaCl2, and 1.25 mM NaH2PO4 under a stereotaxic dissection microscope (Leica). For single cell dissociation, tissue samples were further cut into small pieces and placed in a pre-warmed solution of Papain (Worthington) for 10 min at 37°C. Following approximately 60 min incubation, tissue was triturated following manufacturer protocol and samples were spun through an ovomucoid gradient to remove debris. The dissociation media was removed and cells were resuspended in PBS supplemented with 3% fetal bovine serum (Sigma). Cells were directly processed for LaminB GO-CaRT and RNA-seq. Same dissociation protocol was applied to macaque cortical and MGE tissue samples.
Cell culture
NIH-3T3 MEFs and HEK293T cells were cultured at 37°C in DMEM (Gibco) supplemented with 10% FBS. For DNA FISH, acutely isolated cells were cultured overnight at 37°C in NES media (DMEM/F12, 1:1000 B27, 1:100 N2, 20ng/mL FGF, 20ng/mL EGF, 20ug/mL insulin, 5ng/mL BDNF and 10 uM Rock inhibitor) using poly-L-Lysine/laminin/fibronectin coated chambered coverglass (Labtek). SVZ-cNSCs were derived from mouse sub-ventricular zone and cultured as described previously40.
Fluorescence activated cell sorting (FACS)
Freshly dissociated embryonic brain regions from E13 Nestin-Tk-GFP mice were resuspended in PBS containing 1% BSA. Cells were passed through cell strainer to remove any clumps and sorted for GFP using BD FACS Aria III cytometer with 85-micron size nozzle. Sorted cells were directly processed for LaminB GO-CaRT.
GO-CaRT
Cells isolated acutely from the developing brain were sensitive to the nuclei extraction and cell permeabilization methods described in the CUT&RUN protocols11,41 causing damage to the nuclear membrane. This issue was of particular concern because the integrity of the nuclear membrane was critical for successful mapping of LADs in these cells. Moreover, the release of large amount of DNA from the damaged nuclei caused clumping of Concanavalin A coated magnetic beads (Bio-Mag Plus), affecting the recovery of pA-MNase cleaved fragments. To address these issues, we optimized nuclei isolation methods that were gentler on cells and preserved the integrity of the nuclear membrane. These modifications resulted in higher recovery of pA-MNase cleaved chromatin, allowing mapping of LADs and SPADs from small numbers of cells acutely isolated from diverse mouse and human tissues.
75,000–100,000 acutely isolated cells from mouse and human forebrain (or cultured 3T3 and HEK293T cells) were used for each experiment (sample information, Supplementary Table 1). Cells were resuspended in 500 μL ice cold Nuclei Isolation Buffer (NIB) (10 mM HEPES-KOH, Ph 7.9. 10 mM KCl, 0.1% NP40, 0.5 mM Spermidine and 1X Halt protease inhibitor cocktail) and incubated for 10 min in ice. Nuclear pellet was collected by centrifuging at 600xg for 3 min at 4°C and again washed with 500 μL NIB. Nuclear pellet was collected by centrifugation at 600xg for 3 min and resuspended in 100 μL of NIB. Successful nuclei isolation was confirmed by visual inspection under a phase contrast microscope. Next, 10 μL Concanavalin A lectin beads (Bio-Mag Plus) washed and resuspended in Binding Buffer (BiB) (20 mM HEPES-KOH, pH 7.9, 10 mM KCl, 1 mM CaCl2 and 1 mM MnCl2) were added to each sample and rotated for 10 min at room temperature. Nuclei bound Concanavalin A beads were pulled by placing the tubes on a magnetic stand to remove the supernatant. For LaminB GO-CaRT, anti LaminB1 antibody (Abcam# ab16048) was used and for SON GO-CaRT, anti-SON antibody (Atlas antibodies #HPA031755) was used at 1:100 dilution in Blocking Buffer (BlocB) (Wash buffer containing 2mM EDTA). Same steps were followed for histone marks using anti-H3K9me2 (Active Motif #39239, 1:100), anti-H3K9me3 (Abcam# ab8898; 1:100), anti-H3K27me3 (Cell signaling technologies #9733; 1:100). An IgG control was run in parallel for all experiments (Cell signaling technologies #2729; 1:100). To each sample 50 μL of BlocB containing primary antibody was added and incubated overnight on a rotator at 4°C. Next day, samples were briefly spun and placed on magnetic stand to clear off the liquid. Samples were washed twice with 1mL Wash Buffer (WaB) (20 mM HEPES-KOH, pH 7.5, 150 mM NaCl, 0.1% BSA, 0.5 mM Spermidine and 1X Halt protease inhibitor cocktail). At the end of two washing steps, Concanavalin A bound nuclei were resuspended in 50 μL of WaB and gently mixed. To each tube, 2.5 μL of pA-MNase (diluted 1:10 in WaB from 140 μg/mL stock) kindly provided by Steven Henikoff (Fred Hutchison Cancer Research Center) was added and rotated for 1 hour at 4°C. Samples were briefly spun and placed on magnetic stand to remove the liquid. Samples were washed twice with 1mL WaB. At the end of two washing steps, Concanavalin A bound nuclei were resuspended in 100 μL of WaB and gently mixed. The tubes were placed in pre-chilled metal blocks sitting in ice. While gently vortexing, 2 μL of 100 mM CaCl2 was added to initiate MNase digestion and returned to pre-chilled metal blocks. Digestion was carried out for 30 min and stopped by adding 100 μL of 2XSTOP (200 mM NaCl, 20 mM EDTA, 4 mM EGTA, 50 μg/mL RNAseA, 40 μg/mL Glycogen and 10 pg/mL of heterologous DNA) while gently vortexing. To release pA-MNase cleaved fragments, samples were incubated at 37°C for 15 min. DNA was extracted using Phenol: Chloroform extraction method. We considered the possibility that the pA-MNase cleaved DNA-protein complexes might be too large to diffuse out of the nucleus and enter the “soluble” fraction. To test this, we recovered DNA from both soluble and total fractions (soluble + insoluble). LaminB profiles were highly similar (Pearson= 0.94) between soluble and total fractions, indicating that DNA-protein complexes released by LaminB GO-CaRT can readily diffuse out of the nucleus.
Library preparation, sequencing and data processing
Sequencing libraries were prepared from GO-CaRT DNA fragments using KAPA HyperPlus with amplification DNA library preparation kit (#KK8512) following manufacturer instructions. The library was amplified for 13–15 PCR cycles and larger DNA fragments were depleted by doing a 0.55X size selection using Agencourt AMPure XP beads (Beckman #A63881). 150bp paired-end sequencing of GO-CaRT libraries was performed on the Illumina HiSeq 4000. Low quality reads and adaptors were removed with BBduk (http://jgi.doe.gov/data-and-tools/bb-tools/), and resulting reads were aligned to the mouse (UCSC mm10), macaque (USCS rheMac8) or human (UCSC hg38) genome using bowtie2 and the following settings: --local --very-sensitive-local --no-unal --no-mixed --no-discordant -q --phred33 -I 10 -X 70011. Individual dissections of prefrontal cortex and primary visual cortex were performed and sequenced independently, but were combined for analysis and referred to in the text and figures as ‘dorsal’/ ‘cortex’ for both mouse and human samples. For mouse LAD analysis, individual dissections from MGE and LGE were performed and sequenced independently, but were combined for analysis and referred to in the text and figures as ‘ventral’. Duplicate reads were removed with Picard tools (http://broadinstitute.github.io/picard/). Several quality control metrics used in CUT&RUN were performed including fragment size distribution and genomic distribution of reads in IgG control samples.
Domain calling
For domain calling, we tested Enriched domain Detector (EDD)42 and EPIC243- two algorithms specifically designed to call large enriched regions. EDD performed well on cultured cell lines (3T3 MEFs, HEK293T and SVZ-cNSCs) with default parameters. For in vivo samples, EDD domain calling was improved by manually identifying the gap penalty score (LaminB and SON 7.5, H3K9me2 10). Macaque data could not be processed using EDD as the program failed repeatedly. For all the in vivo samples, we chose EPIC2 (instead of EDD) because it performed better and was more consistent across mouse, macaque and human samples. The optimized gap scores and bin size for EPIC2 were 6 and 8000, respectively.
Statistics and data reproducibility
All the mouse and human GO-CaRT and RNA-seq experiments were performed for at least two biological replicates and these were highly correlated (Supplementary Table 2). No statistical test was used to predetermine sample size. GO-CaRT was performed on 4–5 pooled mouse embryos (sex of the embryos was not determined). GO-CaRT was performed on human brain tissue from de-identified donors. Macaque GO-CaRT experiments were performed from single samples due to limited availability of the primary tissue.
LaminB-GO-CaRT.ChIP
LaminB-GO-CaRT was performed as detailed above and LaminB enriched chromatin from the supernatant was used for subsequent chromatin immunoprecipitation (ChIP) as described in Brahma and Henikoff 201944 with some modifications. Briefly, nuclei were isolated from snap frozen GW20 cortex and subjected to LaminB GO-CaRT in multiple tubes (each containing ~500,000 nuclei) to prevent clumping of beads. The reaction was stopped using 2XSTOP containing LaminB blocking peptide (abcam #ab16375) at 20 μg/mL followed by incubation at 37°C for 15 min. Supernatant containing LaminB associated DNA fragments were pooled and aliquoted (150 μL) for subsequent ChIP. One aliquot was kept as input. For each ChIP, we used supernatant from ~ 750,000 nuclei subjected to LaminB GO-CaRT. Antibodies for H3K9me2 (Active Motif #39239, 1:100) and IgG control (Cell signaling technologies #2729; 1:100) were added (1:100) and incubated overnight. Next day, protein A or G dynabeads (ThermoFisher #10002D) were equilibrated in WaB containing 0.05% Tween-20. 10 μL of beads were added to each IP and incubated for 1 hour. The beads were washed twice in WaB containing Tween-20. The volume was brought up to 300 μL with WaB containing heterologous spike-in DNA at 5pg/mL (including for input). 2 μL each of 10% SDS and 20 mg/mL Proteinase K were added to samples and incubated at 50°C for 1 hour. DNA was extracted using phenol-chloroform-isoamyl alcohol extraction method. DNA was eluted in 50 μL elution buffer (5 mM Tris) and used for library preparation (KAPA HyperPlus kit #KK8512) following manufacturer instructions.
RNA-sequencing (RNA-seq)
Total RNA was extracted using TRIzol (Thermo # 15596018) and purified using Direct-Zol RNA kit (Zymo). Total RNA was subjected to rRNA depletion using ribo-depletion kit (NEB#E6310). Libraries for sequencing were prepared using NEB’s Next Ultra II direction library kit (NEB#E7760) following manufacturer’s protocol. Single-end 50 (SE50) sequencing was performed on Illumina HiSeq 4000. For differential expression analysis, reads were pseudoaligned to either mouse (Gencode GRCm38 release M16) or human (GRCh38 release 28) transcriptomes using kallisto (v0.43.1) with default settings. Gene-level differential expression analysis was performed with Sleuth (0.30.0) using the transformation function = function(x) log2(x + 0.5) convert b value output from Sleuth into log2 fold-change. In order to generate RNA-seq tracks, reads were aligned to mouse (mm10) or human (hg38) genomes from UCSC using Hisat2 (2.1.0).
Analysis of various genomic features
LAD coverage was found using bedtools “genomecov.” To identify region-specific LADs, we subtracted intersections from the original LAD coordinates using bedtools “subtract.” H3K9me2 depleted LAD sub-domains were determined by general LAD calling following by intersecting with H3K9me2. Gene/enhancer density was calculated on a per Mb bases. SINE and LINE (RepeatMasker track from UCSC genome browser) density was calculated by dividing the number of base pairs covered by the respective genomic element within LADs over the total number of LAD base pairs. Additional computational analysis and figure making was performed in the R programming environment.
Gene expression analysis of region-specific LADs
Genes from the RNA-seq were initially filtered out based on whether 1kb+/− the TSS fell within the boundaries of the region-specific LADs. We then labeled genes with a 0.5-fold change in expression and a p-value of 0.05 as being differentially expressed in either the “up” or “down” direction. To calculate the LaminB enrichment for each gene, we applied the multiBigwigSummary tool from the Deeptools45 suite to log2-normalized LaminB/IgG bigwig files. Differential LaminB enrichment for each gene between dorsal and ventral regions was calculated around TSS +/−10Kb using following equation: .
Analyses of LAD conservation
Liftover among human (hg38), mouse (mm10) and macaque (rheMac8) was performed using UCSC genome browser LiftOver tool with the minimum ratio of bases set to be 0.1 as default. Alluvial and donuts plots were generated with ggplot2R package. Statistical significance was assessed by comparing scores against a null distribution constructed of 100,000 random permutations by shuffling the LADs regions 100,000 times.
GO analysis
GO analysis was performed with the enrichGO function from the clusterProfiler package in R using default parameters except for minGSSize =3 and keytpe = “ENSEMBL”. Analysis of epigenetic features around transcriptional start sites of genes within conserved LADs was performed with custom R scripts.
Nuclear compartment enrichment for disease-associated variants
Enrichment of GWAS variants was performed using GARFIELD standalone version 2 with provided UK10K annotations and quantile bins as previously described26. To account for potential confounding of RNA expression driving enrichment of variants in nuclear compartment, the RNA expression in fetal cortex (median TPM within 1 MB of each variant) was added as an additional term to the default generalized linear model in GARFIELD (logit E(y) = 1α + XTSSβTSS + XTAGSβTAGS +XRNAβRNA + XAjβAj). The median TPM within 1 MB of each variant was discretized into 5 bins. All SNPs from the MHC locus except the lead SNP were removed from analysis due to complexity of linkage disequilibrium of the locus.
Immunohistochemistry on brain sections
E13 mouse brains were drop fixed in 4% paraformaldehyde (PFA) and sectioned on a cryostat (Leica) at 14 μm thickness. Immunohistochemistry was performed as described previously46 using the anti-GFP antibody (#ab13970, 1:500). Whole-mount dissection and immunostaining was performed as described by Mirzadeh et al47.
Combined Immunocytochemistry and DNA Fluorescence in-situ Hybridization (FISH)
Cells were grown for 16–24 hours at 37°C in #1.5 chambered coverglass (Thermo Fisher #155409PK) coated with Poly-L-Lysine (Millipore) and laminin/fibronectin (Sigma). Culture media was removed and cells were fixed in Histochoice-MB (Electron Microscopy Sciences #64115–01) for 30 min at room temperature. Fixed cells were washed three times (each wash 10 min) with D-PBS. Cells were permeabilized and blocked (5% NGS and 0.5% TritonX-100 in D-PBS) for 1 hour at room temperature. In a humidified chamber, cells were incubated overnight at 4°C in 5% NGS and 0.1% TritonX-100 containing LaminB1 (Abcam# ab16048) or SON (Atlas antibodies # HPA031755) antibodies at 1:500 dilution. Next day, cells were washed three times with D-PBS and incubated with secondary antibody (ATTO647N, Active Motif #15048; 1:250) for 1 hour at room temperature. Following three washes with D-PBS, cells were post fixed in Histochoice-MB for 15 min at room temperature. Cells were washed two times with D-PBS and 0.7% TritonX-100 was included in third wash to permeabilize the cells. Cells were washed once with D-PBS and treated with a series of ethanol gradient; 70%, 85% and 100% ethanol each for 2 min at room temperature. The chambered coverglass was allowed to dry at 45°C until all ethanol evaporated. The cells and BAC probe mixture (Empire Genomics- 3ul probe+17 ul hybridization buffer, Supplementary Table 3) were denatured together at 83°C for 10 min. The chambered coverglass was immediately transferred to a 37°C oven and incubated for 16–24 hours using 50% formamide/2X SSC solution as humidity control. Next day, cells were washed with pre-warmed Wash solution 1 (WS1 – 0.3% NP40, 0.4X SSC) to 73°C and agitated gently for 3 min at room temperature. A second washing step was performed with Wash Solution 2 (WS2- 0.1% NP40, 2X SSC) for 3 min at room temperature and the coverglass was allowed to dry in dark. Cells were stained with DAPI for 10 min at room temperature followed by a wash with D-PBS and water for 5 min. Cells were mounted with prolong glass (Invitrogen # P36980) and left in dark overnight at 4°C to let it cure before imaging.
Image analysis
Samples were imaged using Leica confocal microscope (Leica TCS SP5X) with 63X oil immersion objective, with a Z-stack collected for each channel (step size 0.2 μm). Images were processed using ImageJ software (Version: 2.0.0-rc-65/1.52q, build: 961c5f1b7f) and individual nuclei were identified by DAPI staining. Nuclear lamina and nuclear speckles were identified by LaminB1 and SON immunostaining, respectively. 3D reconstructions of cells were conducted via the Imaris x64 (v 9.2.1) software (Bitplane AG, Switzerland). DNA FISH dots for probe signal were created at the location of the highest fluorescence intensity via the Spots Tool. Spot diameter ranged from 250 nm to 300 nm. Nuclear lamina surfaces were automatically detected from LaminB1 immunostaining with the Surfaces tool. Distance from the center of the FISH spot to the closest nuclear lamina surface was quantified using the Measurement Points tool. 40–60 nuclei were analyzed for each experimental condition. In the case that the generated DNA FISH spot was embedded in the nuclear laminar surface, distance to the lamina was quantified as zero.
Previously published datasets used in this study
The following datasets were used in this study: DamID data of MEFs, NPCs, ASCs, ESCs and cLADs (GSE17051), 3T3 MEF RNA-seq (PRJNA269376), DamID data of various human cell lines (https://data.4dnucleome.org/publications/5a5117c9-face-4648-bbb7-d54e468af2ba/#overview), mouse enhancer data (http://chromosome.sdsc.edu/mouse/download.html), GW12 human brain ChIP-seq data (GSE63634), K562 SON TSA-seq (GSE81553), GW19 fetal cortex ATAC-seq (GSE149268), human neuronal stem cells originated from H1, Whole Genome bisulfite sequencing (WGBS) (Encode- ENCFF458SQS). E13.5 forebrain ATAC-seq (Encode - ENCFF059AWY), E13.5 forebrain Whole Genome bisulfite sequencing (WGBS) (Encode - ENCFF254BTJ)- signal was smoothed to 100 bp bins using deepTools. GW12 human brain ChIP_seq and TSA-seq sequencing data was downloaded from the (GEO) database using fasterq-dump (v2.9.6). Adapter sequences were removed using BBDuk (v38.33). FASTQ files were aligned to either mm10 or hg38 UCSC genomes using bowtie2 (v2.2.6) using the --very-sensitive flag. Genome-wide bigwig files were made from aligned reads using deepTools (v 3.2.0) bamCompare or bamCoverage at 50bp bin size. For RNA-seq data, differential expression analysis was performed using Kallisto/Sleuth as previously mentioned.
Motif Analysis
Defining Query and Background Sequences
LADs and SPADs
Sequences 10 kb inside the end point of each compartment were divided into 250 bp sequences irrespective of location to a gene. Up to 50,000 sequences were sampled, defining the query set. The complement of the genome compartment was divided into 250 bp sequences with up to 50,000 sequences sampled, controlling for mean conservation to serve as background. The average phyloP score for each sequence in the query set was used to create the sampled distribution.
Conserved LADs
Neural genes in conserved LADs were identified by enriched GO terms from conserved GO analysis containing keywords such as “adhesion”, “potential”, “synapse”, etc. Non-neural genes are the complement of genes in conserved LADs. Promoter sequences, +/− 1 kb of transcription start site were extracted for the primary transcript of each gene as defined by MANE or APPRIS for hg38 and mm10 respectively. Non-neural gene promoter sequences in conserved LADs served as background sequences for enrichment of motifs of neural gene promoter query sequences and vice a versa.
Motif Enrichment
Query and background sequences were used as input for Homer (findMotifsGenome.pl) with region size set to 250 and all others set to default values (Heinz et al 2010)48. GC normalized query and background sequences were extracted from intermediate output and used as input for AME from the MEME suite49 with default parameters. The non-redundant vertebrate motif set of JASPAR version 2020 was used as the motif file.
Extended Data
Extended Data Fig. 1. Gene expression and chromatin features of LADs identified by GO-CaRT in 3T3 MEFs.
a, Venn diagram showing percent overlap of LAD coverage between GO-CaRT and DamID in MEFs. b, Box and whiskers plot depicting average gene expression (RNA-seq- SRX803943, SRX803944) in LADs and inter-LADs defined by GO-CaRT and DamID in MEFs. p= Two-tailed student’s t-test. GO-CaRT LADs, n=4390, inter-LADs, n=30499; DamID LADs, n=5313, inter-LADs, n=29576, n= number of genes. Boxes show the range from lower (25th percentile) to upper quartiles (75th percentile), with the median line (50th percentile); whiskers extend 1.5 times the inter-quartile range from bounds of box. c-e, Average H3K9me2 (c), H3K9me3 (d) and H3K27me3 (e) signal over LADs and flanking regions (400 Kb). Average LaminB signal (red) is also shown in each plot.
Extended Data Fig. 2. Gene density and expression in LADs identified in mouse brain NPCs in vivo.
a, Circos plot showing LaminB enrichment and LADs (horizontal bars) across the mouse chromosomes (1–19) in dorsal and ventral NPCs. b, LAD and inter-LADs gene density in brain NPCs (GO-CaRT) and indicated cultured cell lines (DamID). ASCs, astrocytes., ESCs, embryonic stem cells. c, Box plot depicting average gene expression in LADs (dorsal, n=3683; ventral, n= 3520) and inter-LADs (dorsal, n=18849; ventral, n=19014) as determined by RNA-seq in dorsal and ventral NPCs, n= number of genes. p= Two-tailed students t-test. Boxes show the range from lower (25th percentile) to upper quartiles (75th percentile), with the median line (50th percentile); whiskers extend 1.5 times the inter-quartile range from bounds of box.
Extended Data Fig. 3. Comparison of in vitro and in vivo identified LADs.
a, Venn diagram showing percent overlap of LAD coverage between brain NPCs and in vitro NPCs (DamID). b, Representative micrographs of DNA-FISH (red) with LaminB ICC (green) in brain NPCs and SVZ-cNSCs for four loci previously annotated as cLADs. Scale bar 2 μm. Multiple images were taken to quantitate sub-nuclear localization of the DNA-FISH loci. c, Quantifications of DNA-FISH for loci shown in b. Percentages indicate loci within 0.5 μm (grey area) from the nuclear lamina. 50–60 nuclei were quantified for each locus. d, LaminB GO-CaRT tracks in brain NPCs, SVZ-cNSCs and in vitro NPCs (DamID) over cLAD DNA-FISH loci (dashed box) shown in b. e, LaminB GO-CaRT tracks of brain NPCs, E13 lung, E13 liver, SVZ-cNSCs and 3T3 MEFs. In vitro NPC and cLAD track (shown on top) are DamID derived6. Dashed box indicates a region where some previously annotated “cLADs” are not observed in tissues in vivo but detected by GO-CaRT in SVZ-NSCs and 3T3 MEFs. f, Venn diagram showing percent overlap of LAD coverage between cLADs and LADs common to brain, lung and liver.
Extended Data Fig. 4. Regional differences in LAD architecture of mouse brain NPCs.
a, Heatmap showing gene expression differences (row normalized) of marker genes in dorsal and ventral regions of the E13 mouse forebrain. R1 and R2 indicate two biological replicates. b, Venn diagram showing percent overlap of LAD coverage between dorsal and ventral NPCs. c, LaminB GO-CaRT tracks showing additional examples of brain region-specific LADs (dashed boxes). d, DNA-FISH micrographs of indicated loci in dorsal and ventral NPCs. Nuclear lamina is marked by LaminB1 staining (green). Scale bar 2 μm. Multiple images were taken to quantitate sub-nuclear localization of the DNA-FISH loci. e, Quantifications of DNA-FISH for the loci shown in c. Percentages indicate loci within 0.5 μm (grey area) from the nuclear lamina. 50–60 nuclei were quantified for each locus. f, LaminB GO-CaRT tracks in brain NPCs and in vitro NPCs (DamID) over DNA-FISH loci (dashed boxes) shown in d. g, Percent coverage of SINE and LINE repeat elements in brain region-specific LADs, common LADs and inter-LADs. h, Box plot depicting differential expression of genes that have quantitative differences in LaminB enrichment (top 20 percentile) between ventral vs. dorsal NPCs. LaminB decreased, n=150, LaminB increased, n=150. p= Two-tailed students t-test. Boxes show the range from lower (25th percentile) to upper quartiles (75th percentile), with the median line (50th percentile); whiskers extend 1.5 times the inter-quartile range from bounds of box. i, Top enriched GO-terms (biological process) of differentially expressed genes in dorsal- and ventral-specific LADs. GO terms were sorted based on their significance, -log10(qvalue), the size of the bubble represents the gene ratio for each term.
Extended Data Fig. 5. Regional differences in LAD architecture of human brain NPCs.
a, Schematic of a GW20 human brain (coronal view) showing regions sampled for GO-CaRT and RNA-seq. b, Circos plot showing LaminB enrichment and LADs (horizontal bars) across the human chromosomes (1–22) in GW20 cortex and MGE. c, Heatmap showing gene expression differences (row normalized) of marker genes in GW20 cortex and MGE. R1 and R2 indicate two biological replicates. d, Jaccard similarity matrix of GO-CaRT LADs identified in human cortex and MGE and DamID LADs in indicated cultured cell lines19. e, Venn diagram showing percent overlap of LAD coverage between GW20 cortex and MGE. f, Representative LaminB GO-CaRT profiles of GW20 cortex and MGE. Dashed boxes show brain region-specific LADs. g, Genomic features of human brain region-specific LADs, common LADs and inter-LADs. h, Volcano plot showing differentially expressed genes in GW20 cortex- and MGE- specific LADs. Each dot represents a single gene with its differential gene expression level plotted on the x-axis and statistical significance (q-value<0.5) on y-axis. p= Chi-square goodness of fit test. i, Top enriched GO-terms (biological process) of differentially expressed genes in cortex- and MGE- specific LADs. GO terms were sorted based on their significance, -log10(qvalue), the size of the bubble represents the gene ratio for each term.
Extended Data Fig. 6. Chromatin context of active LAD genes in human cortex and H3K9me2-depleted LAD sub-domains in mouse cortex.
a, H3K9me2, LaminB, ATAC-seq and DNA methylation signal over TSS and surrounding regions for active genes in LADs (TPM>1, red), repressed genes in LADs (TPM<1, turquoise) and genes in inter-LADs (grey) in GW20 human cortex. b, Representative LaminB GO-CaRT tracks showing H3K9me2-depleted LAD sub-domains (marked by dashed boxes) in the mouse cortical/dorsal NPCs. c, Average H3K9me2 and LaminB signal over LADs (blue), H3K9me2-depleted LAD sub-domains (purple) and inter-LADs (grey) in mouse cortical NPCs scaled to the same relative size depicted by a solid horizontal bar. Traces in the 50Kb flanking proximal and distal regions are unscaled. d, Violin plot depicting the size in base pairs (log10) of LADs (n=743) and H3K9me2-depleted LAD sub-domains (n=664) identified in mouse cortical NPCs. e, Average gene expression in LADs (n=3546), H3K9me2-depleted LAD sub-domains (n=799) and inter-LADs (n=18442) in mouse cortical NPCs, n= number of genes. p= Wilcoxon rank sum test. Two-sided. Non-adjusted. Boxes show the range from lower (25th percentile) to upper quartiles (75th percentile), with the median line (50th percentile); whiskers extend 1.5 times the inter-quartile range from bounds of box.
Extended Data Fig. 7. LAD conservation in cortex and MGE across macaque, human and mouse.
a, Circos plot showing LaminB enrichment and LADs (horizontal bars) across the macaque chromosomes (1–20) in PCD80 cortex and MGE. b, Percent LAD coverage in cortex and MGE across human, macaque and mouse. c, Alluvial plot depicting conserved LADs (blue) across human, macaque and mouse cortex using human as anchor species for liftover. Inter-LADs are shown in grey. d, A donut plot depicting conservation of mouse cortex/MGE shared LADs (brown) in macaque and human. Brain region-specific LADs are shown in white. e, Representative LaminB GO-CaRT profiles over LADs that are shared between cortex and MGE across human, macaque and mouse.
Extended Data Fig. 8. Features of neural and non-neural genes in conserved LADs.
a, Gene density in conserved LADs, all LADs, non-conserved LADs and inter-LADs identified based on mouse and human liftover. b, Top enriched GO-terms of genes in conserved LADs based on mouse liftover. GO terms were sorted based on their significance, -log10(qvalue), the size of the bubble represents the gene ratio for each term. BP- Biological Process; MF- Molecular Function. c, Violin plot showing average gene expression in GW20 human cortex for all genes (red, n=1365), neural genes (pink, n=271) and non-neural genes (green, n=1094) in conserved LADs. For comparison expression is also shown for genes in inter-LADs (grey, n=17291). p= Wilcoxon rank sum test. Two-sided. Non-adjusted. d, LaminB signal (human GW20 cortex) over TSS and surrounding regions over the same gene sets as in c. e, Enriched motifs in neural and non-neural gene promoters in human. The size of the circle represents enrichment scores based on the P value from HOMER and color indicates the gene expression of the corresponding TFs in human GW20 cortex.
Extended Data Fig. 9. Gene expression and chromatin features of SPADs, inter-LAD, nonSPADs and LADs in human cortex.
a, Genome-wide scatter plot showing Pearson correlation between SON GO-CaRT in HEK293T cells and SON TSA-seq in K562 cells4. b, Circos plot showing SON GO-CaRT (green) and LaminB GO-CaRT profiles (blue) across the human chromosomes (1–22) in GW20 cortex. SPADs and LADs are shown by green and blue horizontal bars, respectively. c, Violin plot depicting average gene expression in LADs (blue, n=3105), non-speckle inter-LADs (grey, n=9452) and SPADs (green, n=8272) as determined by RNA-seq in GW20 human cortex, n= number of genes. p= Wilcoxon rank sum test. Two-sided. Non-adjusted. d, Average enrichment of various chromatin marks48 in LADs (blue), non-speckle inter-LADs (grey) and SPADs (green) in GW20 cortex. Mean enrichment of chromatin marks over each region scaled to the relative size of each region, which is depicted by the black horizontal. Traces in the 25 Kb flanking proximal and distal regions are unscaled.
Extended Data Fig. 10. DNA-FISH validation of SPADs and TF motif analyses of SPADs and LADs.
a, DNA-FISH micrographs of four SPAD loci in human GW20 cortical cells. Nuclear speckles are marked by SON ICC (green). Scale bar 2 μm, higher magnification 0.5 μm. b, SON and LaminB enrichment for SPAD loci shown in a. c, Quantifications of DNA-FISH for SPAD loci shown in a. Percentages indicate loci within 0.5 μm (grey area) from the nuclear speckles. 50–60 nuclei were quantified for each locus. d, Enriched motif in SPADs and LADs of GW20 cortex. The size of the circle represents enrichment scores based on the P value from HOMER and color indicates the gene expression of the corresponding TFs in GW20 cortex. e, Log odds ratio of enrichment of significant variants overlapping a given genomic compartment with 95% confidence intervals for T2D GWAS, where significant variants are defined as having a GWAS summary statistic of P < 1e-6 (left) or P < 1e-5 (right). Size of circle represents the fraction of significant variants overlapping a genomic compartment. Wald Test. Two-sided. Non-adjusted. Bars represent standard error. LAD, n=704, SPAD, n=1047, inter-LAD, non-SPAD, n=1810.
Supplementary Material
Supplementary Table 1: Sample information used in the study.
Supplementary Table 2: Reproducibility of the biological replicates as calculated by spearman correlation.
Supplementary Table 3: Probes used for DNA-FISH and their genomic coordinates.
Acknowledgements
The authors thank Steven Henikoff laboratory (Fred Hutchinson Cancer Research Center) for providing aliquots of pA-MNase. Aparna Bhaduri and Tanzila Mukhtar (UCSF) for her help with primary human tissue samples. Navneet K. Matharu (UCSF) for suggesting the name GO-CaRT and helpful discussions throughout the writing of this manuscript.
Funding
Supported by NIH grants NIH 1R01-NS112357, NIH 1R01NS091544, VA 5I01 BX000252, support from the Chad Tough Foundation, The Childhood Brain Tumor Foundation, and the Pathway for Breakthrough in Biomedical Research (PBBR), UCSF (to D.A.L.); 5T32HD007470; and 5T32CA151022P. “The funders had no role in study design, data collection and analysis, decision to publish or preparation of the manuscript.”
Footnotes
Data Availability
The datasets generated during the current study will be available on GEO repository prior to the time of publication.
Code Availability
All codes for processing and analyzing the data presented in this work are available on reasonable request.
Competing Interests
The authors declare no competing interests
References
- 1.Fraser P & Bickmore W Nuclear organization of the genome and the potential for gene regulation. Nature 447, 413–417, doi: 10.1038/nature05916 (2007). [DOI] [PubMed] [Google Scholar]
- 2.Zhao R, Bodnar MS & Spector DL Nuclear neighborhoods and gene expression. Curr Opin Genet Dev 19, 172–179, doi: 10.1016/j.gde.2009.02.007 (2009). [DOI] [PMC free article] [PubMed] [Google Scholar]
- 3.van Steensel B & Belmont AS Lamina-Associated Domains: Links with Chromosome Architecture, Heterochromatin, and Gene Repression. Cell 169, 780–791, doi: 10.1016/j.cell.2017.04.022 (2017). [DOI] [PMC free article] [PubMed] [Google Scholar]
- 4.Chen Y et al. Mapping 3D genome organization relative to nuclear compartments using TSA-Seq as a cytological ruler. J Cell Biol 217, 4025–4048, doi: 10.1083/jcb.201807108 (2018). [DOI] [PMC free article] [PubMed] [Google Scholar]
- 5.Lamond AI & Spector DL Nuclear speckles: a model for nuclear organelles. Nat Rev Mol Cell Biol 4, 605–612, doi: 10.1038/nrm1172 (2003). [DOI] [PubMed] [Google Scholar]
- 6.Peric-Hupkes D et al. Molecular maps of the reorganization of genome-nuclear lamina interactions during differentiation. Mol Cell 38, 603–613, doi: 10.1016/j.molcel.2010.03.016 (2010). [DOI] [PMC free article] [PubMed] [Google Scholar]
- 7.Poleshko A et al. Genome-Nuclear Lamina Interactions Regulate Cardiac Stem Cell Lineage Restriction. Cell 171, 573–587 e514, doi: 10.1016/j.cell.2017.09.018 (2017). [DOI] [PMC free article] [PubMed] [Google Scholar]
- 8.Robson MI et al. Tissue-Specific Gene Repositioning by Muscle Nuclear Membrane Proteins Enhances Repression of Critical Developmental Genes during Myogenesis. Mol Cell 62, 834–847, doi: 10.1016/j.molcel.2016.04.035 (2016). [DOI] [PMC free article] [PubMed] [Google Scholar]
- 9.Guelen L et al. Domain organization of human chromosomes revealed by mapping of nuclear lamina interactions. Nature 453, 948–951, doi: 10.1038/nature06947 (2008). [DOI] [PubMed] [Google Scholar]
- 10.Vogel MJ, Peric-Hupkes D & van Steensel B Detection of in vivo protein-DNA interactions using DamID in mammalian cells. Nat Protoc 2, 1467–1478, doi: 10.1038/nprot.2007.148 (2007). [DOI] [PubMed] [Google Scholar]
- 11.Skene PJ & Henikoff S An efficient targeted nuclease strategy for high-resolution mapping of DNA binding sites. Elife 6, doi: 10.7554/eLife.21856 (2017). [DOI] [PMC free article] [PubMed] [Google Scholar]
- 12.Harr JC et al. Directed targeting of chromatin to the nuclear lamina is mediated by chromatin state and A-type lamins. J Cell Biol 208, 33–52, doi: 10.1083/jcb.201405110 (2015). [DOI] [PMC free article] [PubMed] [Google Scholar]
- 13.Wu F & Yao J Identifying Novel Transcriptional and Epigenetic Features of Nuclear Lamina-associated Genes. Sci Rep 7, 100, doi: 10.1038/s41598-017-00176-x (2017). [DOI] [PMC free article] [PubMed] [Google Scholar]
- 14.Yu TS, Zhang G, Liebl DJ & Kernie SG Traumatic brain injury-induced hippocampal neurogenesis requires activation of early nestin-expressing progenitors. J Neurosci 28, 12901–12912, doi: 10.1523/JNEUROSCI.4629-08.2008 (2008). [DOI] [PMC free article] [PubMed] [Google Scholar]
- 15.Borsos M et al. Genome-lamina interactions are established de novo in the early mouse embryo. Nature 569, 729–733, doi: 10.1038/s41586-019-1233-0 (2019). [DOI] [PMC free article] [PubMed] [Google Scholar]
- 16.Hebert JM & Fishell G The genetics of early telencephalon patterning: some assembly required. Nat Rev Neurosci 9, 678–685, doi: 10.1038/nrn2463 (2008). [DOI] [PMC free article] [PubMed] [Google Scholar]
- 17.Puelles L & Rubenstein JL Forebrain gene expression domains and the evolving prosomeric model. Trends Neurosci 26, 469–476, doi: 10.1016/S0166-2236(03)00234-0 (2003). [DOI] [PubMed] [Google Scholar]
- 18.Delgado RN & Lim DA Maintenance of Positional Identity of Neural Progenitors in the Embryonic and Postnatal Telencephalon. Front Mol Neurosci 10, 373, doi: 10.3389/fnmol.2017.00373 (2017). [DOI] [PMC free article] [PubMed] [Google Scholar]
- 19.van Schaik T, Vos M, Peric-Hupkes D, Hn Celie P & van Steensel B Cell cycle dynamics of lamina-associated DNA. EMBO Rep 21, e50636, doi: 10.15252/embr.202050636 (2020). [DOI] [PMC free article] [PubMed] [Google Scholar]
- 20.Leemans C et al. Promoter-Intrinsic and Local Chromatin Features Determine Gene Repression in LADs. Cell 177, 852–864 e814, doi: 10.1016/j.cell.2019.03.009 (2019). [DOI] [PMC free article] [PubMed] [Google Scholar]
- 21.Workman AD, Charvet CJ, Clancy B, Darlington RB & Finlay BL Modeling transformations of neurodevelopmental sequences across mammalian species. J Neurosci 33, 7368–7383, doi: 10.1523/JNEUROSCI.5746-12.2013 (2013). [DOI] [PMC free article] [PubMed] [Google Scholar]
- 22.Meuleman W et al. Constitutive nuclear lamina-genome interactions are highly conserved and associated with A/T-rich sequence. Genome Res 23, 270–280, doi: 10.1101/gr.141028.112 (2013). [DOI] [PMC free article] [PubMed] [Google Scholar]
- 23.Sun Z et al. EGR1 recruits TET1 to shape the brain methylome during development and upon neuronal activity. Nat Commun 10, 3892, doi: 10.1038/s41467-019-11905-3 (2019). [DOI] [PMC free article] [PubMed] [Google Scholar]
- 24.Preciados M, Yoo C & Roy D Estrogenic Endocrine Disrupting Chemicals Influencing NRF1 Regulated Gene Networks in the Development of Complex Human Brain Diseases. Int J Mol Sci 17, doi: 10.3390/ijms17122086 (2016). [DOI] [PMC free article] [PubMed] [Google Scholar]
- 25.Han H et al. Multilayered Control of Alternative Splicing Regulatory Networks by Transcription Factors. Mol Cell 65, 539–553 e537, doi: 10.1016/j.molcel.2017.01.011 (2017). [DOI] [PubMed] [Google Scholar]
- 26.Iotchkova V et al. GARFIELD classifies disease-relevant genomic features through integration of functional annotations with association signals. Nat Genet 51, 343–353, doi: 10.1038/s41588-018-0322-6 (2019). [DOI] [PMC free article] [PubMed] [Google Scholar]
- 27.Pardinas AF et al. Common schizophrenia alleles are enriched in mutation-intolerant genes and in regions under strong background selection. Nat Genet 50, 381–389, doi: 10.1038/s41588-018-0059-2 (2018). [DOI] [PMC free article] [PubMed] [Google Scholar]
- 28.Grove J et al. Identification of common genetic risk variants for autism spectrum disorder. Nat Genet 51, 431–444, doi: 10.1038/s41588-019-0344-8 (2019). [DOI] [PMC free article] [PubMed] [Google Scholar]
- 29.Morris AP et al. Large-scale association analysis provides insights into the genetic architecture and pathophysiology of type 2 diabetes. Nat Genet 44, 981–990, doi: 10.1038/ng.2383 (2012). [DOI] [PMC free article] [PubMed] [Google Scholar]
- 30.Gandal MJ et al. Transcriptome-wide isoform-level dysregulation in ASD, schizophrenia, and bipolar disorder. Science 362, doi: 10.1126/science.aat8127 (2018). [DOI] [PMC free article] [PubMed] [Google Scholar]
- 31.Markenscoff-Papadimitriou E et al. A Chromatin Accessibility Atlas of the Developing Human Telencephalon. Cell 182, 754–769 e718, doi: 10.1016/j.cell.2020.06.002 (2020). [DOI] [PMC free article] [PubMed] [Google Scholar]
- 32.Won H et al. Chromosome conformation elucidates regulatory relationships in developing human brain. Nature 538, 523–527, doi: 10.1038/nature19847 (2016). [DOI] [PMC free article] [PubMed] [Google Scholar]
- 33.Yokochi T et al. G9a selectively represses a class of late-replicating genes at the nuclear periphery. Proc Natl Acad Sci U S A 106, 19363–19368, doi: 10.1073/pnas.0906142106 (2009). [DOI] [PMC free article] [PubMed] [Google Scholar]
- 34.Kind J et al. Single-cell dynamics of genome-nuclear lamina interactions. Cell 153, 178–192, doi: 10.1016/j.cell.2013.02.028 (2013). [DOI] [PubMed] [Google Scholar]
- 35.Jaffe AE et al. Developmental and genetic regulation of the human cortex transcriptome illuminate schizophrenia pathogenesis. Nat Neurosci 21, 1117–1125, doi: 10.1038/s41593-018-0197-y (2018). [DOI] [PMC free article] [PubMed] [Google Scholar]
- 36.Bannister AJ & Kouzarides T Regulation of chromatin by histone modifications. Cell Res 21, 381–395, doi: 10.1038/cr.2011.22 (2011). [DOI] [PMC free article] [PubMed] [Google Scholar]
- 37.Jiang C & Pugh BF Nucleosome positioning and gene regulation: advances through genomics. Nat Rev Genet 10, 161–172, doi: 10.1038/nrg2522 (2009). [DOI] [PMC free article] [PubMed] [Google Scholar]
- 38.Dixon JR et al. Topological domains in mammalian genomes identified by analysis of chromatin interactions. Nature 485, 376–380, doi: 10.1038/nature11082 (2012). [DOI] [PMC free article] [PubMed] [Google Scholar]
- 39.Nowakowski TJ et al. Spatiotemporal gene expression trajectories reveal developmental hierarchies of the human cortex. Science 358, 1318–1323, doi: 10.1126/science.aap8809 (2017). [DOI] [PMC free article] [PubMed] [Google Scholar]
- 40.Lim DA et al. Chromatin remodelling factor Mll1 is essential for neurogenesis from postnatal neural stem cells. Nature 458, 529–533, doi: 10.1038/nature07726 (2009). [DOI] [PMC free article] [PubMed] [Google Scholar]
- 41.Skene PJ, Henikoff JG & Henikoff S Targeted in situ genome-wide profiling with high efficiency for low cell numbers. Nat Protoc 13, 1006–1019, doi: 10.1038/nprot.2018.015 (2018). [DOI] [PubMed] [Google Scholar]
- 42.Lund E, Oldenburg AR & Collas P Enriched domain detector: a program for detection of wide genomic enrichment domains robust against local variations. Nucleic Acids Res 42, e92, doi: 10.1093/nar/gku324 (2014). [DOI] [PMC free article] [PubMed] [Google Scholar]
- 43.Stovner EB & Saetrom P epic2 efficiently finds diffuse domains in ChIP-seq data. Bioinformatics 35, 4392–4393, doi: 10.1093/bioinformatics/btz232 (2019). [DOI] [PubMed] [Google Scholar]
- 44.Brahma S & Henikoff S RSC-Associated Subnucleosomes Define MNase-Sensitive Promoters in Yeast. Mol Cell 73, 238–249 e233, doi: 10.1016/j.molcel.2018.10.046 (2019). [DOI] [PMC free article] [PubMed] [Google Scholar]
- 45.Ramirez F et al. deepTools2: a next generation web server for deep-sequencing data analysis. Nucleic Acids Res 44, W160–165, doi: 10.1093/nar/gkw257 (2016). [DOI] [PMC free article] [PubMed] [Google Scholar]
- 46.Park DH et al. Activation of neuronal gene expression by the JMJD3 demethylase is required for postnatal and adult brain neurogenesis. Cell Rep 8, 1290–1299, doi: 10.1016/j.celrep.2014.07.060 (2014). [DOI] [PMC free article] [PubMed] [Google Scholar]
- 47.Mirzadeh Z, Merkle FT, Soriano-Navarro M, Garcia-Verdugo JM & Alvarez-Buylla A Neural stem cells confer unique pinwheel architecture to the ventricular surface in neurogenic regions of the adult brain. Cell Stem Cell 3, 265–278, doi: 10.1016/j.stem.2008.07.004 (2008). [DOI] [PMC free article] [PubMed] [Google Scholar]
- 48.Heinz S et al. Simple combinations of lineage-determining transcription factors prime cis-regulatory elements required for macrophage and B cell identities. Mol Cell 38, 576–589, doi: 10.1016/j.molcel.2010.05.004 (2010). [DOI] [PMC free article] [PubMed] [Google Scholar]
- 49.McLeay RC & Bailey TL Motif Enrichment Analysis: a unified framework and an evaluation on ChIP data. BMC Bioinformatics 11, 165, doi: 10.1186/1471-2105-11-165 (2010). [DOI] [PMC free article] [PubMed] [Google Scholar]
Associated Data
This section collects any data citations, data availability statements, or supplementary materials included in this article.
Supplementary Materials
Supplementary Table 1: Sample information used in the study.
Supplementary Table 2: Reproducibility of the biological replicates as calculated by spearman correlation.
Supplementary Table 3: Probes used for DNA-FISH and their genomic coordinates.