

Summary
Mitochondria constantly undergo fusion and fission events, referred as mitochondrial dynamics, which determine mitochondrial architecture and bioenergetics. Cultured cell studies demonstrate that mitochondrial dynamics are acutely regulated by phosphorylation of the mitochondrial fission orchestrator dynamin-related protein 1 (Drp1) at S579 or S600. However, the physiological impact and crosstalk of these phosphorylation sites is poorly understood. Here, we describe the functional interrelation between S579 and S600 phosphorylation sites in vivo and their role on mitochondrial remodeling. Mice carrying a homozygous Drp1 S600A knockin (Drp1 KI) mutation display larger mitochondria and enhanced lipid oxidation and respiratory capacities, granting improved glucose tolerance and thermogenic response upon high-fat feeding. Housing mice at thermoneutrality blunts these differences, suggesting a role for the brown adipose tissue in the protection of Drp1 KI mice against metabolic damage. Overall, we demonstrate crosstalk between Drp1 phosphorylation sites and provide evidence that their modulation could be used in the treatment and prevention of metabolic diseases.
Keywords: mitochondrial dynamics, Drp1, mitochondrial respiration, insulin resistance, brown adipose tissue, thermoneutrality, metabolic syndrome, phosphorylation
Graphical abstract
Highlights
-
•
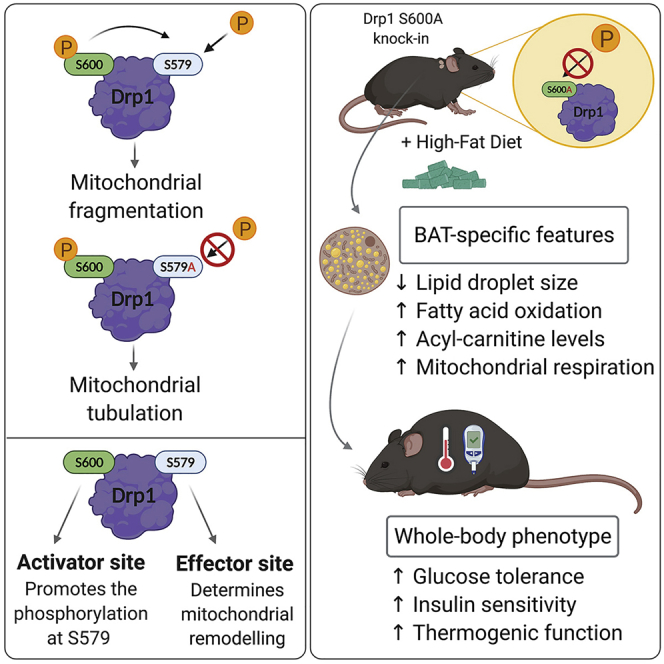
Drp1 phosphorylation at S600 promotes the phosphorylation at the S579 site
-
•
Both Drp1 P-S600 and P-S579 are required for maximal mitochondrial fragmentation
-
•
Drp1 S600A knockin mice are protected against diet-induced metabolic damage
-
•
Drp1 phosphorylation controls brown adipose tissue thermogenic capacity in mice
Valera-Alberni et al. show that in mouse cells and tissues, Drp1 phosphorylation at S600 prompts the downstream phosphorylation of S579, triggering mitochondrial fission. Accordingly, Drp1 S600A knockin (Drp1 KI) mice display enlarged mitochondria. Metabolically, Drp1 KI mice show increased lipid oxidation capacity and are protected against diet-induced metabolic disease.
Introduction
Mitochondria are highly interconnected organelles capable of continuously changing their morphology in response to metabolic cues (Picard et al., 2013; Wai and Langer, 2016). Mitochondrial bioenergetics are intimately linked to mitochondrial morphology, which continuously transitions from long tubulated threads to fragmented granules in a process known as mitochondrial dynamics (Liesa et al., 2009).
The rates of mitochondrial fragmentation (fission) or mitochondrial fusion vary among cell types and tissues, but the key protein machineries accounting for these processes are widely conserved through evolution. In mammals, fusion of the outer mitochondrial membrane (OMM) is mediated by the dynamin-like guanosine triphosphatase (GTPase) enzymes Mitofusin 1 and Mitofusin 2 (Mfn1 and Mfn2, respectively) (Liesa et al., 2009). In addition, the dynamin-like GTPase optic atrophy 1 (Opa1) mediates fusion of the inner mitochondrial membrane (IMM) upon OMM fusion (Liesa et al., 2009). However, mitochondrial fission depends on another GTPase enzyme, dynamin-related protein 1 (Drp1). Predominantly located in the cytosol, Drp1 is recruited to the OMM to prime fission events. Drp1 assembly and oligomerization in the OMM lead to the formation of a spiral that constricts mitochondria, resulting in mitochondrial fragmentation (Kraus and Ryan, 2017). The dynamic recruitment of Drp1 at the OMM and its GTPase activity are highly influenced by post-translational modifications, including ubiquitination (Wang et al., 2011), SUMOylation (Wasiak et al., 2007), or phosphorylation (Chang and Blackstone, 2010). Among them, the phosphorylation of Drp1 at S600 (P-S600) (Chang and Blackstone, 2007; Cribbs and Strack, 2007) and phosphorylation of Drp1 at S579 (P-S579) (Taguchi et al., 2007) (in mouse Drp1 isoform 3; equivalent to S643/S622 in mouse Drp1 isoform 1 and S637/S616 in human Drp1 isoform 1, respectively) has gained the most attention.
Drp1 phosphorylation at S579 is generally catalyzed by the cyclin dependent kinase 1 (Cdk1/cyclin B) (Taguchi et al., 2007), although S579 can also be the substrate for other kinases, such as the extracellular signal-regulated kinases (ERK1/2) (Kashatus et al., 2015; Serasinghe et al., 2015), protein kinase C δ (PKCδ) (Qi et al., 2011), and Cdk5 (Strack et al., 2013). S579 phosphorylation has been associated with Drp1 translocation to the mitochondria during mitosis, in which mitochondrial fission ensures balanced mitochondrial segregation to the daughter cells (Taguchi et al., 2007). In contrast to S579, the functional outcome of S600 phosphorylation on Drp1 activity remains controversial. Drp1 phosphorylation at S600 upon activation of cyclic AMP (cAMP)-dependent protein kinase A (PKA) has been shown to hamper mitochondrial fission by preventing Drp1 recruitment to the mitochondria (Chang and Blackstone, 2007; Cribbs and Strack, 2007). However, phosphorylation of the same serine residue by the Rho-associated coiled-coil kinase 1 (ROCK1) (Wang et al., 2012) or Ca2+/calmodulin-dependent protein kinase Iα (CaMKIα) (Han et al., 2008) results in increased mitochondrial fission. In addition, Drp1 phosphorylation in response to norepinephrine, leading to PKA activation, triggered mitochondrial fragmentation in primary brown adipocytes (Wikstrom et al., 2014). Therefore, a better understanding of the role of S600 phosphorylation and its relation to other modifications, such as S579 phosphorylation, is needed to understand the acute regulation of Drp1-mediated fission. In addition, most previously mentioned observations were done in cultured cells. Thus, the physiological regulation and implications of these phosphorylation events in situations of health and disease are largely unknown.
Here we report how Drp1 phosphorylation at S600 acted as an upstream event for S579 phosphorylation in mouse cells and tissues, leading to mitochondrial fragmentation. To investigate the physiological relevance of these phosphorylation sites, we developed a whole-body Drp1 knockin (KI) mouse model bearing a serine (S) to alanine (A) mutation at the S600 site (hereafter called Drp1 KI). Drp1 KI mice manifested increased mitochondrial respiratory capacity in multiple tissues and higher whole-body utilization of lipids as energy substrate. Upon high-fat diet (HFD) feeding, Drp1 KI mice were protected against glucose intolerance and displayed higher thermogenic capacity. Hence, our work unveils an unsuspected relation between S600 and S579 phosphorylation and suggests that manipulating Drp1 phosphorylation levels could be a strategy to target diet-related metabolic diseases.
Results
Drp1 P-S600 and P-S579 occur simultaneously in mouse cells and tissues
Phosphorylation of Drp1 S600 can be catalyzed by PKA in response to increases in intracellular cAMP levels (Chang and Blackstone, 2007; Cribbs and Strack, 2007). To evaluate the impact of PKA activation on Drp1 S600 phosphorylation in mouse tissues, we treated wild-type (WT) mice with the adrenergic β3-selective agonist CL316,243. This led to an increase in Drp1 P-S600 in brown adipose tissue (BAT) that was accompanied by an increase in Drp1 S579 phosphorylation (Figure 1A). To rule out tissue-specific effects, we also analyzed the response to PKA activation in other tissues. For this, we treated mice with glucagon and isoproterenol to promote Drp1 P-S600 in liver and muscle, respectively (Figure 1A). The results in these two additional tissues corroborated that PKA triggered the phosphorylation of both S600 and S579 (Figure 1A). Given that these two phosphorylation sites have been reported to oppositely influence Drp1 function (Otera et al., 2013), our results raised the question of whether they were both occurring in the same Drp1 proteoforms or individually in different pools of Drp1 proteins. To answer this question, we performed liquid chromatography-mass spectrometry (LC-MS) analyses in phospho-Drp1 immunoprecipitates from BAT of vehicle- or CL316,243-treated mice following digestion with endoproteinase Glu-C. To fully ascertain the identity of the detected peptides, we used an isotopically labeled doubly phosphorylated synthetic peptide as a reference standard. Pulling down Drp1 P-S579 (Figure S1A) or P-S600 (Figure 1B) CL316,243-treated mice revealed presence of the targeted peptide that showed liquid chromatography (LC) retention time and fragmentation patterns upon tandem MS (MS/MS) that were similar to those of the reference standard. The peptide could not be detected in vehicle-treated mice. Thus, these results certify that upon PKA stimulation, S600 and S579 phosphorylation sites occurred on the same Drp1 molecular form.
Figure 1.

Drp1 phosphorylation at S600 and S579 occurs simultaneously and prompts mitochondrial fission
(A) C57BL/6NTac male mice were intraperitoneally injected with saline (as vehicle), CL316,243 (1 mg/kg; 1 h), glucagon (1 mg/kg; 15 min), or isoproterenol (10 mg/kg; 15 min) in three experiments (n = 3 mice per condition). Then, tissues were extracted and snap frozen to evaluate Drp1 phosphorylation levels.
(B) 8-week-old mice were intraperitoneally injected with either saline (as vehicle) or CL316,243 (1 mg/kg; 1 h). Then, BAT was collected and flash frozen. After obtaining protein homogenates, 10 mg of proteins were used for immunoprecipitation, using antibodies against Drp1 P-S600. The immunoprecipitated material was digested with Glu-C and then used for LC-MS/MS analysis. As control, the isotopically labeled form of the doubly phosphorylated peptide KSKPIPIMPAS[Phos]PQKGHAVNLLDVPVPVARKLS[Phos]ARE was spiked in the samples. The graph illustrates the profiles of the 5 most intensely detected fragments from peptide precursors with a charge of +6 and how CL316,243 treatment exhibits similar detection patterns to the reference standard peptide.
(C) Drp1 KO MEFs were transfected with wild-type (WT), S600A, or S600E forms of Drp1. Then, 48 h later, protein extracts were obtained to evaluate Drp1 phosphorylation levels.
(D) Drp1 KO MEFs were transfected with either S600A or S600E forms of Drp1. Then, cells were treated with 60 μM roscovitine for the indicated time points, and protein samples were collected to examine the indicated markers. The percentage of Drp1 P-S579 levels is representative of n = 3 experiments.
All values are presented as mean ± SEM. ∗p < 0.05, ∗∗p < 0.01, and ∗∗∗p < 0.001 (two-tailed Student’s t test) between the indicated groups. See also Figure S1.
We next aimed to evaluate whether these simultaneous phosphorylation events also took place upon physiological stimuli. Confirming this point, cold exposure increased P-S600 and P-S579 levels in brown adipose tissue (Figure S1B). Similarly, fasting was characterized by a simultaneous increase in P-S600 and P-S579 in skeletal muscle (Figure S1C). Hence, Drp1 S600 and Drp1 S579 occur in parallel upon pharmacological or physiological PKA activation in mouse tissues.
Given that S579 does not meet the consensus sequence to be a direct PKA target and that it is not phosphorylated by PKA in in vitro assays (Chang and Blackstone, 2007; Cribbs and Strack, 2007), we next aimed to understand why S579 phosphorylation changed in response to PKA activation. This could occur if PKA promoted the activation of other kinase/phosphatase enzymes or by an intrinsic role of S600 in influencing S579 phosphorylation turnover. To answer this question, we transfected Drp1 knockout (KO) mouse embryonic fibroblasts (MEFs) with plasmids encoding for a WT Drp1 form, a S600 phospho null form (S600A), or a phospho-mimetic form (S600E or S600D) and then analyzed P-S579 levels. In line with the observations in mouse tissues, the phospho-mimetic S600E or S600D forms of Drp1 displayed increased Drp1 S579 phosphorylation levels compared with the WT of phospho null forms (Figure 1C; Figure S1D). The increase in Drp1 P-S579 was not related to altered cell-cycle or Cdk activity, because markers such as P-Cdk1 or the phosphorylation of a canonical Cdk substrate, the retinoblastoma (Rb) protein, were unaltered (Figure S1E). These results indicate that the increased P-S579 can be triggered by mimicking S600 phosphorylation, even in the absence of PKA activation. We did not observe significant change in Drp1 P-S600 when using phospho-mimetic form of Drp1 S579 (Drp1 S579E or Drp1 S579D) (Figure S1E). This indicates that Drp1 S600 phosphorylation promotes the phosphorylation of S579, but not vice versa.
The preceding results suggest that P-S600 could influence the phosphorylation turnover of S579. To evaluate this point, we treated Drp1 KO MEF cells transfected with Drp1 S600A or S600E with roscovitine, a Cdk inhibitor. In Drp1 S600A-transfected cells, roscovitine led to a large reduction not only in the phosphorylation of canonical targets, such as Cdk1 and Rb, but also of Drp1 S579 (Figure 1D). In contrast, Drp1 P-S579 levels were highly sustained in cells transfected with the Drp1 S600E form (Figure 1D). Importantly, P-Cdk1 and P-Rb levels decreased to a similar extent after roscovitine treatment in both S600A- and S600E-transfected cells, indicating that the S600E form did not alter the inhibitory effect of the drug on Cdk activity. These results suggest that Drp1 S600 phosphorylation protects against S579 dephosphorylation. However, we cannot fully rule out at this stage that S600 phosphorylation or mutation to glutamic acid might facilitate the accessibility of S579 to its upstream kinases.
Drp1 phosphorylation sites interplay in the regulation of mitochondrial fission
Given the conflicting views in the literature on the role of Drp1 phosphorylation sites on mitochondrial fission, we aimed to determine the impact of the Drp1 S600 and S579 phosphorylation sites on mitochondrial morphology in our experimental settings. For this, we performed imaging analysis of Drp1 KO MEFs expressing bicistronically mitochondrial dsRed (mtdsRed) and either Drp1 WT or the different phospho mutant forms. The correct expression of these vectors was validated by western blot analyses (Figure S2A). Compared with Drp1 KO MEFs expressing the WT-mtdsRed plasmid, we observed increased mitochondrial fragmentation when expressing S600E-mtdsRed (Figures 2A and 2B). This was matched by increased mitochondrial circularity and a decreased mitochondrial major-to-minor axis ratio (aspect ratio; Figures 2C and 2D). The expression of the double-phospho-mimetic Drp1 S600E/S579E increased mitochondrial fragmentation and modified mitochondrial appearance to a similar extent to that observed in cells expressing the S600E-mtdsRed form (Figure 2). This is logical, because we have previously shown that the S600E mutation induced higher S579 phosphorylation levels (Figure 1C). The S579E-mtdsRed form also led to mitochondrial fragmentation, although to a lesser extent to that observed with the S600E and S600E/S579E forms (Figure 2). In addition, this moderate effect of the S579E mutation on mitochondrial fragmentation was prevented by the simultaneous mutation of S600 to alanine, suggesting a permissive role for S600 in S579 phosphorylation-driven mitochondrial fission (Figure 2).
Figure 2.

The simultaneous phosphorylation at both S600 and S579 is required to trigger mitochondrial fission
(A) Drp1 KO MEFs were transfected with empty vector mtdsRed (EV), wild-type Drp1 (WT), or the indicated Drp1 phospho mutant plasmids bicistronically expressed with mtdsRed. After 24 h, mitochondrial morphology was measured by live fluorescence imaging (scale bar applies to all images on the left column: 20 μm).
(B–D) Quantifications for mitochondrial length (B), circularity (C), and aspect ratio (D), as the mean of n = 3 independent experiments, counting approximately 50 cells per experiment. The statistically significant difference is indicated versus the WT group.
All values are presented as mean ± SEM. ∗p < 0.05, ∗∗p < 0.01, ∗∗∗p < 0.001 (two-tailed Student’s t test). See also Figure S2.
Given that S600 phosphorylation triggers S579 phosphorylation, we finally aimed to elucidate whether S600 phosphorylation could promote mitochondrial fragmentation independently of the S579 site. For that, we generated a plasmid encoding for a S600E/S579A Drp1 form. Strikingly, cells expressing this form displayed increased mitochondrial tubulation (Figure 2). Similarly, we observed mitochondrial elongation for cells expressing the single-mutated S579A and S600A plasmids (Figure 2). Overall, these results suggest that (1) the phosphorylation of Drp1 S600 is an upstream event for the phosphorylation at Drp1 S579, (2) maximal Drp1-related mitochondrial fission activity is only achieved when the two residues are phosphorylated, and (3) if S579 phosphorylation is impeded, S600 phosphorylation leads to mitochondrial tubulation instead of fission.
We next evaluated how Drp1 phosphorylation sites contribute to the changes in mitochondrial architecture observed upon starvation. Nutrient deprivation has been demonstrated to promote mitochondrial elongation in cultured cells (Gomes et al., 2011; Rambold et al., 2011). Therefore, we used this paradigm for our experiments. In line with previous research, Drp1 KO MEFs expressing the Drp1 WT-mtdsRed form presented higher mitochondrial elongation 2 h after being shifted to Hank’s balanced salt solution (HBSS) (Figure S2B). Cells expressing the S600E or S600E/S579E forms also underwent mitochondrial elongation when cultured on starvation media, but they did so to a lesser degree than cells transfected with Drp1 WT (Figure S2B). In contrast, S579E-mtdsRed did show comparable percentages of elongated mitochondria to those observed in cells expressing the WT form (Figure S2B). These results indicate that Drp1 phosphorylation at either S600 or S579 cannot fully oppose starvation-induced mitochondrial fusion.
S600 phosphorylation is required for S579 phosphorylation in vivo
Our results using phospho-mimetic Drp1 forms suggest that S600 can act upstream of S579 phosphorylation. However, phospho-mimetic forms do not always recapitulate the consequences of real regulated phosphorylation events. Therefore, to evaluate the regulation and functional consequences of Drp1 phosphorylation sites in vivo, we generated a whole-body Drp1 KI mutant mouse model harboring a site-specific S to A mutation at S600 (Figure 3A; see STAR Methods). The Drp1 KI mice were viable and fertile, and they showed no developmental abnormalities. The S600A mutation did not lead to changes in total Drp1 protein levels in the tissues examined (Figure 3B) or in global Drp1 distribution on basal conditions (Figure S3A). We also analyzed in BAT the levels of other enzymes involved in mitochondrial dynamics, namely, Mfn1, Mfn2, and Opa1, although no differences were observed between Drp1 KI and WT mice (Figure S3B). Complementarily, the protein levels of mitochondrial receptors for Drp1, Mff, and Fis1 did not differ between genotypes (Figure S3B). We also analyzed the expression levels of the peroxisome markers Pex3 and Pex5, which have been previously associated with Drp1 function (Tanaka et al., 2019). However, the Drp1 S600A mutation did not alter the protein expression levels of Pex3 and Pex5, indicating that peroxisomal biogenesis is not overtly affected in the Drp1 KI mice (Figure S3B).
Figure 3.

The Drp1 KI mouse model presents impaired S579 phosphorylation and increased mitochondrial elongation
(A) Scheme of the Drp1-targeting vector, the locus after insertion, and the Drp1 KI model after CRE recombination. hGHpA, human growth hormone polyadenylation signal.
(B) Tissue samples from WT and Drp1 KI mice were collected and used to evaluate Drp1 protein levels.
(C) WT and Drp1 KI male mice were treated with CL316,243 (1 mg/kg; 1 h) before collecting BAT and evaluating the protein lysates for Drp1 total and Drp1 phosphorylation levels (n = 3 mice per condition).
(D) Electron microscopy (EM) images from BAT (scale bar: 2 μm) of male WT and Drp1 KI mice.
(E) Mitochondrial profile area, mitochondrial volume density, and frequency distributions were calculated from EM images of the experiment in (D), corresponding to 20 independent images per BAT sample (n = 4 mice per genotype).
All values are presented as mean ± SEM. ∗∗∗p < 0.001 (two-tailed Student’s t test) between the indicated groups. See also Figure S3.
When Drp1 KI mice were challenged with CL316,243, the phosphorylation of S600 was blunted in BAT (Figure 3C). Supporting that S579 occurs downstream of S600 phosphorylation, P-S579 in the BAT was compromised after CL316,243 treatment in Drp1 KI mice (Figure 3C), irrespectively of their gender (Figures S3C and S3D). The activities of other kinases related to S600 and S579 phosphorylation, such as ROCK1 (Wang et al., 2012), ERK (Kashatus et al., 2015), and Cdk1 (Taguchi et al., 2007) were not altered in Drp1 KI mice, based on the levels of P-MYPT1, P-ERK, and P-Cdk1, respectively (Figure S3E). These results suggest that failure to engage S579 phosphorylation in the KI mice after PKA stimulation is not due to defective activities of putative kinases for this residue. To validate our results in a second tissue, we analyzed the response to cAMP induction by glucagon in the liver of Drp1 KI mice. The results illustrated that glucagon-induced Drp1 S600 and S579 phosphorylation was largely impaired in the livers from Drp1 KI mice (Figure S3F). Overall, these results confirm the effectiveness of our knockin strategy and indicate that the phosphorylation of S600 acts upstream of S579 phosphorylation in mouse tissues.
We next aimed to characterize the impact of the Drp1 S600A mutation on mitochondrial architecture in vivo. To address this, we performed electron microscopy (EM) analyses on BAT (Figure 3D). EM pictures showed increased mitochondrial profile areas and mitochondrial volume density in the Drp1 KI mice (Figure 3E). Nevertheless, we still observed a significant population of fragmented mitochondria in the BAT of Drp1 KI mice. This supports our previous observations in MEFs, suggesting that Drp1 phosphorylation acts as an accelerator rather than a switch for Drp1 fission-related activity. In cultured fibroblasts, as well as in primary brown adipocytes (Wikstrom et al., 2014), Drp1 phosphorylation triggers mitochondrial fission, which is congruent with the mitochondrial elongation observed in the BAT of our Drp1 KI mice.
Altogether, these data suggest that Drp1 S600 phosphorylation leads to S579 phosphorylation in mouse tissues and that their absence tilts mitochondrial architecture toward higher elongation.
Drp1 S600A KI mice show higher rates of lipid utilization as an energy source
The Drp1 KI mice fed on a low-fat diet (LFD) were physically undistinguishable from the WT littermates in terms of body weight (Figure 4A) and body composition (Figure 4B). The weights of tissues from the Drp1 KI mice, such as BAT, liver, epididymal and subcutaneous white adipose tissue (eWAT and scWAT, respectively), and heart, were similar to those of WT mice (Figure S4A). Drp1 KI mice displayed normal daily activity (Figure 4C) and food intake (Figure S4B). Glucose tolerance and insulin responsiveness were also similar between genotypes (Figures 4D and 4E). Strikingly, we observed increased mitochondrial respiration in the liver and BAT from Drp1 KI mice (Figures 4F and 4G, respectively). Furthermore, indirect calorimetry analyses revealed that despite similar oxygen consumption rates (VO2) (Figure 4H), the respiratory exchange ratio (RER) was lower in Drp1 KI mice, particularly during the dark phase (Figure 4I). Even if at this stage we cannot attribute the RER changes to a particular tissue, this observation suggests a preferential use of lipids as a whole-body fuel source.
Figure 4.

Drp1 KI mice display higher lipid utilization and respiratory capacity
(A and B) WT and Drp1 KI male mice fed on a LFD were used to analyze body weight (A) and composition (B) through EchoMRI.
(C) Total activity was measured during indirect calorimetry tests using a comprehensive laboratory animal monitoring system (CLAMS).
(D) Intraperitoneal glucose tolerance test (2 g/kg) performed on WT and Drp1 KI mice fasted for 12 h.
(E) Intraperitoneal insulin tolerance test performed on WT and Drp1 KI mice fasted for 6 h. Insulin (0.5 U/kg) was injected and glycemia was recorded for the time points indicated.
(F and G) Respirometry analyses of uncoupled (leak) respiration, complex I (CI) respiration, complex I + complex II (CI+CII) respiration, maximal electron transport system (ETS) capacity, and maximal complex II (CII)-driven respiration in liver (F) and BAT (G) homogenates from WT and Drp1 KI mice.
(H and I) Total O2 consumption (VO2) (H) and respiratory exchange ratio (RER) (I) in WT and Drp1 KI mice were measured through indirect calorimetry.
All values are presented as mean ± SEM of n = 10 WT and n = 11 Drp1 KI mice. Differences between the two groups were analyzed using a Student’s two-tailed t test in (A)–(C), (F), and (G). Linear mixed-effect models were used in (D), (E), (H), and (I) to assess time × group interaction effects; subsequent comparisons were performed with Tukey’s honest significant difference post hoc test. ∗p < 0.05, ∗∗p < 0.01, and ∗∗∗p < 0.001 between the designated groups. See also Figure S4.
Drp1 KI mice are protected against high-fat-diet-induced insulin resistance
Given that Drp1 KI mice displayed higher lipid oxidation rates and that lipid accumulation constitutes a key driver of metabolic disease, we next aimed to understand how the Drp1 KI mice handled dietary lipid overload in the shape of a HFD. WT and Drp1 KI mice fed a HFD gained similar body weight (Figure 5A). Food intake (Figure 5B) and daily activity (Figure 5C) were also similar between genotypes. Moreover, there were no changes in total energy expenditure (Figure 5D). Although glucose tolerance was similar between WT and Drp1 KI mice when fed a LFD (Figure 5D), Drp1 KI mice were protected against diet-induced glucose intolerance (Figure 5E). Plasma insulin levels were comparable between groups during the glucose tolerance test, indicating that the higher glucose tolerance was not due to increased insulin secretion (Figure S5A). Rather, HFD-fed Drp1 KI mice were more responsive to insulin, as testified by a higher drop in glucose levels after an insulin challenge (Figure 5F). In addition, Drp1 KI mice displayed lower levels of several circulating inflammatory markers, including ANGPT-L3, C-reactive protein (CRP), ICAM-1, or RBP4 (Figure S5B), whereas other hormones, such as leptin, remained unchanged (Figure S5C). Circulating Fgf21 levels, which have been proposed as a marker of mitochondrial dysfunction (Boutant et al., 2017; Kim et al., 2013), were also reduced in the Drp1 KI mice (Figure S5D).
Figure 5.

Drp1 KI mice are protected against diet-induced glucose intolerance and insulin resistance
(A) Body weight evolution during the HFD-feeding period of male Drp1 KI and WT mice.
(B–D) Food intake (B), total activity (C), and energy expenditure (EE) (D) were measured during indirect calorimetry tests using a CLAMS.
(E) Intraperitoneal glucose tolerance tests (2 g/kg) on HFD-fed WT and Drp1 KI mice fasted for 12 h.
(F) Intraperitoneal insulin tolerance tests on HFD-fed WT and Drp1 KI mice fasted for 6 h, using 1 U/kg of insulin.
(G) Thermogenic capacity was evaluated by placing WT and Drp1 KI mice at 6°C and measuring body temperature for 4 h.
(H) Non-shivering thermogenesis in HFD-fed WT and Drp1 KI mice kept at regular housing temperature (22°C) was evaluated by measuring baseline and CL316,243 (1 mg/kg)-induced O2 consumption in anesthetized mice (n = 10 mice per genotype).
(I) Immediately after the experiment in (C), the mice were housed at thermoneutrality (30°C–33°C) for 4 weeks. Then, non-shivering thermogenesis was measured as in (C).
All values are presented as mean ± SEM of n = 14 WT and n = 11 Drp1 KI, unless otherwise stated. ∗p < 0.05 and ∗∗p < 0.01 between WT (white bars and white circles) and Drp1 KI mice (gray bars and black squares). Differences between the two groups were analyzed using a Student’s two-tailed t test in (B)–(D) and (I). Linear mixed-effect models were used in (A) and (E)–(H) to assess time × group interaction effects; subsequent comparisons were performed with Tukey’s honest significant difference post hoc test. See also Figure S5.
Because muscle and heart are tissues with high-energy demand and high mitochondrial content, we wondered whether the Drp1 S600A mutation could lead to functional alterations. To evaluate muscle function, we carried out treadmill and grip strength tests (Figures S5E–S5G), but we did not observe differences between genotypes. To analyze heart function, we performed a non-invasive blood pressure (NIBP) test. No differences in either pulse rate (Figure S5H) or systolic blood pressure (Figure S5I) were observed between HFD-fed WT and Drp1 KI mice.
Although core body temperature was similar between WT and Drp1 KI mice (WT: 38.20°C ± 0.12°C; KI: 38.41°C ± 0.10°C), Drp1 KI mice were better protected against the drop in body temperature during a cold challenge (Figure 5G), suggesting a higher thermogenic capacity in their BAT. To assess more directly whether BAT thermogenic function was increased in Drp1 KI, we measured whole-body O2 consumption after β3-adrenergic stimulation in anesthetized mice. Although Drp1 KI and WT littermates showed similar O2 consumption rates at baseline, the increase in O2 consumption triggered by the β3-adrenergic receptor agonist CL316,243 was higher in the Drp1 KI mice (Figures 5H and 5I). When a similar experiment was performed after housing the mice for 4 weeks at thermoneutrality (TN, 30°C) to blunt the thermogenic function of the BAT, the differences between genotypes were abrogated (Figure 5I). Overall, these results testify to higher glucose tolerance, insulin sensitivity, and thermogenic capacity in Drp1 KI mice in the context of obesity.
Drp1 KI BAT displays enhanced fatty acid oxidation and mitochondrial function
In line with the increased thermogenic capacity, H&E staining revealed a decrease in the lipid droplet (LD) area in the BAT from the Drp1 KI mice (Figure 6A). Almost 50% of the LDs measured in WT samples were large (>1,000 μm2), whereas only 13% of the LDs reached this size in Drp1 KI mice (Figure 6B). In contrast, neither the eWAT nor the liver displayed altered lipid deposition (Figures S6A and S6B), suggesting that this phenotype was specific to the BAT. The lower lipid accumulation in the BAT of Drp1 KI mice could not be attributed to the impaired expression of lipogenesis enzymes, because the mRNA levels for lipogenic markers were, in most cases, increased in Drp1 KI mice (Figure S6C). Therefore, we reasoned that the altered lipid handling could be linked to changes in lipid catabolism. One critical determinant of lipid oxidation is mitochondrial oxidative phosphorylation capacity. Given that higher respiration was observed in Drp1 KI tissues on LFD, we next evaluated mitochondrial respiratory capacity in HFD-fed Drp1 KI mice. Uncoupled (leak) respiration and coupled respiration through either complex I (CI) or CI + complex II (CI+CII) were increased in total BAT homogenates from the Drp1 KI mice compared with the WT mice (Figure 6C). Similarly, maximal electron transport system (ETS) capacity of the respiratory chain was enhanced (Figure 6C). The higher mitochondrial respiratory capacity in the BAT of the Drp1 KI mice was not linked to an increase in mitochondrial number, as evaluated by the quantification of mitochondrial DNA (Figure 6D) and protein levels of mitochondrial respiratory complexes (Figure 6E). However, intrinsic changes in respiratory properties were observed using isolated mitochondria, because state 4 respiration of complex I, triggered by malate and glutamate, was higher in the isolated mitochondria from the Drp1 KI mice (Figure 6F).
Figure 6.

Increased fatty acid oxidation capacity in the BAT of Drp1 KI mice
BAT from HFD-fed male WT and Drp1 KI mice was collected, and the following tests were performed.
(A) Hematoxylin and eosin staining of BAT (scale bar: 100 μm).
(B) Lipid droplet size quantification from histology images in (A), corresponding to 20 independent images per BAT section (n = 5 samples per genotype).
(C) Respirometry analyses of uncoupled (leak) respiration, CI respiration, CI+CII respiration, maximal ETS capacity, and maximal CII-driven respiration in BAT homogenates from HFD-fed WT (n = 8) and Drp1 KI (n = 7) mice.
(D) Total DNA was extracted to measure by qRT-PCR the ratio between mitochondrial-encoded and nuclear-encoded genes (mtDNA:nDNA) (n = 7 WT and n = 10 Drp1 KI).
(E) Mitochondrial complex protein levels were evaluated in total homogenates from BAT.
(F) Respirometry analyses in isolated mitochondria from BAT of WT (n = 7) and Drp1 KI (n = 10) mice. Malate (2 mM) and glutamate (10 mM) were used to stimulate complex I, and state 3 and state 4 respiration rates were evaluated.
(G) mRNA levels fatty acid oxidation (FAO) and thermogenesis (Ucp1) markers analyzed by quantitative real-time PCR (n = 7 WT and n = 8 Drp1 KI).
(H) Respirometry assays were performed in BAT homogenates using malate (0.5 mM) and β-octanoylcarnitine (0.1 mM) to assess FAO capacity and then carbonylcyanide-4-(trifluoromethoxy)-phenyl-hydrazone (FCCP) to evaluate maximal ETS capacity (n = 12 mice per genotype).
(I) Acyl-carnitine levels were measured by liquid chromatography-mass spectrometry (LC-MS) (n = 12 WT and n = 9 Drp1 KI).
Throughout the figure, white bars and white circles represent WT mice, whereas gray bars and black squares represent Drp1 KI mice. All data are expressed as mean ± SEM. ∗p < 0.05, ∗∗p < 0.01, and ∗∗∗p < 0.001 versus the respective WT group (two-tailed Student’s t test). See also Figure S6.
Although mitochondrial respiration in the eWAT was similar between genotypes (Figure S6D), increased respiration was seen in liver homogenates from Drp1 KI mice (Figure S6E), in which lipid content was unaltered (Figure S6B). Therefore, the lower lipid deposition in BAT might not be solely explained by altered mitochondrial respiratory capacity. This led us to explore whether changes in respiratory capacity were accompanied by alterations in fatty acid mobilization and oxidation enzymes. In this sense, fatty acid oxidation (FAO) markers, particularly the expression genes encoding for the carnitine-palmitoyltransferase enzymes Cpt1b and Cpt2, increased at the mRNA level (Figure 6G). These differences were specific to the BAT, because the expression of FAO-related genes was similar between genotypes in eWAT and those in liver (Figures S5F and S5G). Increased Ucp1 mRNA levels were also observed in BAT of Drp1 KI mice (Figure 6G), in line with the higher uncoupled respiration observed in their mitochondria. Moreover, ex vivo FAO analysis demonstrated higher oxidation rates of octanoylcarnitine in the Drp1 KI BAT (Figure 6H), certifying their increased lipid mobilization and oxidation rates. Metabolomics analyses identified marked upregulation of a family of up to 12 acyl-carnitines (Figure 6H). In contrast, liver acyl-carnitine profiles looked similar between genotypes (Figure S6H), further suggesting a particularly strong metabolic impact of the Drp1 S600A mutation in the BAT.
Thermoneutrality blunts the higher insulin response of the Drp1 KI mice
We next aimed to assess the contribution of the higher BAT thermogenic function to the insulin sensitivity phenotype of the Drp1 KI mice. To test this, we housed HFD-fed mice at TN to abrogate BAT thermogenic function. Validating the impact of the TN intervention on BAT thermogenic function, protein analyses from BAT revealed a reduction of UCP1 protein levels in WT mice housed at TN (Figures 7A and 7B). We also observed a decrease in Drp1 phosphorylation levels in agreement with a lower adrenergic tone in the BAT of mice housed at TN (Figures 7A and 7B).
Figure 7.

Thermoneutrality blunts the differences between WT and Drp1 KI mice
WT and Drp1 KI male mice were challenged with a HFD for 4 weeks and housed at thermoneutrality (TN, 30°C–33°C) for an additional 4 weeks before performing the following tests.
(A) Evaluation of total Drp1, Drp1 phosphorylation, and UCP1 protein levels in HFD-fed WT mice housed either at 22°C (RT, room temperature) or at TN.
(B) Quantifications of the markers in (A) (n = 4 per condition).
(C) Hematoxylin and eosin staining of BAT from WT and Drp1 KI mice housed at TN (scale bar: 100 μm).
(D) Lipid droplet size quantification from histology images in (C), corresponding to 20 independent images per BAT section (n = 4 samples per genotype).
(E) BAT was collected from WT and Drp1 KI mice and mRNA was extracted to measure fatty acid oxidation and thermogenesis (Ucp1) markers by qPCR.
(F) Insulin tolerance tests performed on HFD-fed WT and Drp1 KI mice housed at TN. Insulin (1 U/kg) was injected and glycemia was measured for the time points indicated.
(G and H) High-resolution respirometry analyses of uncoupled (leak) respiration, CI respiration, CI+CII respiration, maximal ETS capacity, and maximal CII-driven respiration in BAT (G) and liver (H) homogenates from HFD-fed mice housed at TN.
All values are presented as mean ± SEM of n = 10 mice per genotype, unless otherwise stated. ∗p < 0.05, ∗∗p < 0.01, ∗∗∗p < 0.001. Differences between groups were analyzed using Student’s two-tailed t test in (B), (D), (E), (G), and (H). Linear mixed-effect models were used in (F) to measure time × group interaction effects; subsequent comparisons were performed with Tukey’s honest significant difference post hoc test. See also Figure S7.
H&E staining revealed large lipid droplets in the BAT of mice housed at TN, with no differences between genotypes (Figures 7C and 7D). In addition, the higher mRNA levels of Ucp1 and FAO-related genes observed in Drp1 KI mice at normal housing temperature were absent at TN (Figure 7E). Remarkably, TN abolished the higher insulin sensitivity of the Drp1 KI mice observed under normal housing conditions (Figure 7F), emphasizing the link between BAT thermogenic function and whole-body glucose handling.
As expected, TN largely blunted mitochondrial respiratory capacity in BAT from both WT and Drp1 KI mice, and the values were undistinguishable between genotypes (Figure 7G). Higher respiratory capacity in the livers of Drp1 KI mice was still appreciated in TN-housed Drp1 KI mice (Figure 7H), testifying for the BAT-specific impact of the protocol.
Interfering with Drp1 function during development has been shown to have a major impact on various tissue phenotypes (Ishihara et al., 2009; Wakabayashi et al., 2009). In contrast, Drp1 KI mice have a normal appearance and only a few subtle phenotypic alterations. Furthermore, the preceding results suggest that the BAT phenotype of the Drp1 KI mice is not developmentally determined but rather adaptive to ambient temperature. To better demonstrate the flexibility of the BAT phenotype, we performed an experiment in which mice were bred at either room temperature (RT) or TN. We then evaluated BAT respiratory capacity in the offspring when they were weaned at 3 weeks of age. The remaining pups were placed either at RT or at TN for 4 additional weeks, when BAT respiratory capacity was analyzed again (Figures S7A and S7B).
When bred and housed at RT, Drp1 KI mice displayed increased BAT complex I-driven uncoupled respiration and maximal respiratory capacity at weaning (Figure S7C) This difference was maintained 4 weeks later if mice were maintained at RT. However, if mice were transferred at TN upon weaning, the respiratory capacity in BAT was dramatically blunted and no differences were observed between phenotypes (Figure S7C).
In contrast, when mice were bred and housed at TN, the mitochondrial respiratory capacity in the BAT of Drp1 KI mice was similar to that of WT mice at weaning (Figure S7D). If maintained at TN, BAT respiratory profiles remained undistinguishable between WT and Drp1 KI mice at 7 weeks of age. However, when mice were moved to RT after weaning, Drp1 KI mice displayed higher uncoupled respiration and maximal respiratory capacity at 7 weeks of age. These results suggest that the differences in BAT respiratory capacity between WT and Drp1 KI are largely determined by ambient temperature and not developmentally fixed.
Discussion
The study of mitochondrial shape and dynamics has achieved special significance because of its contribution to mitochondrial respiratory function and interrelation with other organelles (Gordaliza-Alaguero et al., 2019). Drp1 is one of the main actors driving mitochondrial fission, yet there is limited knowledge about its physiological regulation in vivo. Human mutations impairing Drp1 function have been implicated in encephalopathies and developmental regression (Fahrner et al., 2016; Waterham et al., 2007). In mice, the deletion of the Dnml1 gene is embryonically lethal because of deficient synaptic formations, resulting in brain hypoplasia (Ishihara et al., 2009; Wakabayashi et al., 2009). Similarly, the tissue-specific deletion of Drp1 generally leads to severe mitochondrial dysfunction and functional alterations at the tissue level (Favaro et al., 2019; Wang et al., 2015). However, these strategies fail to reflect the physiological regulation of Drp1 function, which is largely controlled by post-translational modifications, of which the phosphorylation at S600 and S579 have received the most attention. Although several reports have highlighted alterations in Drp1 phosphorylation levels in disease settings (Deus et al., 2020; Kashatus et al., 2015; Zhang et al., 2019), the impact, regulation, and interrelation between Drp1 S579 and S600 are poorly understood.
Our work shows that the phosphorylation sites of S600 and S579 are interrelated and occur simultaneously in mouse tissues upon pharmacological and physiological stimuli increasing cAMP levels and PKA. First, we demonstrate that S579 phosphorylation is a downstream consequence of S600 phosphorylation upon PKA activation in mouse tissues. Second, the use of phospho-mimetic plasmids indicates that S600 phosphorylation is enough to drive an increase in P-S579 levels, even in the absence of stimuli. So, how can S600 phosphorylation condition S579? The phospho-mimetic Drp1 experiments suggest that a likely possibility is that S600 phosphorylation protects against S579 dephosphorylation. An alternative explanation could be that S600 phosphorylation could favor the accessibility of S579 to an active kinase.
Paradoxical views exist on whether Drp1 phosphorylation at S600 leads to mitochondrial fragmentation (Han et al., 2008; Wang et al., 2012; Wikstrom et al., 2014) or elongation (Cereghetti et al., 2008; Chang and Blackstone, 2007; Cribbs and Strack, 2007). Our results suggest that S600 phosphorylation favors mitochondrial fission. First, because Drp1 S600 phospho-mimetic mutants led to mitochondrial fission in cultured cells. In addition, the BAT from our Drp1 S600A KI mice displayed mitochondrial profiles skewed toward increased tubulation. A recent article also reported an elongated mitochondrial network in podocytes from an independently generated Drp1 S600A KI mouse model (Galvan et al., 2019). Support for a pro-fission role of S600 phosphorylation exists because exposure of mice to physiological adrenergic stimuli, such as cold temperature, leads to mitochondrial fragmentation in BAT (Park et al., 2019). Then, how can the disparate observations on the relation between S600 phosphorylation and mitochondrial architecture be explained? One possibility is that the effects of S600 phosphorylation could be highly cell type and/or stimulus specific, based on the expression of different Drp1 isoforms (Wikstrom et al., 2014). Mammalian cells express multiple Drp1 isoforms, which differ in their tissue abundance (Strack et al., 2013), their ability to engage mitochondrial fission (Macdonald et al., 2016), and their subcellular localization (Itoh et al., 2018; Strack et al., 2013). The initial studies relating Drp1 S600 phosphorylation with mitochondrial elongation focused on the brain-specific isoform 1 (Chang and Blackstone, 2007; Cribbs and Strack, 2007). In agreement, different genetic strategies to either blunt (Flippo et al., 2018) or enhance (Flippo et al., 2020) Drp1 phosphorylation in vivo suggest that phosphorylation of the brain form of Drp1 leads to mitochondrial elongation. In contrast, our work focused on BAT, liver, or muscle, where isoform 3 is predominant (Figure S7E). A similar case could be made for podocytes (Wang et al., 2012) or primary brown adipocytes (Wikstrom et al., 2014), in which Drp1 S600 phosphorylation correlated with mitochondrial fission. Another possible explanation comes from our results demonstrating that the pro-fission effects of S600 phosphorylation require the downstream phosphorylation of S579. In the impossibility of this downstream event, S600 phosphorylation leads to mitochondrial elongation, as demonstrated by our mutagenesis experiments using Drp1 S600E/S579A forms.
The liver and BAT from the Drp1 S600A KI mouse displayed higher complex I- and complex II-driven mitochondrial respiration. This echoes previous evidence indicating that mitochondrial elongation is linked to higher respiratory capacity in cultured cells and tissues (Gomes et al., 2011; Liesa and Shirihai, 2013). Improved mitochondrial function strongly correlates with protection against diet-induced metabolic disease (Cantó, 2018). Accordingly, Drp1 KI mice were protected against HFD-induced glucose intolerance and insulin resistance. In addition, Drp1 KI mice better maintained their body temperature upon cold exposure, in line with higher BAT thermogenic capacity. Changes in BAT activity can influence whole-body metabolic homeostasis (Chouchani and Kajimura, 2019). In this sense, the higher insulin response in Drp1 KI mice was blunted when mice were housed at TN, suggesting that thermoregulation could have a critical role on this phenotypic aspect. Although we cannot rule out the participation of other tissues to the phenotypes of the Drp1 KI mice, these findings contribute to other works highlighting how altered mitochondrial dynamics in adipose tissues influence whole-body glucose homeostasis. For example, Mfn2 deletion in the BAT at early stages of life leads to smaller mitochondria with impaired mitochondrial complex I activity, prompting decreased thermogenic capacity and glycolytic rewiring that prevents glucose intolerance upon HFD feeding (Boutant et al., 2017; Mahdaviani et al., 2017). In contrast, adipocyte-specific knockdown of Mfn2 in adult mice also led to smaller mitochondria yet caused impaired glucose metabolism (Mancini et al., 2019). This suggests that the influence of mitochondrial dynamics on adipose tissue and whole-body metabolism might also vary at different stages of life.
Although alterations in mitochondrial dynamics can have a strong repercussion in embryo development and viability (for review, see Cantó, 2018), Drp1 KI mice have a normal appearance, suggesting that S600 phosphorylation is not a major determinant for embryonic development. Furthermore, our results illustrate that, at least for BAT, the phenotypic influence depends on ambient temperature and is fully reversible by TN, both at early and late stages of life (Figure S7 and Figure 7, respectively). Therefore, and although our experiments cannot fully rule out an impact of S600 phosphorylation during developmental stages, the main phenotypical aspects in the BAT of Drp1 KI mice do not seem to be developmentally imprinted.
Another interesting point of discussion is that mitochondrial fission in response to adrenergic stimuli has been shown to maximize the thermogenic response (Wikstrom et al., 2014). However, our Drp1 KI mice, in which S600 cannot be phosphorylated, have a better thermogenic response when fed an HFD. This potential discrepancy might be explained by the KI mice having higher lipid mobilization, respiratory capacity, and UCP1 levels in BAT, probably as a compensatory adaptation for their defective Drp1 phosphorylation and mitochondrial fission in the acute response to cold stress. One also has to consider that Drp1 can participate in peroxisomal fission (Koch et al., 2003; Li and Gould, 2003) and probably in the constriction of other cellular membranes (Itoh et al., 2018). Therefore, and despite the prominent effect on mitochondrial respiratory capacity, multiple components related to Drp1 biology might influence the phenotype of Drp1 KI mice and will need further investigation.
Altogether, our manuscript unveils the in vivo regulation of Drp1 phosphorylation sites and describes an unrecognized link between Drp1 S600 and Drp1 S579. Coupling S600 phosphorylation, largely controlled by metabolic cues, to other cellular events influencing S579 phosphorylation (e.g., cell cycle) might have favored the development of this dual regulation system of Drp1 in chordates. In addition, we unveil a role for S600 phosphorylation on whole-body nutrient utilization. These findings could have important implications for various human pathologies associated with altered mitochondrial dynamics and pave the way for future studies modulating the phosphorylation of this residue to improve lipid catabolism in pathophysiological states.
Limitations of the study
Although many aspects of our work point toward a critical role for the BAT in the phenotype of the Drp1 KI mice, our results do not rule out that larger, more complex alterations in intertissue communication support those phenotypes. In line with this, our results illustrate a decrease in circulating Fgf21 levels, which has pleiotropic metabolic effects. In addition, mitochondrial fusion and fission can influence organismal behavior, including food intake, an aspect that deserves future consideration to fully understand the etiology of the metabolic alterations in the Drp1 KI mice.
Our results in cultured cells suggest that in a cell-autonomous fashion, defective phosphorylation slows down, but does not impede, changes in mitochondrial architecture in response to the nutrient environment. However, this concept should be strengthened by measuring real-time changes in mitochondrial architecture. In addition, cultured cell paradigms of nutrient deprivation do not necessarily mimic organismal fasting, calling for future evaluation of these concepts in animal models.
STAR★Methods
Key resources table
| REAGENT or RESOURCE | SOURCE | IDENTIFIER |
|---|---|---|
| Antibodies | ||
| Rabbit polyclonal anti-Drp1 (1:1000) | This paper | N/A |
| Rabbit polyclonal anti-phospho Drp1 Ser600 (1:2000) | This paper | N/A |
| Rabbit polyclonal anti-phospho Drp1 Ser579 (1:1000) | This paper | N/A |
| Rabbit monoclonal antibody anti-GAPDH (Clone 14C10) (1:2000) | Cell Signaling Technology | Cat#2118; RRID: AB_561053 |
| Rabbit polyclonal anti-Pan-cadherin (1:1000) | Cell Signaling Technology | Cat#4068; RRID: AB_2158565 |
| Rabbit monoclonal anti- Rb (D20) (1:1000) | Cell Signaling Technology | Cat#9313; RRID: AB_1904119 |
| Rabbit polyclonal phospho-Rb (Ser780) (1:1000) | Cell Signaling Technology | Cat# 9307; RRID: AB_330015 |
| Rabbit monoclonal anti-Cdk1 (1:1000) | Abcam | Cat#ab133327; RRID: AB_11155333 |
| Rabbit polyclonal anti-phospho-Cdk1 (Tyr15) (1:500) | Millipore | Cat# 219440; RRID: AB_564425 |
| Rabbit polyclonal anti-Mfn1(1:2000) | Kulkarni et al., 2016 | N/A |
| Rabbit polyclonal anti-Mfn2 (1:2000) | Kulkarni et al., 2016 | N/A |
| Mouse monoclonal anti- OPA1 (Clone 18/OPA1) (1:2000) | BD Biosciences | Cat# 612606; RRID: AB_399888 |
| Mouse monoclonal anti- Anti-VDAC1 / Porin (1:5000) | Abcam | Cat#ab14734; RRID: AB_443084 |
| Mouse monoclonal anti-NDUFA9 (Clone 20C11) (1:2000) | Abcam | Cat# ab14713; RRID: AB_301431 |
| Mouse monoclonal anti-SDHA (Clone 2E3) (1:5000) | Abcam | Cat# ab14715; RRID: AB_301433 |
| Mouse monoclonal anti-UQCRC1 (1:2000) | Abcam | Cat# ab110252; RRID: AB_10863633 |
| Mouse monoclonal anti-MTCO1 (1:1000) | Abcam | Cat#ab14705; RRID: AB_2084810 |
| Mouse monoclonal anti-ATP5A (1:5000) | Abcam | Cat# ab14748; RRID: AB_301447 |
| Rabbit polyclonal anti-UCP1 (1:5000) | Abcam | Cat# ab10983; RRID: AB_2241462 |
| Bacterial and virus strains | ||
| DH5alpha competent | ThermoFisher | #18265017 |
| Chemicals, peptides, and recombinant proteins | ||
| Oligomycin | Sigma | #1404-19-9 |
| FCCP | Sigma | #370-86-5 |
| Rotenone | Sigma | #83-79-4 |
| Antimycin A | Sigma | #1397-94-0 |
| CL 316,243 | Sigma | #C5976 |
| Glucagon | Novo Nordisk | #0169-7065-15 |
| Isoproterenol hydrochloride | Sigma | #I6504 |
| Glucose | GIBCO | #15023021 |
| Insulin (100U/mL) | NovoRapid | # 058610 |
| Roscovitine | Cell Signaling Technology | #9885 |
| KOD Hot Start DNA Polymerase | Merck/SigmaAldrich | 71086 |
| T4 DNA ligase | Fermentas/Thermofisher | #EL0016 |
| BamH1 | Fermentas/Thermofisher | #FD0055 |
| Not1 | Fermentas/Thermofisher | #ER0592 |
| Dpn1 | Fermentas/Thermofisher | #ER1702 |
| Critical commercial assays | ||
| Proteome Profiler Mouse Adipokine Array Kit | R&D Systems | #ARY013 |
| DNeasy Blood & Tissue Kit | QIAGEN | #69504 |
| BigDye Terminator 3.1 kit | Applied Biosystems | # 4337454 |
| NucleoSpin® Plasmid | MACHEREY-NAGEL | 740499 |
| NucleoSpin Gel and PCR clean-up kit | MACHEREY-NAGEL | 740609 |
| Deposited data | ||
| Metabolomics | MetaboLight | MTBLS3035 |
| Proteomics | ProteomeXchange | PXD027108 |
| Experimental models: Cell lines | ||
| Mouse: Drp1 KO mouse embryonic fibroblasts | Ishihara et al., 2009 | N/A |
| Mouse: Drp1 WT mouse embryonic fibroblasts | Ishihara et al., 2009 | N/A |
| Experimental models: Organisms/strains | ||
| Mouse: Dnm1l S643A knock-in (KI) | Taconic | C57BL/6NTac-Dnm1ltm3143(S643A)Arte |
| Mouse: Dnm1l S643A wild type (WT) | Taconic | C57BL/6NTac |
| Oligonucleotides | ||
| Primers for cloning, see Table S1 | This paper | N/A |
| Primers for RT-qPCR, see Table S2 | This paper | N/A |
| Recombinant DNA | ||
| Plasmid: pcDNA3.1 (+) | Thermofisher | V79520 |
| Plasmid: pcDNA3.1(+) Drp1 | A gift from Dr. David Chan, California Institute of Technology (Caltech, USA) | Addgene reference #34706 |
| Plasmid: pcDNA3.1 Drp1 WT | This paper | N/A |
| Plasmid: pcDNA3.1 Drp1 S579A | This paper | N/A |
| Plasmid: pcDNA3.1 Drp1 S579E | This paper | N/A |
| Plasmid: pcDNA3.1 Drp1 S579D | This paper | N/A |
| Plasmid: pcDNA3.1 Drp1 S600A | This paper | N/A |
| Plasmid: pcDNA3.1 Drp1 S600E | This paper | N/A |
| Plasmid: pcDNA3.1 Drp1 S600D | This paper | N/A |
| Plasmid: pcDNA3.1 Drp1 S579E/S600E | This paper | N/A |
| Plasmid: pcDNA3.1 Drp1 S579A/S600E | This paper | N/A |
| Plasmid: pcDNA3.1 Drp1 S579E/S600A | This paper | N/A |
| Plasmid: pVITRO2-neo-mcs | InvivoGen | pvitro2-nmcs |
| Plasmid: pVitro2- Drp1 WT - mtDSRED | This paper | N/A |
| Plasmid: pVitro2- Drp1 S579A - mtDSRED | This paper | N/A |
| Plasmid: pVitro2- Drp1 S579E - mtDSRED | This paper | N/A |
| Plasmid: pVitro2- Drp1 S600A - mtDSRED | This paper | N/A |
| Plasmid: pVitro2- Drp1 S600E - mtDSRED | This paper | N/A |
| Plasmid: pVitro2- Drp1 S579E/S600E - mtDSRED | This paper | N/A |
| Plasmid: pVitro2- Drp1 S579A/S600E - mtDSRED | This paper | N/A |
| Plasmid: pVitro2- Drp1 S579E/S600A - mtDSRED | This paper | N/A |
| Software and algorithms | ||
| ImageJ | Schneider et al., 2012 | https://imagej.nih.gov/ij/ |
| xcms | Tautenhahn et al., 2012 | https://xcmsonline.scripps.edu |
| MiNa | Valente et al., 2017 | https://github.com/StuartLab/MiNA |
| GraphPad Prism 6 | GraphPad Software | https://www.graphpad.com/ |
Resource availability
Lead contact
Further information and requests for resources and reagents should be directed to and will be fulfilled by the Lead Contact, Dr. Carles Canto (Carles.CantoAlvarez@rd.nestle.com).
Materials availability
This study generated Drp1 phospho mutant plasmids. Drp1 S600A knock-in (KI) mice were obtained from Taconic Biosciences ©. They are available from the Lead Contact without restriction upon signature of material transfer agreements.
Experimental model and subject details
Cell culture
Drp1KO mouse embryonic fibroblasts (MEFs) and their WT counterparts were kindly provided by Prof. Katsuyoshi Mihara. Unless otherwise specified, all cell culture reagents were obtained from GIBCO (Thermofisher Scientific Inc.). Cells were cultured in DMEM (4.5 g/L glucose) supplemented with 10% FBS, Penstrep (1%), nonessential amino acids (1%), sodium pyruvate (1%), and l-glutamine (1%).
Generation of the Drp1 knock-in mice
The Drp1 knock-in (KI) mice (C57BL/6NTac-Dnm1ltm3143(S643A)Arte) were generated by Taconic Farms Inc. The targeting strategy we used allowed the generation of a constitutive whole-body point mutation in the Dnm1l gene, based on the Ensembl transcript ENSMUST00000047122. Exon 1 in the mouse genomic locus contains the translation initiation codon. The targeting vector contains exons 17 to 20, including the splice acceptor site of intron 16, which were inserted downstream of the distal loxP site. The S600A mutation was introduced into the duplicated exon 18. An additional polyadenylation signal (hGHpA: human Growth Hormone polyadenylation signal) was inserted between the 3′ UTR and the distal loxP site in order to prevent downstream transcription of the mutated Dnm1l exon 18. The size of the loxP-flanked region of the targeting vector was of approximately 7.0 kb. The targeting vector was generated using BAC clones from the C57BL/6J RPCIB-731 BAC library which were then transfected into the TaconicArtemis C57BL/6N Tac ES cell line. The constitutive knock-in (KI) locus is obtained after Cre-mediated deletion of wild-type exons 17 to 20 and the hGHpA. After the whole-body recombination, including the germline, to express the knock-in mutation, we bred the knock-in mice and selected those without the expression of the Cre recombinase. Those knock-in mice no longer harboring the expression of the Cre recombinase were then bred with WT mice to generate heterozygotes. The offspring of these heterozygote mice breedings were the ones starting our colonies for these experiments. For this reason, the proper control for our mice are WT mice, and not mice expressing the Cre recombinase. Mice were kept in a standard temperature- and humidity-controlled environment with a 12h:12h light-dark cycle. Mice had nesting material and ad libitum access to water and commercial LFD and HFD (D12450J and D12492i, respectively, from Research Diets Inc.). All animal experiments were carried according to national Swiss and EU ethical guidelines and approved by the local animal experimentation committee under licenses VD 3118 and VD3648. All clinical tests were carried out according to standard operational procedures established within the Eumorphia program (https://www.mousephenotype.org/impress/index). Animals were systematically randomized for the tests, ensuring similar numbers per genotype in the cohorts. The metabolic phenotyping tests (Figures 4, 5, 6, and 7) were performed in aged-matched cohorts of male mice, which were between 30-50 weeks of age. Male mice were used for these experiments, as female C57BL/6NTac mice do not develop metabolic disease upon high-fat diet feeding. Unless otherwise specified all other test (including Figure S7) undistinguishably used male and female mice at an approx. 1:1 ratio. Mice that showed any sign of severity, predefined by the Veterinary Office of the Canton of Vaud, were euthanized. These animals, together with those who died spontaneously during the experiments, were excluded from the data analyses.
Method details
Animal phenotyping
Body composition was determined by Echo-MRI (Echo Medical Systems, Houston, TX, USA). Oxygen consumption (VO2 and VCO2), food intake, and activity were monitored by indirect calorimetry using the comprehensive laboratory animal monitoring system (CLAMS; Columbus Instruments, Columbus, OH, USA). EE was estimated using VO2 and VCO2 values from indirect calorimetry, using the following equation EE (in kJ/h) = (15.818 × VO2) + (5.176 × VCO2) (Virtue and Vidal-Puig, 2013). Food intake and activity were also monitored using the CLAMS during a 24 h period. Glucose tolerance was analyzed by measuring blood glucose after an intraperitoneal injection of 2 g/kg glucose after an overnight fast. Insulin tolerance was measured by injecting 0.5 U/kg insulin for LFD-fed mice, or 1 U/kg insulin for HFD-fed mice, after 6 h fasting. Cold test experiments were performed by placing mice in a cold chamber kept at 6°C and measuring rectal body temperature every hour. At the end of the phenotyping, animals were sacrificed at 8 a.m. after a 12 h fast, in order to stabilize systemic parameters and to allow the measurement of blood biochemistry in the fasting state. Blood samples were collected in EDTA-coated tubes, and plasma was isolated after centrifugation (2000 g, 15 min, 4°C). Tissues were collected upon sacrifice and flash-frozen in liquid nitrogen.
Cell imaging
For the imaging of the Drp1 phospho mutant plasmids, Drp1KO cells were transfected using Lipofectamine 2000 with plasmids expressing the different forms of Drp1 and, bicistronically, a mitochondrially targeted Mito-DsRed protein. Concentration of DNA and lipofectamine 2000 were adjusted based on manufacturer’s instructions. Twenty-four hours after the transfection, cells were imaged using a Zeiss AxioObserver Z1 confocal spinning-disk microscope and preserving CO2 conditions. Approximately 50 different cells were imaged in at least three different biological replicates, and the orthogonal projection of each cell was taken as the final imaging result. For the starvation conditions, cells were incubated with Hank’s balanced salt solution (HBSS) media for 2h and then imaged. Nuclei were stained with Hoechst. Mitochondrial length was measured using the MiNa macro of FiJi as described in Valente et al. (2017). Briefly, 2D images were pre-processed using the following commands: 1) “unsharp mask” (radius = 1 pixel; mask weight = 0.6) to enhance the sharpness of the image; 2) “enhance local contrast (CLAHE)” (pixel block size = 127, histogram bins = 256, and maximum slope = 3) to equalize image contrast while minimizing noise amplification and 3) median (value = 1), to reduce filtering noise. The parameters of the MiNA interface were the following: ridge detection (checked), high contrast (75), low contrast (5), line width (1), minimum line length (5). Circularity and aspect ratio (AR) were analyzed according to the indications in (Merrill et al., 2017). Mitochondria exhibiting a perfect circular shape have a circularity value close to 1.0, whereas more elongated mitochondria have a circularity value that is closer to 0.0. AR is calculated as [(major axis)/(minor axis)] and reflects the “length-to-width ratio.” An AR value of 1 indicates a perfect circle and its value increases as mitochondria elongate.
Plasmid generation
All plasmids used in the manuscript have been generated from a plasmid encoding for pcDNA3.1(+) Drp1 kindly gifted by David Chan. The introduction of a FLAG tag to the Drp1 product and generation of bicistronic plasmids encoding also for mito-DsRed was achieved through regular cloning molecular biology methods. Plasmid purification was done using NucleoSpin columns and following the manufacturer’s instructions. The sequences of all the clones have been verified in-house using the BigDye Terminator 3.1 kit and 3500XL Genetic analyzer (Applied Biosystems). The primers used for site-directed mutagenesis can be found in Table S1.
In vivo measurement of brown adipose tissue activity
In order to evaluate non-shivering thermogenesis (BAT function), we measured whole-body O2 consumption in response to a specific β3-adrenergic agonist (CL316,243) in anesthetized mice as previously described (Cannon and Nedergaard, 2011). Briefly, mice, housed either at 22°C or 30°C for at least 1 month, were anesthetized using pentobarbital (60 mg/kg) and placed on a calorimetric chamber at 30°C. After 30 min of adaptation, CL316,243 was subcutaneously injected (1 mg/kg) and mice were placed back in the chamber to follow up O2 consumption measurements.
High-resolution respirometry studies
Respirometry studies were performed using high-resolution respirometry (Oroboros Oxygraph-2k, Oroboros Instruments) as described previously (Cantó and Garcia-Roves, 2015). All respirometry experiments were performed on fresh tissues immediately after dissection. Liver and BAT were homogenized in amino acid-depleted respirometry medium (0.5 mM EGTA, 3 mM MgCl2, 60 mM K-lactobionate, 10 mM KH2PO4, 20 mM HEPES, and 110 mM sucrose, pH 7.1) and 2 mg of wet tissue were added to the experimental chamber. For eWAT, around 50 mg of tissue were added to the experimental respirometry chamber.
Oxygen flux (denoted as “Leak”) was measured by adding malate (2 mM), pyruvate (5 mM) and glutamate (10 mM) in the absence of ADP. Complex I-driven oxidative phosphorylation (“CI”) was quantified by the addition of ADP (5 mM for liver; 0.5 mM for BAT). This was followed by the addition of succinate (10 mM) for electron flow through both complex I and II measurement (‘’CI+II’’). Subsequently, carbonylcyanide-4-(trifluoromethoxy)-phenyl-hydrazone (FCCP) was titrated to achieve maximum flux through the electron transfer system (‘’ETS’’). Finally, electron transport through complex I (‘’CII’’) and complex III was inhibited by the sequential addition of rotenone (0.1 μM) and antimycin A (2.5 μM), respectively. The remaining O2 flux after inhibition with antimycin A (O2 flux independent of the electron transfer system) was subtracted from all the values from the previous steps. Oxygen flux values are expressed relative to tissue wet weight per second (pmol O2 x mg−1 s−1).
For respirometry analyses on isolated mitochondria, 200 μg of isolated mitochondrial protein were used. State 3 respiration was evaluated after the addition of substrates for Complex I (malate and glutamate; 2 and 10 mM respectively) or Complex II (succinate 10 mM), together with ADP (250 μM). Isolated mitochondria preparations were routinely tested for the integrity of the outer mitochondrial membrane by adding Cytochrome C (10 μM) during State 3 respiration. All studies in isolated mitochondria used exclusively samples where Cytochrome C addition increased respiration by less than 5%. State 4 respiration was the remaining respiration rate once ADP levels were depleted in the respiration chamber.
Histology and EM imaging
H&E and Oil Red O stainings were performed using the fully automated Ventana Discovery XT (Roche Diagnostics, Rotkreuz, Switzerland). All steps were performed on the machine with Ventana solutions. A total of 5 WT and 5 Drp1 KI mice were compared for histology analyses, by imaging and quantifying approximately 10 sections per mouse tissue. EM was performed in brown adipose tissue from 4 WT and 4 Drp1 KI mice as previously described in Kulkarni et al. (2016). Micrographs with a pixel size of 6.86 nm were taken with a transmission electron microscope Philips CM100 (Thermo Fisher Scientific, Waltham, MA USA) at an acceleration voltage of 80kV with a TVIPS TemCam-F416 digital camera (TVIPS GmbH, Gauting, Germany). Mitochondrial volume density was measured by stereology using 3dmod, as described in Broskey et al. (2013). Upon placing the grid (spacing = 50 nm) on each image, the number of points that intersected with mitochondria were counted and then normalized to those corresponding to the adipocyte. Mitochondrial areas were examined using ImageJ (Schneider et al., 2012). The volume fraction of mitochondria and the mitochondrial area profiles were estimated from a total of 20 EM-sections per genotype.
Antibody generation
The rabbit polyclonal antibody against total Drp1, Drp1 phospho-Ser600 and Drp1 phospho-Ser579 were generated by rabbit injections (Yenzym antibodies, CA, USA), followed by affinity purification using standard protocols. The antibody for mouse Drp1 was raised against the peptide GLMNNNIEEQRRNRLARE, which covers amino acids 506-523 of the Isoform 3 of the mouse Drp1 protein. The antibody against phospho-S579 was raised against the peptide KPIPIMPA- pS- PQKGH, while the one for phospho-S600 was raised against CVPVARKL-pS-AREQRD.
Protein extraction and western blotting
Cells were initially washed twice with cold PBS and lysed in lysis buffer (50 mM Tris-HCl pH7.5, 150 mM NaCl, EDTA 5 mM, NP40 1%, protease and phosphatase inhibitors), followed by centrifugation at 13,000 g for 10 min at 4°C. Protein extracts from mouse tissues were isolated as previously described (Boutant et al., 2014). Cleared protein lysates were quantified using BCA assay (Pierce). For western blotting, proteins were separated by SDS-PAGE and transferred onto nitrocellulose membranes. The membranes were blocked with 5% BSA prepared in TBST and incubated overnight with antibodies against target proteins (refer to Key Resources Table for information on antibodies and dilutions). Membranes were then developed by enhanced chemiluminescence (Amersham). For quantification, the intensity of each band was determined by densitometry using ImageJ software.
mRNA analyses
Total mRNA extraction and cDNA conversion were performed as previously described (Boutant et al., 2014). Gene expression levels were analyzed using SYBR Green real-time PCR (Roche). All primers used are listed in the Table S2. Relative gene expression between genotypes was assessed through the ΔΔCt method, using β2-microglobulin and cyclophilin as housekeeping genes. Mitochondrial number was assessed by using mitochondrial DNA – nuclear DNA ratio. Total DNA was extracted using the DNeasy Blood & Tissue Kit (QIAGEN, reference #69504) and mitochondrial DNA was quantified as described (Quiros et al., 2017). UCP2 and HK2 primers were used as endogenous control for nuclear DNA, while COX2 and 16S as marker for mitochondrial DNA.
Adipokine profiling
Adipokines were measured from 100 μL HFD-fed WT and Drp1 KI plasma samples by using the Mouse Adipokine Array kit (ARY013, R&D systems), following the protocol provided by the supplier.
MS-based proteomic analyses
Mice were intraperitoneally injected with PBS (as vehicle) or CL316,243 (1 mg/kg). Then, one hour later, the BAT was collected and flash frozen. Proteins were extracted and 10 mg of proteins were used to pull down phosphorylated Drp1 using either Drp1 P-S579 or P-S600 antibodies. The immunoprecipitated material was then separated with SDS-PAGE and the area surrounding the molecular weight of Drp1 was isolated and cut into 2 mm2 pieces. In gel-digestion was performed according to a standard protocol, including disulfide bridge reduction with dithiothreitol, thiol alkylation with iodoacetamide and enzymatic digestion (Shevchenko et al., 2006). Trypsin, classically used for MS-based proteomics, is expected to cleave Drp1 at lysine residues K582 and K598 and arginine residue R597, that are located in between S579 and S600. We therefore used instead another enzyme, Glu-C (Promega), that produces longer peptides and does not cleave Drp1 between S579 and S600. Glu-C should generate peptide KSKPIPIMPAS579PQKGHAVNLLDVPVPVARKLS600ARE, that can be used to probe whether the phosphorylation of S579 and S600 can occur simultaneously in the same molecule. Isotopically labeled (using heavy K and R amino acids as indicated by asterisks thereafter) and S-phosphorylated (noted [Phos]) peptide K∗SK∗PIPIMPAS[Phos]PQKGHAVNLLDVPVPVAR∗KLS[Phos]AR∗E (MW = 3941.43 Da) was synthetized by Synpeptide, to be used as a reference standard.
In-gel digested samples were spiked with peptide K∗SK∗PIPIMPAS[Phos]PQKGHAVNLLDVPVPVAR∗KLS[Phos]AR∗E and analyzed with reversed-phase (RP)-LC-MS/MS using an Ultimate 3000 RSLC nano system and an Orbitrap Fusion Lumos Tribrid mass spectrometer (Thermo Scientific) as previously described (Dayon et al., 2021). Specific modifications were made as indicated thereafter. LC separation was performed with a higher gradient of acetonitrile to optimize the elution of the peptide of interest. A parallel reaction monitoring (PRM) method was used to target different charge states (i.e., 3+, 4+, 5+ and 6+) of the endogenous and reference standard peptides. Two MS experiments ran in parallel. An MS survey scan was performed in profile mode with an Orbitrap resolution of 15000 (automatic gain control (AGC) of 4 × 10⁵), m/z scan range from 300 to 1500, RF lens set at 30%, and maximum injection time of 50 ms. The second experiment performed MS/MS scans on the list of m/z targets using higher-energy collisional dissociation at 31% of the normalized collision energy (CE). AGC target was set to 5 × 10⁴ (isolation width of 0.7 in the quadrupole), with a resolution of 120000, and maximum injection time of 246 ms with the Orbitrap acquiring in profile mode from m/z 350 to 1000.
The Skyline software (version 20.2.0.343) was used to treat LC-PRM-MS data. A spectral library obtained from the LC-PRM-MS analysis of peptide K∗SK∗PIPIMPAS[Phos]PQKGHAVNLLDVPVPVAR∗KLS[Phos]AR∗E only was used to help the identification of the endogenous and isotopically labeled forms of the doubly phosphorylated peptide in the samples. Data were transformed with Savitzky-Golay smoothing.
Measurement of acyl-carnitines in BAT
Metabolites were extracted from the brown adipose tissue (BAT) by mixing 400 μl of acetonitrile, methanol and water in a 4:4:2 proportion to the lyophilized and pulverized matrix. After mixing the sample with a vortex, the mixture was frozen under liquid nitrogen for 10-20 s, then sonicated for 20-30 s and vortexed 20 s to homogenize the mixture. These steps were repeated for a total of three complete cycles. The untargeted LC-MS data was generated using a UHPLC system (1200 series, Agilent Technologies) coupled to a G6550A ESI-qToF mass spectrometer (Agilent Technologies) operated in positive electrospray ionization (ESI+) mode. Metabolites were separated by hydrophilic interactions using an InfinityLab Poroshell 120 HILIC-Z, 2.1 × 100 mm, 2.7 μm (PEEK lined) (Agilent Technologies) column. Mobile phase A was water (50 mM ammonium acetate) and mobile phase B was acetonitrile. The separation of the extracts was conducted under the following gradient: 0-2 min 98% of B; 2-10 min decrease to 40% of B; 10-10.5 min raise to 98% of B; 10.5-15 min 98% of B. The parameters for the electrospray ionization source (ESI) were as follow: gas temperature, 200°C; drying gas, 14 L/min; nebulizer, 35 psig; fragmentor, 175 V; and skimmer,65 V. The m/z acquisition range was set between 50 and 1100, acquiring 3 spectra/s. In order to identify compounds, MS/MS data was generated in targeted mode and instrument was set to acquire spectra over the m/z range from 50 to 600, with a narrow width of 1.3 m/z. Several CE were tested between 10 and 40 V.
Data generated in the LC/MS instrument was processed and analyzed using the xcms R package (version 3.4.4) to detect and align mzRT features. The xcms R package data analysis output is a matrix containing the integrated peak area, the retention time and the m/z value of each feature for each sample (Tautenhahn et al., 2012). A pool of each sample extract was created and used as quality control sample, injected at the beginning and periodically through the worklist to correct the instrument drift, these samples are used to assess instrumental variability. Untargeted metabolomics data analysis involved feature filtering based on average intensity, variability and sample consistency, followed by PQN and tissue weight normalization. Filtered and normalized features were statistically tested using Welch’s t test, those significant were putatively annotated using LIPID MAPS Lipidomics Database and Human Metabolome Database.
Quantification and statistical analysis
Statistical analyses were performed with Prism software (GraphPad). The sample size was estimated based on the known variability of the assays. In vitro analyses were performed as minimum in duplicates in three separate experiments. For mouse time-series experiments, differences between two groups were analyzed using linear mixed effect models, with time and treatment groups as fixed effects, and animal id as a random effect. Models were fitted using restricted maximum likelihood approaches. Two types of models were performed, models testing the time∗group interaction effects; and models testing time+group additive effects. Posthoc analyses were performed using Tukey’s Honest Significance Differences. Data are expressed as means ± SEM for biological replicates. Statistical significance is indicated by the following annotations: ∗p < 0.05, ∗∗p < 0.01, ∗∗∗p < 0.001. Statistical tests and sample size are listed in each figure legend.
Acknowledgments
The authors thank Roy Combe and the entire team of the Phenotyping Unit, Center of PhenoGenomics (CPG) at EPFL, for their technical and scientific support in mouse phenotyping experiments. We thank the histology and electron microscopy facilities at EPFL for their help in processing mouse tissues for imaging. We also appreciate the assistance from Jean Daraspe and the Electron Microscopy Facility (EMF) at the University of Lausanne (UNIL). The graphical abstract and experimental scheme in Figure 7 was created with BioRender. F.S. and A.G.L. were supported by the DFG through projects 213249687-SFB 1064 and 325871075-SFB 1309. M.V.-A. and C.C. are funded by EU Marie Skłodowska-Curie ITN—ChroMe (H2020-MSCA-ITN-2015-ChroMe—project 675610).
Author contributions
M.V.-A. and C.C. designed the project. M.J. designed and generated all plasmids. M.V.-A. and M.J. performed cell culture experiments. M.V.-A., J.L.S.-G., A.C., and C.C. performed animal phenotyping experiments. J.M.-B., J.C., A.J., and O.Y. performed metabolomics experiments. L.D. and A.N.G. performed proteomic analyses. F.S. and A.G.L. contributed to the live imaging experiments. A.V. provided statistical assistance for the analysis of results. M.V.-A. and C.C. wrote the manuscript, and all authors contributed to revision and edits.
Declaration of interests
M.V.-A., M.J., J.L.S.-G., A.C., A.V., L.D., A.N.G., and C.C. are employees of Nestlé Research Ltd., Société des Produits Nestlé SA. A.G.L. is co-founder and CSO of Eisbach Bio GmbH.
Published: August 24, 2021
Footnotes
Supplemental information can be found online at https://doi.org/10.1016/j.celrep.2021.109565.
Supplemental information
Data code and availability
-
•
Metabolomics and proteomics data have been deposited at MetaboLights and ProteomeXchange, respectively. Accession numbers are listed in the Key Resources Table. Microscopy and original western blot images reported in this paper are available from the Lead Contact upon request.
-
•
This paper does not report original code.
-
•
Any additional information required to reanalyze the data reported in this paper is available from the lead contact upon request.
References
- Boutant M., Joffraud M., Kulkarni S.S., García-Casarrubios E., García-Roves P.M., Ratajczak J., Fernández-Marcos P.J., Valverde A.M., Serrano M., Cantó C. SIRT1 enhances glucose tolerance by potentiating brown adipose tissue function. Mol. Metab. 2014;4:118–131. doi: 10.1016/j.molmet.2014.12.008. [DOI] [PMC free article] [PubMed] [Google Scholar]
- Boutant M., Kulkarni S.S., Joffraud M., Ratajczak J., Valera-Alberni M., Combe R., Zorzano A., Cantó C. Mfn2 is critical for brown adipose tissue thermogenic function. EMBO J. 2017;36:1543–1558. doi: 10.15252/embj.201694914. [DOI] [PMC free article] [PubMed] [Google Scholar]
- Broskey N.T., Daraspe J., Humbel B.M., Amati F. Skeletal muscle mitochondrial and lipid droplet content assessed with standardized grid sizes for stereology. J Appl Physiol (1985) 2013;115:765–770. doi: 10.1152/japplphysiol.00063.2013. [DOI] [PubMed] [Google Scholar]
- Cannon B., Nedergaard J. Nonshivering thermogenesis and its adequate measurement in metabolic studies. J. Exp. Biol. 2011;214:242–253. doi: 10.1242/jeb.050989. [DOI] [PubMed] [Google Scholar]
- Cantó C. Mitochondrial Dynamics: Shaping Metabolic Adaptation. Int. Rev. Cell Mol. Biol. 2018;340:129–167. doi: 10.1016/bs.ircmb.2018.05.004. [DOI] [PubMed] [Google Scholar]
- Cantó C., Garcia-Roves P.M. High-Resolution Respirometry for Mitochondrial Characterization of Ex Vivo Mouse Tissues. Curr. Protoc. Mouse Biol. 2015;5:135–153. doi: 10.1002/9780470942390.mo140061. [DOI] [PubMed] [Google Scholar]
- Cereghetti G.M., Stangherlin A., Martins de Brito O., Chang C.R., Blackstone C., Bernardi P., Scorrano L. Dephosphorylation by calcineurin regulates translocation of Drp1 to mitochondria. Proc. Natl. Acad. Sci. USA. 2008;105:15803–15808. doi: 10.1073/pnas.0808249105. [DOI] [PMC free article] [PubMed] [Google Scholar]
- Chang C.R., Blackstone C. Cyclic AMP-dependent protein kinase phosphorylation of Drp1 regulates its GTPase activity and mitochondrial morphology. J. Biol. Chem. 2007;282:21583–21587. doi: 10.1074/jbc.C700083200. [DOI] [PubMed] [Google Scholar]
- Chang C.R., Blackstone C. Dynamic regulation of mitochondrial fission through modification of the dynamin-related protein Drp1. Ann. N Y Acad. Sci. 2010;1201:34–39. doi: 10.1111/j.1749-6632.2010.05629.x. [DOI] [PMC free article] [PubMed] [Google Scholar]
- Chouchani E.T., Kajimura S. Metabolic adaptation and maladaptation in adipose tissue. Nat. Metab. 2019;1:189–200. doi: 10.1038/s42255-018-0021-8. [DOI] [PMC free article] [PubMed] [Google Scholar]
- Cribbs J.T., Strack S. Reversible phosphorylation of Drp1 by cyclic AMP-dependent protein kinase and calcineurin regulates mitochondrial fission and cell death. EMBO Rep. 2007;8:939–944. doi: 10.1038/sj.embor.7401062. [DOI] [PMC free article] [PubMed] [Google Scholar]
- Dayon L., Macron C., Lahrichi S., Núñez Galindo A., Affolter M. Proteomics of Human Milk: Definition of a Discovery Workflow for Clinical Research Studies. J. Proteome Res. 2021;20:2283–2290. doi: 10.1021/acs.jproteome.0c00816. [DOI] [PubMed] [Google Scholar]
- Deus C.M., Pereira S.P., Cunha-Oliveira T., Pereira F.B., Raimundo N., Oliveira P.J. Mitochondrial remodeling in human skin fibroblasts from sporadic male Parkinson’s disease patients uncovers metabolic and mitochondrial bioenergetic defects. Biochim. Biophys. Acta Mol. Basis Dis. 2020;1866:165615. doi: 10.1016/j.bbadis.2019.165615. [DOI] [PubMed] [Google Scholar]
- Fahrner J.A., Liu R., Perry M.S., Klein J., Chan D.C. A novel de novo dominant negative mutation in DNM1L impairs mitochondrial fission and presents as childhood epileptic encephalopathy. Am. J. Med. Genet. A. 2016;170:2002–2011. doi: 10.1002/ajmg.a.37721. [DOI] [PMC free article] [PubMed] [Google Scholar]
- Favaro G., Romanello V., Varanita T., Andrea Desbats M., Morbidoni V., Tezze C., Albiero M., Canato M., Gherardi G., De Stefani D. DRP1-mediated mitochondrial shape controls calcium homeostasis and muscle mass. Nat. Commun. 2019;10:2576. doi: 10.1038/s41467-019-10226-9. [DOI] [PMC free article] [PubMed] [Google Scholar]
- Flippo K.H., Gnanasekaran A., Perkins G.A., Ajmal A., Merrill R.A., Dickey A.S., Taylor S.S., McKnight G.S., Chauhan A.K., Usachev Y.M., Strack S. AKAP1 Protects from Cerebral Ischemic Stroke by Inhibiting Drp1-Dependent Mitochondrial Fission. J. Neurosci. 2018;38:8233–8242. doi: 10.1523/JNEUROSCI.0649-18.2018. [DOI] [PMC free article] [PubMed] [Google Scholar]
- Flippo K.H., Lin Z., Dickey A.S., Zhou X., Dhanesha N.A., Walters G.C., Liu Y., Merrill R.A., Meller R., Simon R.P. Deletion of a Neuronal Drp1 Activator Protects against Cerebral Ischemia. J. Neurosci. 2020;40:3119–3129. doi: 10.1523/JNEUROSCI.1926-19.2020. [DOI] [PMC free article] [PubMed] [Google Scholar]
- Galvan D.L., Long J., Green N., Chang B.H., Lin J.S., Schumacker P., Truong L.D., Overbeek P., Danesh F.R. Drp1S600 phosphorylation regulates mitochondrial fission and progression of nephropathy in diabetic mice. J. Clin. Invest. 2019;129:2807–2823. doi: 10.1172/JCI127277. [DOI] [PMC free article] [PubMed] [Google Scholar]
- Gomes L.C., Di Benedetto G., Scorrano L. During autophagy mitochondria elongate, are spared from degradation and sustain cell viability. Nat. Cell Biol. 2011;13:589–598. doi: 10.1038/ncb2220. [DOI] [PMC free article] [PubMed] [Google Scholar]
- Gordaliza-Alaguero I., Cantó C., Zorzano A. Metabolic implications of organelle-mitochondria communication. EMBO Rep. 2019;20:e47928. doi: 10.15252/embr.201947928. [DOI] [PMC free article] [PubMed] [Google Scholar]
- Han X.J., Lu Y.F., Li S.A., Kaitsuka T., Sato Y., Tomizawa K., Nairn A.C., Takei K., Matsui H., Matsushita M. CaM kinase I alpha-induced phosphorylation of Drp1 regulates mitochondrial morphology. J. Cell Biol. 2008;182:573–585. doi: 10.1083/jcb.200802164. [DOI] [PMC free article] [PubMed] [Google Scholar]
- Ishihara N., Nomura M., Jofuku A., Kato H., Suzuki S.O., Masuda K., Otera H., Nakanishi Y., Nonaka I., Goto Y. Mitochondrial fission factor Drp1 is essential for embryonic development and synapse formation in mice. Nat. Cell Biol. 2009;11:958–966. doi: 10.1038/ncb1907. [DOI] [PubMed] [Google Scholar]
- Itoh K., Adachi Y., Yamada T., Suzuki T.L., Otomo T., McBride H.M., Yoshimori T., Iijima M., Sesaki H. A brain-enriched Drp1 isoform associates with lysosomes, late endosomes, and the plasma membrane. J. Biol. Chem. 2018;293:11809–11822. doi: 10.1074/jbc.RA117.001253. [DOI] [PMC free article] [PubMed] [Google Scholar]
- Kashatus J.A., Nascimento A., Myers L.J., Sher A., Byrne F.L., Hoehn K.L., Counter C.M., Kashatus D.F. Erk2 phosphorylation of Drp1 promotes mitochondrial fission and MAPK-driven tumor growth. Mol. Cell. 2015;57:537–551. doi: 10.1016/j.molcel.2015.01.002. [DOI] [PMC free article] [PubMed] [Google Scholar]
- Kim K.H., Jeong Y.T., Oh H., Kim S.H., Cho J.M., Kim Y.N., Kim S.S., Kim D.H., Hur K.Y., Kim H.K. Autophagy deficiency leads to protection from obesity and insulin resistance by inducing Fgf21 as a mitokine. Nat. Med. 2013;19:83–92. doi: 10.1038/nm.3014. [DOI] [PubMed] [Google Scholar]
- Koch A., Thiemann M., Grabenbauer M., Yoon Y., McNiven M.A., Schrader M. Dynamin-like protein 1 is involved in peroxisomal fission. J. Biol. Chem. 2003;278:8597–8605. doi: 10.1074/jbc.M211761200. [DOI] [PubMed] [Google Scholar]
- Kraus F., Ryan M.T. The constriction and scission machineries involved in mitochondrial fission. J. Cell Sci. 2017;130:2953–2960. doi: 10.1242/jcs.199562. [DOI] [PubMed] [Google Scholar]
- Kulkarni S.S., Joffraud M., Boutant M., Ratajczak J., Gao A.W., Maclachlan C., Hernandez-Alvarez M.I., Raymond F., Metairon S., Descombes P. Mfn1 Deficiency in the Liver Protects Against Diet-Induced Insulin Resistance and Enhances the Hypoglycemic Effect of Metformin. Diabetes. 2016;65:3552–3560. doi: 10.2337/db15-1725. [DOI] [PubMed] [Google Scholar]
- Li X., Gould S.J. The dynamin-like GTPase DLP1 is essential for peroxisome division and is recruited to peroxisomes in part by PEX11. J. Biol. Chem. 2003;278:17012–17020. doi: 10.1074/jbc.M212031200. [DOI] [PubMed] [Google Scholar]
- Liesa M., Shirihai O.S. Mitochondrial dynamics in the regulation of nutrient utilization and energy expenditure. Cell Metab. 2013;17:491–506. doi: 10.1016/j.cmet.2013.03.002. [DOI] [PMC free article] [PubMed] [Google Scholar]
- Liesa M., Palacín M., Zorzano A. Mitochondrial dynamics in mammalian health and disease. Physiol. Rev. 2009;89:799–845. doi: 10.1152/physrev.00030.2008. [DOI] [PubMed] [Google Scholar]
- Macdonald P.J., Francy C.A., Stepanyants N., Lehman L., Baglio A., Mears J.A., Qi X., Ramachandran R. Distinct Splice Variants of Dynamin-related Protein 1 Differentially Utilize Mitochondrial Fission Factor as an Effector of Cooperative GTPase Activity. J. Biol. Chem. 2016;291:493–507. doi: 10.1074/jbc.M115.680181. [DOI] [PMC free article] [PubMed] [Google Scholar]
- Mahdaviani K., Benador I.Y., Su S., Gharakhanian R.A., Stiles L., Trudeau K.M., Cardamone M., Enríquez-Zarralanga V., Ritou E., Aprahamian T. Mfn2 deletion in brown adipose tissue protects from insulin resistance and impairs thermogenesis. EMBO Rep. 2017;18:1123–1138. doi: 10.15252/embr.201643827. [DOI] [PMC free article] [PubMed] [Google Scholar]
- Mancini G., Pirruccio K., Yang X., Blüher M., Rodeheffer M., Horvath T.L. Mitofusin 2 in Mature Adipocytes Controls Adiposity and Body Weight. Cell Rep. 2019;26:2849–2858.e4. doi: 10.1016/j.celrep.2019.02.039. [DOI] [PMC free article] [PubMed] [Google Scholar]
- Merrill R.A., Flippo K.H., Strack S. Measuring Mitochondrial Shape with ImageJ. Neuromethods. 2017;123:31–48. [Google Scholar]
- Otera H., Ishihara N., Mihara K. New insights into the function and regulation of mitochondrial fission. Biochim. Biophys. Acta. 2013;1833:1256–1268. doi: 10.1016/j.bbamcr.2013.02.002. [DOI] [PubMed] [Google Scholar]
- Park H., He A., Tan M., Johnson J.M., Dean J.M., Pietka T.A., Chen Y., Zhang X., Hsu F.F., Razani B., Funai K., Lodhi I.J. Peroxisome-derived lipids regulate adipose thermogenesis by mediating cold-induced mitochondrial fission. J. Clin. Invest. 2019;129:694–711. doi: 10.1172/JCI120606. [DOI] [PMC free article] [PubMed] [Google Scholar]
- Picard M., Shirihai O.S., Gentil B.J., Burelle Y. Mitochondrial morphology transitions and functions: implications for retrograde signaling? Am. J. Physiol. Regul. Integr. Comp. Physiol. 2013;304:R393–R406. doi: 10.1152/ajpregu.00584.2012. [DOI] [PMC free article] [PubMed] [Google Scholar]
- Qi X., Disatnik M.H., Shen N., Sobel R.A., Mochly-Rosen D. Aberrant mitochondrial fission in neurons induced by protein kinase Cdelta under oxidative stress conditions in vivo. Mol. Biol. Cell. 2011;22:256–265. doi: 10.1091/mbc.E10-06-0551. [DOI] [PMC free article] [PubMed] [Google Scholar]
- Quiros P.M., Goyal A., Jha P., Auwerx J. Analysis of mtDNA/nDNA Ratio in Mice. Curr. Protoc. Mouse Biol. 2017;7:47–54. doi: 10.1002/cpmo.21. [DOI] [PMC free article] [PubMed] [Google Scholar]
- Rambold A.S., Kostelecky B., Elia N., Lippincott-Schwartz J. Tubular network formation protects mitochondria from autophagosomal degradation during nutrient starvation. Proc. Natl. Acad. Sci. USA. 2011;108:10190–10195. doi: 10.1073/pnas.1107402108. [DOI] [PMC free article] [PubMed] [Google Scholar]
- Schneider C.A., Rasband W.S., Eliceiri K.W. NIH Image to ImageJ: 25 years of image analysis. Nat. Methods. 2012;9:671–675. doi: 10.1038/nmeth.2089. [DOI] [PMC free article] [PubMed] [Google Scholar]
- Serasinghe M.N., Wieder S.Y., Renault T.T., Elkholi R., Asciolla J.J., Yao J.L., Jabado O., Hoehn K., Kageyama Y., Sesaki H., Chipuk J.E. Mitochondrial division is requisite to RAS-induced transformation and targeted by oncogenic MAPK pathway inhibitors. Mol. Cell. 2015;57:521–536. doi: 10.1016/j.molcel.2015.01.003. [DOI] [PMC free article] [PubMed] [Google Scholar]
- Shevchenko A., Tomas H., Havlis J., Olsen J.V., Mann M. In-gel digestion for mass spectrometric characterization of proteins and proteomes. Nat. Protoc. 2006;1:2856–2860. doi: 10.1038/nprot.2006.468. [DOI] [PubMed] [Google Scholar]
- Strack S., Wilson T.J., Cribbs J.T. Cyclin-dependent kinases regulate splice-specific targeting of dynamin-related protein 1 to microtubules. J. Cell Biol. 2013;201:1037–1051. doi: 10.1083/jcb.201210045. [DOI] [PMC free article] [PubMed] [Google Scholar]
- Taguchi N., Ishihara N., Jofuku A., Oka T., Mihara K. Mitotic phosphorylation of dynamin-related GTPase Drp1 participates in mitochondrial fission. J. Biol. Chem. 2007;282:11521–11529. doi: 10.1074/jbc.M607279200. [DOI] [PubMed] [Google Scholar]
- Tanaka H., Okazaki T., Aoyama S., Yokota M., Koike M., Okada Y., Fujiki Y., Gotoh Y. Peroxisomes control mitochondrial dynamics and the mitochondrion-dependent apoptosis pathway. J. Cell Sci. 2019;132:jcs224766. doi: 10.1242/jcs.224766. [DOI] [PubMed] [Google Scholar]
- Tautenhahn R., Patti G.J., Rinehart D., Siuzdak G. XCMS Online: a web-based platform to process untargeted metabolomic data. Anal. Chem. 2012;84:5035–5039. doi: 10.1021/ac300698c. [DOI] [PMC free article] [PubMed] [Google Scholar]
- Valente A.J., Maddalena L.A., Robb E.L., Moradi F., Stuart J.A. A simple ImageJ macro tool for analyzing mitochondrial network morphology in mammalian cell culture. Acta Histochem. 2017;119:315–326. doi: 10.1016/j.acthis.2017.03.001. [DOI] [PubMed] [Google Scholar]
- Virtue S., Vidal-Puig A. Assessment of brown adipose tissue function. Front. Physiol. 2013;4:128. doi: 10.3389/fphys.2013.00128. [DOI] [PMC free article] [PubMed] [Google Scholar]
- Wai T., Langer T. Mitochondrial Dynamics and Metabolic Regulation. Trends Endocrinol. Metab. 2016;27:105–117. doi: 10.1016/j.tem.2015.12.001. [DOI] [PubMed] [Google Scholar]
- Wakabayashi J., Zhang Z., Wakabayashi N., Tamura Y., Fukaya M., Kensler T.W., Iijima M., Sesaki H. The dynamin-related GTPase Drp1 is required for embryonic and brain development in mice. J. Cell Biol. 2009;186:805–816. doi: 10.1083/jcb.200903065. [DOI] [PMC free article] [PubMed] [Google Scholar]
- Wang H., Song P., Du L., Tian W., Yue W., Liu M., Li D., Wang B., Zhu Y., Cao C. Parkin ubiquitinates Drp1 for proteasome-dependent degradation: implication of dysregulated mitochondrial dynamics in Parkinson disease. J. Biol. Chem. 2011;286:11649–11658. doi: 10.1074/jbc.M110.144238. [DOI] [PMC free article] [PubMed] [Google Scholar]
- Wang W., Wang Y., Long J., Wang J., Haudek S.B., Overbeek P., Chang B.H., Schumacker P.T., Danesh F.R. Mitochondrial fission triggered by hyperglycemia is mediated by ROCK1 activation in podocytes and endothelial cells. Cell Metab. 2012;15:186–200. doi: 10.1016/j.cmet.2012.01.009. [DOI] [PMC free article] [PubMed] [Google Scholar]
- Wang L., Ishihara T., Ibayashi Y., Tatsushima K., Setoyama D., Hanada Y., Takeichi Y., Sakamoto S., Yokota S., Mihara K. Disruption of mitochondrial fission in the liver protects mice from diet-induced obesity and metabolic deterioration. Diabetologia. 2015;58:2371–2380. doi: 10.1007/s00125-015-3704-7. [DOI] [PubMed] [Google Scholar]
- Wasiak S., Zunino R., McBride H.M. Bax/Bak promote sumoylation of DRP1 and its stable association with mitochondria during apoptotic cell death. J. Cell Biol. 2007;177:439–450. doi: 10.1083/jcb.200610042. [DOI] [PMC free article] [PubMed] [Google Scholar]
- Waterham H.R., Koster J., van Roermund C.W., Mooyer P.A., Wanders R.J., Leonard J.V. A lethal defect of mitochondrial and peroxisomal fission. N. Engl. J. Med. 2007;356:1736–1741. doi: 10.1056/NEJMoa064436. [DOI] [PubMed] [Google Scholar]
- Wikstrom J.D., Mahdaviani K., Liesa M., Sereda S.B., Si Y., Las G., Twig G., Petrovic N., Zingaretti C., Graham A. Hormone-induced mitochondrial fission is utilized by brown adipocytes as an amplification pathway for energy expenditure. EMBO J. 2014;33:418–436. doi: 10.1002/embj.201385014. [DOI] [PMC free article] [PubMed] [Google Scholar]
- Zhang J., Wang J., Luan T., Zuo Y., Chen J., Zhang H., Ye Z., Wang H., Hai B. Deubiquitinase USP9X regulates the invasion of prostate cancer cells by regulating the ERK pathway and mitochondrial dynamics. Oncol. Rep. 2019;41:3292–3304. doi: 10.3892/or.2019.7131. [DOI] [PMC free article] [PubMed] [Google Scholar]
Associated Data
This section collects any data citations, data availability statements, or supplementary materials included in this article.
Supplementary Materials
Data Availability Statement
-
•
Metabolomics and proteomics data have been deposited at MetaboLights and ProteomeXchange, respectively. Accession numbers are listed in the Key Resources Table. Microscopy and original western blot images reported in this paper are available from the Lead Contact upon request.
-
•
This paper does not report original code.
-
•
Any additional information required to reanalyze the data reported in this paper is available from the lead contact upon request.