

Summary
Urbanization is a pressing challenge for earth’s humans because it is changing not only natural environments but also agricultural lands. Yet, the consequences of cropland loss on pest insect populations that largely depend on these habitats remain largely unclear. We used a 17-year data set to investigate the dynamics of three moth pest species (i.e., striped stem borer, yellow stem borer, and pink stem borer) and their driving forces across the largest mega-urban region of China. Total abundance of three pest species is declined by about 80%, which was strongly associated with cropland loss during rapid urbanization. Our findings indicate that not only the increasing conversion of natural areas to human-dominated landscapes but also that of agricultural lands to urban landscapes can be critical to insect populations. It is therefore essential to monitor and understand the insect dynamics in rapidly urbanizing regions, which are currently found in many developing countries worldwide.
Subject areas: Ecology, Entomology, Agricultural science, Economic entomology
Graphical abstract
Highlights
-
•
Urbanization has worldwide dramatic impacts on the earth's insects
-
•
Its relation to declining farmland pest insect populations remains greatly understudied
-
•
Consistent moth population decline coincided with a rapid process of urbanization
-
•
About 80% of such decline was due to loss of agricultural land
Ecology; Entomology; Agricultural science; Economic entomology
Introduction
Over the last century, urbanization has been intensified, leading to dramatic changes in land use and to the deterioration of ecosystems (Foley, 2005; Grimm et al., 2008; Fenoglio et al., 2020; Olivier et al., 2020). Substantial urban growth is occurring not only on natural habitats but also on agricultural lands (d’Amour et al., 2016; van Vliet, 2019). The process is expected to become even more significant in the future as mega-urbanization increasingly takes place on some of the world’s most productive agricultural lands, in particular in Asia and Africa (d’Amour et al., 2016). In this context, China has experienced an unprecedented pace of urbanization over the last four decades (17.9–59.6% from 1978 to 2018), mostly on highly productive agricultural lands (National Bureau of Statistics of China, 2019). Moreover, it is predicted that a quarter of future global cropland loss will occur in China (d’Amour et al., 2016; Chen et al., 2020).
Insect pests are major constraints for crop production worldwide. It has been estimated that pest species – mainly insects – cause losses of approximately 18% of total global annual crop production (Oerke, 2006). Habitat quality and host availability across the landscapes play an important role in the population dynamics of agricultural pest species (Ricci et al., 2008; Veres et al., 2013; Martin et al., 2019; Tamburini et al., 2020). For example, insect pests whose life cycles strictly depend on crop habitats are often less widespread in landscapes rich in semi-natural habitats. This is due to a decrease in crop host availability in surrounding fields (O’Rourke et al., 2011; Tamburini et al., 2020). A reduction of the habitat area in the landscapes – crop fields in this case – leads to the fragmentation of the remnant habitats into small and isolated patches (Fahrig, 2003; Watling et al., 2020), which causes a decrease in population size and colonization rate of species that depend on these habitats, directly increasing the risk of local extinctions (Hanski, 1998). Thus, landscapes with lower concentrations of a host crop are less likely to be seriously affected by pest outbreaks due to difficulties of specialized pests in locating host plants (O’Rourke and Petersen, 2017).
The same pattern might also occur with loss of croplands during rapid urbanization, but the size of this effect is not yet known. Moreover, the loss of agricultural lands could be compensated for, in terms of agricultural outputs, by intensifying remaining agricultural lands. Such agricultural intensification could represent a further factor shaping pest dynamics in the remaining habitats (Merckx et al., 2012) and potentially masking landscape influences. An improved understanding of how urbanization directly and indirectly impacts insect pest populations is urgently needed to guide urban farming in rapidly urbanizing regions.
Among insect pests, some moths can be major agricultural pests in many parts of the world, for example, striped stem borer in rice (Matteson, 2000) or corn borers in maize (Meissle et al., 2010). However, moths are also an important part of the food chain providing a valuable indicator of ecosystem health and functionality (Merckx et al., 2013). For instance, they are important primary consumers and prey for a wide range of other taxa (Arrizabalaga-Escudero et al., 2019), as well as important pollinators of agricultural plants (Merckx et al., 2013; Chen et al., 2016). Monitoring their population trends can give us vital clues to the changes occurring in our own environment, such as the effects of new farming practices, pesticides, air pollution, and climate change. Importantly, long-term agricultural pest-monitoring programs can be fundamental instruments to assess the status and trends of pest populations and developing sustainable forms of agriculture (Lu et al., 2012; Zhang et al., 2018).
The Yangtze River Delta Region (YRDR), including the four provinces of Shanghai, Jiangsu, Zhejiang, and Anhui, is the largest economic zone in China and one of the world’s six largest city clusters (Tian et al., 2011). With a Gross Domestic Product of 3.2 trillion dollars in 2018, the region has seen urbanization increase from 39.1% in 1995 to 67.4% in 2018 (National Bureau of Statistics of China, 2019). In particular, Shanghai and Jiangsu have the most developed economies among the four provinces, but while urbanization has been rapid and extensive in and around Shanghai (Zhao et al., 2006), establishing itself as one of the largest mega-urban regions worldwide, the magnitude and speed of urbanization in Jiangsu have been less profound. Differences can be also observed in agriculture, with small-scale, intensive agriculture in Shanghai and a large-scale, moderately intensive agriculture in Jiangsu. Studying the impact of urbanization on insect pest populations with long-term and large-scale datasets across the largest mega-urban region of China can therefore help to shed light on the potential impact of global trends of urbanization.
To examine the relationship between urbanization and pest populations, we analyzed the long-term dynamics of three native farmland Crambidae moths (striped stem borer, Chilo suppressalis; yellow stem borer, Scirpophaga incertulas; pink stem borer, Sesamia inferens) in Shanghai and Jiangsu during rapid urbanization (Figure 1A). These three species are major crop pests in rice and their specific association with crops can contribute considerably to understand and predict the effect of cropland loss during rapid urbanization on pest population dynamics. Daily moth abundance data were collected from April to October at 61 stations (33 in Jiangsu and 28 in Shanghai) using standardized trapping lamps over a 17-year period (2001–2017). We also compiled and quantified a range of environmental indicators to measure urbanization rate, land-use change (cropland area and landscape diversity), and agricultural intensification (mechanization level, fertilizer use intensity, and chemical fertilizer use intensity). Using a Bayesian modeling approach, we estimated the temporal trend in pest abundance for each species and tested for the effect of urbanization on this trend. By a mediation model, we then identified and quantified the possible causes (i.e. causal pathways) that link urbanization to pest insect decline through land-use change and agricultural intensification.
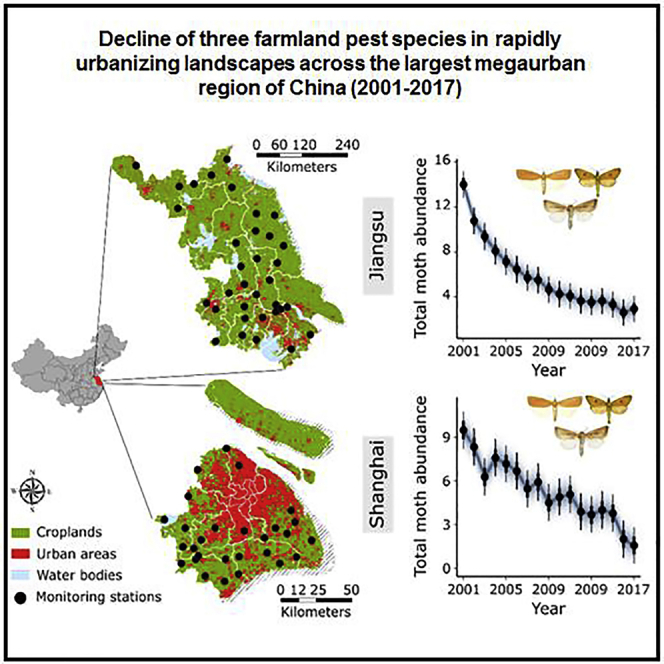
Figure 1.

Maps of the study area and temporal trends of the total abundance of three pest species and urbanization rate
(A) Maps show the distribution of croplands, urban areas and locations of monitoring stations in Jiangsu (33 stations) and Shanghai (28 stations), respectively.
(B and C) Temporal trends in total abundance of three pest species and urbanization rate for Jiangsu.
(D and E) Temporal trends in total abundance of three pest species and urbanization rate for Shanghai. In (B–D), points represent posterior median estimates, error bars are 95% credible intervals. The shading indicates random draws from the posterior distributions. Sample sizes are: ncities/districts = 10 in Jiangsu and 8 in Shanghai, nyears = 17.
Results
Pest abundance, environmental indicators, and agricultural intensification
The total abundance of the three pest species (striped stem borer, yellow stem borer, and pink rice borer) declined by 79.1% in Jiangsu and 83.2% in Shanghai over a 17-year period (2001–2017) (Figures 1B and 1D). When the pest species were treated separately, population decline in yellow stem borer was more pronounced than striped stem borer and pink stem borer (Figures S1). These trends coincided with an observed rapid process of urbanization in both provinces (Figures 1C and 1E). In Shanghai, after a sharp increase between 1995 and 2004 (from 37.8% to 63.7%), urbanization rate remained high (> 80%) since 2005 (Figure 1C). In Jiangsu, the urbanization rate increased steadily from 1995 to 2017, reaching 69.6% in 2017 (Figure 1D).
Large temporal variations were also observed for other environmental indicators (Figures S2 and S3). In Shanghai, crop planting area (i.e., habitat amount) decreased by 53.9% from 1995 to 2017 (Figure S2A). Jiangsu experienced a similar declining trend, but its magnitude was much smaller (14.8%) than that of Shanghai (Figure S3A). Landscape diversity remained relatively stable in Shanghai but decreased in Jiangsu, especially since 2005 (Figures S2B and S3B). While overall mechanization level increased considerably in both provinces (Figures S2C and S3C), the intensity of the use of chemical fertilizers and pesticides generally declined in recent years after peaking in 2006 (Figures S2D, S2E, S3D, and S3E). The magnitude of the decline in total pest abundance was significantly related to urbanization in both provinces (Figure 2). The same effect was also confirmed when the three pest species were analyzed separately (Figure S4).
Figure 2.

The effect of urbanization on the decline in total abundance of three pest species
(A and B) The relationship between urbanization rate and total abundance of three pest species is shown for Jiangsu (A) and Shanghai (B). Red lines indicate the median of the posterior distribution of the model. Gray lines represent urbanization-abundance relationships for each city in Jiangsu (each city includes 2–6 monitoring stations) and for each district in Shanghai (each district includes 1–6 stations). Sample sizes are: ncities/districts = 10 in Jiangsu and 8 in Shanghai, nyears = 17.
We also found several significant relationships with ecological indicators (Table S3). For example, pest abundance was positively related with cropland area and negatively with mechanization level. Other ecological indicators, however, showed contrasting relationships.
Mediation analysis
A mediation analysis was then implemented to further understand the causal chain linking urbanization and pest abundance. The model showed that the loss of croplands partially mediated the effect of urbanization on total pest abundance (Figure 3). Specifically, we found that urbanization indirectly affected total pest abundance by reducing cropland area in both provinces (Figures 3A and 3B). Cropland area mediated 10% of the influence of urbanization rate on total pest abundance in Jiangsu and this effect was even greater in Shanghai reaching a mediating effect of 47.4%. At the same time, the direct effects of urbanization on total pest abundance persisted in mediation models but in a smaller magnitude compared with those observed in the bivariate relationships [i.e. the standardized effect sizes in mediation models (β = −0.83, 95% CI = −0.98, −0.69 in Jiangsu; β = −0.35, CI = −0.58, −0.13 in Shanghai) were lower than in bivariate models (β = −0.93, 95% CI = −1.12, −0.78 in Jiangsu; β = −0.68, CI = −0.85, −0.49 in Shanghai)]. A similar pattern was also confirmed when the three pest species were treated separately (Figures S7–S12).
Figure 3.

Direct and indirect effects of urbanization and cropland loss on total abundance of three pest species
(A and B) Mediation model of urbanization rate as predictor of pest abundance, mediated by cropland area in Jiangsu (A) and in Shanghai (B). Patch coefficients are effect sizes estimated from the median of the posterior distribution of the model. Values in brackets are 95% credible intervals. The values near the mediator and dependent variables depict the marginal variance explained by the population-level effect only, as well as the conditional variance explained by population- and group-level effects combined. Sample sizes are: ncities/districts = 10 in Jiangsu and 8 in Shanghai, nyears = 15.
The mediation analysis also indicated that landscape diversity significantly mediated the effect of urbanization on total pest abundance (Figure S5) and pink stem borer abundance in Jiangsu (Figure S9). In Shanghai, we also found that mechanization level partially mediated the effect of urbanization on pest abundance (Figures 3 and S10–S12). Specifically, urbanization increased mechanization, which had indirect negative effects on pest abundance. In this model, 46.1% of the total effect of urbanization rate on total pest abundance was mediated by mechanization level. A similar effect was also found for pink stem borer in Jiangsu (Figure S9).
Contrary to our expectations, the intensity of the use of chemical fertilizers and pesticides did not show a significant mediating effect [80%, 90%, and 95% highest density intervals (HDIs) overlapped zero] on the relationship between urbanization rate and total pest abundance (Figures S5 and S6). However, we found that the use of chemical fertilizer and pesticides was negatively associated with urbanization [i.e. fertilizer and pesticide use decreased, respectively, between 1.4- and 2-fold and between 0.6- and 2-fold over the observed urbanization level ranges (Figures S5D, S6E, S6D, and S6E)], suggesting that the loss of cropland was not compensated for with intensification. This is further confirmed by a decline of agrochemical use in the past 10 years (Figures S1D, S1E, S2D, and S2E). Surprisingly, we found a positive mediating effect of chemical fertilizer and pesticide use on the relationship between urbanization rate and pink stem borer abundance in Shanghai (Figures S9D and S9E).
Discussion
Urbanization has been identified as one of the main land-use change drivers of insect population changes (Merckx et al., 2019; Piano et al., 2020). In this study, using data derived from a standardized long-term monitoring program, we showed that urbanization, through habitat (croplands) loss, leads to a significant decline of insect pests. Overall, the total abundance of three pest species declined by about 80%, representing a similar decline detected for macro-moths in Belgium by Merckx and Van Dyck (2019). Like many other beneficial insects, crop pests might also be experiencing rapid decline due to urbanization. While, from a pest management perspective this is positive news, we must consider that moth species are significant components of food webs, representing a substantial component of the insect biomass available to insectivorous invertebrates and an important dietary source for birds and bats. Losses of moth species could therefore catalyze further losses of species and the interruption of biotic interactions in ecosystems, contributing to ecological erosion and reduced ecosystem functioning (Merckx et al., 2018).
In our study region, striped stem borer (a polyphagous herbivore), yellow stem borer (a monophagous herbivore of rice), and pink stem borer (a polyphagous herbivore) are largely associated to crops, and the loss of these habitats are detrimental to their population survival. As indicated in other studies, the reduced area of preferred crop in the landscapes can directly suppress specialist insect pests (O’Rourke et al., 2011; Tamburini et al., 2020). Although the mechanisms of direct decline were not examined here, they may include increased mortality during dispersal or reduced fecundity (Mazzi and Dorn, 2012; O’Rourke and Petersen, 2017). More specifically, more urbanized landscapes can require more dispersal activity than cropland-dominated landscapes, which increases mortality risks. In addition, urbanized landscapes can also reduce the fitness of insect pests due to the energetic costs of increased dispersal.
We also found that mechanization level could be another important mediating factor linking urbanization and pest control. Since the larvae of the three pest species bore into the stalks of crops to feed and overwinter inside the stalks or in the soil (Kfir et al., 2002), an increased farm mechanization, especially in the harvesting and hauling of harvests, could have a detrimental effect on these species. The process of urbanization is often associated with a rapid socioeconomic development, facilitating, for example, the acquisition of new technological capacities such as farm mechanization (Figure S14). Although the overall mechanization level increased considerably in both provinces, Jiangsu showed a progressively increasing trend compared to Shanghai, which has instead shown a sharp increase since 2000. This pattern might explain why the mechanization-mediating effect was more evident in Shanghai than in Jiangsu.
Contrary to our hypothesis, agricultural intensification, through increased use of chemical fertilizers and pesticides, had little effect on local pest populations (Figures S5 and S6). It is likely that the public’s growing concern about the environmental impacts of synthetic inputs may have contributed to usage restrictions placed by local governments. While this is a positive direction, other risks could still arise from urbanization. For instance, the conversion of croplands to urban landscapes could induce the expansion of agriculture into new areas to compensate for the loss in production, potentially leading to further loss of semi-natural habitats (van Vliet, 2019).
Even though our study was restricted to three pest species, our results highlight the potential effect that urbanization could have on shaping insect population dynamics, in general. Therefore, other long-term studies are urgently needed to verify whether a similar decline can be generalized to other insect species. To this end, long-term agricultural pest-monitoring programs should consider and store all species trapped during the trap sessions, not just those with economic significance for farmers. In addition, we cannot ascertain whether the observed decline is also related to other factors, such as variation of climatic conditions, soil quality or improved farm management practices. Long-term standardized monitoring programs, although costly, are therefore fundamental instruments to assess the status and trends of insect populations, also in the context of the current insect decline (Wagner et al., 2021).
In summary, our study supports the habitat amount hypothesis in which habitat amount drives moth abundance (Fahrig, 2013, 2021; Vieira et al., 2018; Merckx et al., 2019; Watling et al., 2020). Meanwhile, our study suggests that not only the increasing conversion of natural areas to human-dominated landscapes (Merckx et al., 2019; Piano et al., 2020) but also that of agricultural lands to urban landscapes can be critical to insect populations. In this specific case, however, such decline in pest abundance along with a decline of agrochemical use in the past 10 years can be seen positive, when viewed from an agro-environmental perspective. However, from a viewpoint of conservation, our results highlight the possible negative consequences of urbanization on insect populations. The exact impact of these changes on insect population dynamics will depend on species, geographic locations of land use change, and the scale of change. In conclusion, as urbanization will continue to expand worldwide, decision-makers need to consider the impact of urban expansions on ecosystem health in land-use planning. It will be imperative to shape future urban expansion toward more sustainable trajectories to meet the twin goals of urban development and conservation of biodiversity in farming and natural ecosystems.
Limitations of the study
The major limitation of our study is that the results refer to only three pest species and we cannot ascertain whether similar trends are evident not only for other insect pest species but also to other beneficial insects such as natural enemies of insect pests or even insect pollinators. Further long-term standardized monitoring programs that consider different functional groups of insects are needed to validate or invalidate the conclusions from our analysis.
STAR★Methods
Key resources table
| REAGENT or RESOURCE | SOURCE | IDENTIFIER |
|---|---|---|
| Deposited data | ||
| Database: Jiangsu; Database: Shanghai | Jiangsu and Shanghai government official sources | https://doi.org/10.5281/zenodo.3906138 |
| Software and algorithms | ||
| R (v. 3.4.3) | The R Project for Statistical Computing | https://www.r-project.org/ |
| Bayesian data analysis | Academic Press, Boston | http://www.stat.columbia.edu/∼gelman/book/ |
| Other | ||
| Rural Statistical Yearbook of Jiangsu Province (2000–2018) | Statistics Bureau of Jiangsu Province; Survey Office of National Bureau of Statistics in Jiangsu of China; Agriculture Commission of Jiangsu Province; Marine and Fisheries Bureau of Jiangsu Province | Yearbook of Jiangsu Province |
| Jiangsu Rural Economic Data (1995–1998) | Statistics Bureau of Jiangsu Province; Agriculture Commission of Jiangsu Province | Yearbook of Jiangsu Province |
| Jiangsu Statistical Yearbook (1996–2018) | Statistics Bureau of Jiangsu Province; Survey Office of National Bureau of Statistics in Jiangsu of China | Yearbook of Jiangsu Province |
| Suzhou Statistical Yearbook (1996–2018) | Suzhou Statistics Bureau; Survey Office of National Bureau of Statistics in Suzhou of China | Yearbook of Suzhou City |
| Wuxi Statistical Yearbook (1996–2018) | Wuxi Statistics Bureau; Survey Office of National Bureau of Statistics in Wuxi of China | Yearbook of Wuxi City |
| Changzhou Statistical Yearbook (1996–2018) | Changzhou Statistics Bureau; Survey Office of National Bureau of Statistics in Changzhou of China | Yearbook of Changzhou City |
| Nanjing Statistical Yearbook (1996–2018) | Nanjing Statistics Bureau; Survey Office of National Bureau of Statistics in Nanjing of China | Yearbook of Nanjing City |
| Zhenjiang Statistical Yearbook (2000–2018) | Zhenjiang Statistics Bureau; Survey Office of National Bureau of Statistics in Zhenjiang of China | Yearbook of Zhenjiang City |
| Yangzhou Statistical Yearbook (1996–2018) | Yangzhou Statistics Bureau; Survey Office of National Bureau of Statistics in Yangzhou of China | Yearbook of Yangzhou City |
| Taizhou Statistical Yearbook (1997–2018) | Taizhou Statistics Bureau; Survey Office of National Bureau of Statistics in Taizhou of China | Yearbook of Taizhou City |
| Yancheng Statistical Yearbook (1996–2018) | Yancheng Statistics Bureau; Survey Office of National Bureau of Statistics in Yancheng of China | Yearbook of Yancheng City |
| Lianyungang Statistical Yearbook (1998–2018) | Lianyungang Statistics Bureau; Survey Office of National Bureau of Statistics in Lianyungang of China | Yearbook of Lianyungang City |
| Xuzhou Statistical Yearbook (1996–2018) | Xuzhou Statistics Bureau; Survey Office of National Bureau of Statistics in Xuzhou of China | Yearbook of Xuzhou City |
| Shanghai Countryside Statistical Yearbook (1996–2018) | Survey Office of National Bureau of Statistics in Shanghai of China; Shanghai Statistics Bureau; Agriculture Commission of Shanghai Municipality | Yearbook of Shanghai Municipality |
| Shanghai Statistical Yearbook (1996–2018) | Survey Office of National Bureau of Statistics in Shanghai of China; Shanghai Statistics Bureau | Yearbook of Shanghai Municipality |
| Shanghai Minhang Statistical Yearbook (1996–2018) | Survey Office of National Bureau of Statistics in Minhang of China; Minhang Statistics Bureau | Yearbook of Minhang District |
| Shanghai Baoshan Statistical Yearbook (1996–2018) | Survey Office of National Bureau of Statistics in Baoshan of China; Baoshan Statistics Bureau | Yearbook of Baoshan District |
| Shanghai Jiading Statistical Yearbook (1996–2018) | Survey Office of National Bureau of Statistics in Jiading of China; Jiading Statistics Bureau | Yearbook of Jiading District |
| Shanghai Jinshan Statistical Yearbook (1996–2018) | Survey Office of National Bureau of Statistics in Jinshan of China; Jinshan Statistics Bureau | Yearbook of Jinshan District |
| Shanghai Songjiang Statistical Yearbook (1996–2018) | Survey Office of National Bureau of Statistics in Songjiang of China; Songjiang Statistics Bureau | Yearbook of Songjiang District |
| Shanghai Qingpu Statistical Yearbook (1996–2018) | Survey Office of National Bureau of Statistics in Qingpu of China; Qingpu Statistics Bureau | Yearbook of Qingpu District |
| Shanghai Fengxian Statistical Yearbook (1996–2018) | Survey Office of National Bureau of Statistics in Fengxian of China, Fengxian Statistics Bureau | Yearbook of Fengxian District |
| Shanghai Pudong Statistical Yearbook (1996–2018) | Survey Office of National Bureau of Statistics in Pudong of China, Pudong Statistics Bureau | Yearbook of Pudong District |
Resource availability
Lead contact
Further information and requests for resources and reagents should be directed to and will be fulfilled by the lead contact, Bo Li (bool@fudan.edu.cn).
Materials availability
This study did not generate new unique materials.
Method details
Monitoring sites
In the 1990s, the Shanghai Agricultural Technology Extension and Service Center (SATESC) and Plant Protection and Plant Quarantine Station of Jiangsu Province (PPPPSJP) of China established 28 regular monitoring stations at 28 farms in 8 districts of Shanghai (Minhang, Jiading, Baoshan, Pudong, Fengxian, Songjiang, Qingpu and Jinshan) and 33 farms in 10 prefecture-level cities of Jiangsu (Suzhou, Wuxi, Changzhou, Nanjing, Zhenjiang, Yangzhou, Taizhou, Xuzhou, Yancheng and Lianyungang), respectively, to monitor farmland moths (striped stem borer, yellow stem borer and pink rice borer) in agricultural landscapes (Figure 1A; Table S1). Each station with an area of 1.3–2.0 ha was laid out for the monitoring. At each station, crops were cultivated with a rotation of rice and other crops (e.g., wheat-rice, barley-rice, oilseed rape-rice, or green manure-rice). Generally, rice was planted from early-to-middle June to late October. Farmers received training from the Plant Protection Stations on when and how pesticide applications were to be made. They were also requested to follow the “Pest Control Guidance” issued by the SATESC or PPPPSJP to practice pesticide sprays. The farmers were instructed to apply pesticides only when pest density reached the Economic Injury Level, which is the basis for pest control in integrated pest management (IPM) programs (Higley and Pedigo, 1993).
In the YRDR of China, just like non-crop moths, three farmland moths (striped stem borer, yellow stem borer and pink rice borer) are also pollinators although the larvae of these moths are insect pests of agriculture. In spring, the overwintering larvae of moths damage spring flowering crops (wheat seedling, barley seedling, oilseed rape, green manure, broad bean, etc.). After these crops are harvested (before June), these insects disperse into other crops in the rotation (e.g., rice, water-oat, maize). At the end of the harvesting season (middle-late October), mature larvae of moths begin to hibernate in the stalks and roots of crops (Kfir et al., 2002). The mated female adults oviposit in the crop leaves, or the newly hatched larvae feed on the leaves. After the larvae have developed to second instar, they begin to bore into the stalks of crops, and several days later they will develop into pupae and adults respectively.
Monitoring methods
Moth population monitoring lamps (manufactured by Jiaduo Company Limited, Henan Province, China) were installed on the periphery of each station to monitor farmland moth populations. Lamps attracted moths, which fell into cylindrical buckets or cloth bags below the lamp (Figure S14). Each lamp tube was hung about 1.5 m above the ground and was automatically turned on at 6: 00 p.m. and turned off at 5:00 a.m. From 2001 to 2017, in each monitoring station, trained farmers recorded the number of moths from April to September as this was when farmland moths occurred in crop fields. We collected the accessible monitoring period from 21 April to 20 September in Shanghai and from 20 April to 20 September in Jiangsu (Table S1).
Data collection
For each district (8 in Shanghai and 10 in Jiangsu), we obtained the average number of moths trapped by the lamps from 2001 to 2017. In all monitoring station, farmers uploaded the number of moths through a server dedicated to this purpose (i.e., Shanghai or Jiangsu Pest Monitoring System).
We compiled a list of environmental indicators for each district from 1995 to 2017 using the following official sources: Shanghai Statistical Yearbook (1996–2018), Jiangsu Statistical Yearbook (1996–2018), Shanghai Countryside Statistical Yearbook (1996–2018), Jiangsu Rural Economic Data (1995–1998), Rural Statistical Yearbook of Jiangsu Province (2000–2018), Statistical Yearbooks of above 8 districts of Shanghai and above 10 prefecture-level cities of Jiangsu. The collected indicators included urban population, rural population, total permanent resident population, crop planting area, chemical fertilizer and pesticide use, rice planting area, planting area of triticeae crops (wheat and barley), farming machinery power, machine-cultivated area, machine-cultivated rate, mechanical harvest area and mechanical harvest rate. Using this set of indicators, we calculated the following composite indicators: i) urbanization rate, ii) mechanization level, iii) chemical fertilizer use, and iv) pesticide use. Additionally, we landscape diversity (Shannon diversity index of land cover types), using high-resolution land cover time-series (1992–2015) in Climate Change Initiative (CCI) of the European Space Agency (http://maps.elie.ucl.ac.be/CCI/viewer/) (ESA, 2017) (Figure S15).
In Jiangsu Province, we got the rural population and the total registered population of 10 prefecture-level cities (Suzhou, Wuxi, Changzhou, Nanjing, Zhenjiang, Yangzhou, Taizhou, Xuzhou, Yancheng and Lianyungang cities) in the yearbooks from 1995 to 2005 to calculate urbanization rate of each prefecture-level city, and got the urban population and total permanent resident population of 10 prefecture-level cities in the yearbooks from 2006 to 2017 to calculate urbanization rate of each prefecture-level city. Because there is no record on total permanent resident population from 1995 to 2005, so we used total registered population to replace it to calculate urbanization rate of 10 prefecture-level cities in Jiangsu from 1995 to 2005. The sum of the rural population and urban population is the total registered population from 1995 to 2005 or is the total permanent resident population from 2006 to 2017 in Jiangsu province.
In Shanghai, we got the rural population and the total registered population of 8 districts (Minhang, Jiading, Baoshan, Pudong, Fengxian, Songjiang, Qingpu and Jinshan districts) in the yearbooks from 1995 to 2004 to calculate urbanization rate of each district, and got the rural population and total permanent resident population of 8 districts in the yearbooks from 2005 to 2017 to calculate urbanization rate of each district. Because there is no record on total permanent resident population from 1995 to 2004, so we used total registered population to replace it to calculate urbanization rate of 8 districts in Shanghai from 1995 to 2004. The sum of the rural population and urban population is the total registered population from 1995 to 2004 or is the total permanent resident population from 2005 to 2017 in Shanghai municipality.
Registered population is the permanent resident population that was registered by the Public Security Household Registration Authority of habitual residence. The permanent resident population is the population that often lives in a certain area for a certain time (≥6 months per year) (Zhang and Yang, 2013).
In all the statistical yearbooks of Shanghai, there is no record on mechanical harvest area of all crops but is only record on mechanical harvest area of rice and triticeae crop (wheat and barley), so we calculated it: the mechanical harvest rate (%) = mechanical harvest area of rice and triticeae crop/planting area of rice and triticeae crop × 100%.
When we analyze the crop planting area, rice planting area, planting area of triticeae crops (wheat and barley), farming machinery power, machine-cultivated area and mechanical harvest area, these indicator values of each prefecture-level city of Jiangsu province were the sum of that from the county-level cities where the insect monitoring sites were located. Namely, the indicator values of Suzhou City is from the county-level cities of Zhangjiagang, Taicang and Wujiang, Wuxi City from Jiangyin and Yixing, Changzhou City from Wujin, Liyang and Jintan, Nanjing City from Gaochun, Pukou and Jiangning, Zhenjiang City from Danyang and Yangzhong, Yangzhou City from Jiangdu, Gaoyou, Yizheng and Baoying, Taizhou City from Jingjiang, Jiangyan and Xinghua, Yancheng City from Yandu, Dongtai, Dafeng, Sheyang, Funing and Jianhu, Lianyungang City from Guanyun, Donghai and Ganyu, and Xuzhou City from Pizhou, Xinyi, Peixian and Suining.
Because the recorded data on the amount of pesticide use was unnormal large in 8 districts (rather than Minhang district) of Shanghai in the yearbook in 2010, and we obtained the pesticide use for each district (rather than Minhang district) in 2010 by averaging pesticide input in 2009 and that in 2011 (this estimate was considered to be reasonable by Shanghai agricultural experts).
A decline of crop planting areas always accompanies the change of land use types. Farmland moth populations are largely influenced by the diversity of its habitat. Thus, we calculated the Shannon’s diversity index (SHDI), reflecting the diversity of habitat landscape. The land cover maps from 1992 to 2015 were downloaded from the website of the Climate Change Initiative (CCI) of the European Space Agency (http://maps.elie.ucl.ac.be/CCI/viewer/). The SHDI for each year during 1992–2015 was calculated based on the land cover map for the buffer area of each location in Jiangsu and Shanghai. Each buffer area has a radium distance of 5 km, which equals to the maximum flying distance of the insects. The connectivity indicator was calculated with the following equation:
| (Equation 1) |
where Pi is the proportion of the landscape occupied by land cover type (class) i. The SHDI of the 28 locations in Shanghai and 33 locations in Jiangsu for each year during 1992–2015 were calculated.
Quantification and statistical analysis
To test for temporal trends in pest abundance and environmental indicators, we fitted a hierarchical model with partially pooled intercepts (also commonly referred to as random intercepts). All models followed the same basic equation:
| (Equation 2) |
| (Equation 3) |
| (Equation 4) |
where y is pest abundance or environmental indicator (depending on the model), x is year, i represent a single observation, s represents stations, and ŷ is the predicted value of y. This model allows variation across stations to account for the repeated measure at the station level.
We fitted a hierarchical model with partially pooled slopes (also commonly referred to as random slopes) to study relationships between environmental indicators and moth abundance. All models followed the same basic equation:
| (Equation 5) |
| (Equation 6) |
| (Equation 7) |
where y is pest abundance, x is environmental indicator, i represent a single observation, s represents stations, and ŷ is the predicted value of y. This partial-pooling model estimated both farm-level responses [yielding an estimate for each station (βs)] and the distribution from which the station-level estimates were drawn, yielding a higher-level estimate of the overall response across crop systems (μβ). In addition, it accounted for variation in variance and sample size across observations (for example, stations).
In a Bayesian multivariate response model with causal mediation effects (hereafter, mediation model), we tested whether urbanization directly influences pest abundance or is instead mediated by other factors (i.e. land-use change and agricultural intensification indicators). Mediation analysis is a statistical procedure to test whether the effect of an independent variable x on a dependent variable y (x → y) is at least partly explained via the inclusion of a third hypothetical variable, the mediator variable m (x → m → y). The three causal paths a, b, and c’ correspond to x’s effect on m, m’s effect on y, and x’s effect on y accounting for m, respectively. The three causal paths correspond to parameters from two regression models, one in which m is the outcome and x is the predictor and one in which y is the outcome and x and m are the simultaneous predictors (Figure S16). From these parameters, we can compute the mediation effect (the product ab, also known as the indirect effect) and the total effect of x on y.
| (Equation 8) |
Thus, the total causal effect of x, which is captured by the parameter c, can be decomposed precisely into two components, a direct effect c’ and an indirect (mediation) effect ab (the product of paths a and b). The ratio between indirect and total effect (ab/[ab + c′], i.e., the proportion mediated) was calculated for significant indirect effects. Separate mediation models were analyzed to test the mediating effect of (i) cropland area, (ii) landscape diversity, (iii) mechanization level, (iv) fertilizer intensity, and (v) pesticide use. All models followed the same basic equation:
| (Equation 9) |
| (Equation 10) |
where m is mediator variable (cropland area, landscape diversity, mechanization level, fertilizer intensity or pesticide use, depending on the model), x is urbanization rate, y is pest abundance, i represent a single observation, s represents stations, and ŷ is the predicted value of y. We then specified the multivariate multilevel model in a matrix-vector notion (Gelman and Hill, 2007), as follows:
| (Equation 11) |
| (Equation 12) |
where Yi is the matrix of response variables with observations i as rows and variables r as columns, Xi is the matrix of all predictors for response r, Br are the regression parameters (α and β) for response r, MB represents the mean of the distribution of the regression parameters, and ƩB is the covariance matrix representing the variation of the regression parameters in the population groups. In building the model, we ensured that no residual correlation between y and x or y and m was estimated (see ‘set_rescor’ function in the package brms). A compound index of mechanization level was derived by averaging the z-scores of three indicators: farming by averaging the z-scores of three indicators: farming machinery power per crop unit, mechanical harvest rate, and machine-cultivated rate. Before performing the mediation model, we standardized the continuous predictor using z-scores within each station.
All models were conducted in Stan through R (v. 3.4.3) using the package brms v 2.2.0 (Bürkner, 2017). Stan provides efficient MCMC sampling via a No-U-Turn Hamiltonian Monte Carlo approach. Each model was run with four independent Markov chains of 5,000 iterations, discarding the first 2,500 iterations per chain as warm-up and resulting in 10,000 posterior samples overall. Convergence of the four chains and sufficient sampling of posterior distributions were confirmed by: (i) the visual inspection of parameter traces, (ii) ensuring a scale reduction factor (Ȓ) below 1.01, and (iii) effective size (neff) of at least 10% of the number of iterations. For each model, posterior samples were summarized based on the Bayesian point estimate (median), standard error (median absolute deviation), and posterior uncertainty intervals by highest density intervals (HDIs), a type of credible interval which contains the required mass such that all points within the interval have a higher probability density than points outside the interval (Kruschke, 2015). The advantage of the Bayesian approach is the possibility not only to estimate expected values for each parameter, but also the uncertainty associated with these estimates (Vehtari et al., 2017). Thus, we calculated 80%, 90% and 95% HDIs for parameter estimates. For each model, we also calculated the marginal (rm2) variance explained by the population-level effect only, as well as the conditional (rc2) variance explained by population- and group-level effects combined.
Acknowledgments
We thank the agricultural technicians of the 61 stations, the Shanghai Agricultural Technology Extension and Service Center, Plant Protection Station and Plant Quarantine of Jiangsu Province and their affiliations for collecting data; we thank Agriculture Commission, Bureau of Statistics and Meteorological Bureau of Shanghai Municipality and Jiangsu Province who provide official data. We thank Liguang Liu, Xiaodong Qin, Chen Zhang, Chaoxuan Zhang, Jianfang Chen, Tianyu Luo, Chunjing Zhang, Jianfei Lu, Yunping Wang, Gao Hu, and Hongliang Gao who helped us to collect urbanization information; Jiyang Qin, Xiaojun Zhou, Shigao Chen, Chenghong Liu, Li He, Zhaohui Zhang, Yuzhou Du, Huihua Gan, and Yuping Jiang who provided us photos; Ming Zhou for designing the logo of path analysis; Forest Isbell and Teja Tscharntke for giving useful suggestions; Sebastian Candiago for preparing the map; Xiangrong Zheng for early review of this paper; and Valentina Giombini for language editing. This study was funded by grants from Agriculture Research System of Shanghai, China (grant no. 201908), Jiangsu "Six Talent Peaks" High-Level Talent Project (NY-088), Jiangsu "333 Project" (BRA2019314) and SAAS Program for Excellent Research Team (2018[B-01]); W.Z. was supported by CGIAR research program on Water, Land, and Ecosystems.
Author contributions
N.-F.W., M.D., Y.-M.C., J.-X.J., and B.L. conceived the study; F.Z, W.-M.W., M.-T.W., J.-W.Z., W.C., C.Z., S.-J.C., Q.W., Y.-P.J., X.-W.W., H.-J.Y, H.-H.G., H.-M.S., Y.L., Z.-J.Z., J.-J.Z., and W.-Y.C. performed the study; N.-F.W., F.Z., L.-B.X., J.-Y.W., Y.-P.J., X.-Y.J., C.Z., Y.-M.C., J.-X.J., and B.L. collected the monitoring and urbanization data; N.-F.W., M.D., and W.Z. performed statistical analyses; N.-F.W., M.D., W.Z., Y.-M.C., J.-X.J., and B.L. wrote the manuscript draft; N.-F.W., M.D., W.Z., and B.L edited the manuscript; N.-F.W., M.D., and J.M. collected and analyzed satellite remote sensing data; N.F.W., M.D., and S.-Y.Q. made the maps.
Declaration of interests
The authors declare no competing interests.
Published: September 24, 2021
Footnotes
Supplemental information can be found online at https://doi.org/10.1016/j.isci.2021.103002.
Contributor Information
You-Ming Cai, Email: cym59059@163.com.
Jie-Xian Jiang, Email: jiangjiexian@163.com.
Bo Li, Email: bool@fudan.edu.cn.
Supplemental information
Data and code availability
All raw data generated in this study have been deposited to Zenodo and are publicly available as of the date of publication. DOIs are listed in the key resources table (https://doi.org/10.5281/zenodo.3906138). Codes are available from the corresponding author upon reasonable request. Any additional information required to reanalyze the data reported in this paper is available from the lead contact upon request.
References
- Arrizabalaga-Escudero A., Merckx T., García-Baquero G., Wahlberg N., Aizpurua O., Garin I., Goiti U., Aihartza J. Trait-based functional dietary analysis provides a better insight into the foraging ecology of bats. J. Anim. Ecol. 2019;88:1587–1600. doi: 10.1111/1365-2656.13055. [DOI] [PubMed] [Google Scholar]
- Bürkner P.C. brms: an R package for Bayesian multilevel models using Stan. J. Stat. Softw. 2017;80:1–27. [Google Scholar]
- Chen G., Liu C., Sun W. Pollination and seed dispersal of Aquilaria sinensis (Lour.) Gilg (Thymelaeaceae): an economic plant species with extremely small populations in China. Plant Divers. 2016;38:27–32. doi: 10.1016/j.pld.2016.09.006. [DOI] [PMC free article] [PubMed] [Google Scholar]
- Chen G., Li X., Liu X., Chen Y., Liang X., Leng J., Xu X., Liao W., Qiu Y., Wu Q., Huang K. Global projections of future urban land expansion under shared socioeconomic pathways. Nat. Commun. 2020;11:537. doi: 10.1038/s41467-020-14386-x. [DOI] [PMC free article] [PubMed] [Google Scholar]
- d’Amour C.B., Reitsma F., Baiocchi G., Barthel S., Güneralp B., Erb K.H., Haberl H., Creutzig F., Seto K.C. Future urban land expansion and implications for global croplands. Proc. Natl. Acad. Sci. U S A. 2016;114:8939–8944. doi: 10.1073/pnas.1606036114. [DOI] [PMC free article] [PubMed] [Google Scholar]
- ESA. (2017). Land Cover CCI Product User Guide Version 2. Tech. Rep.
- Fahrig L. Effects of habitat fragmentation on biodiversity. Annu. Rev. Ecol. Evol. Systemat. 2003;34:487–515. [Google Scholar]
- Fahrig L. Rethinking patch size and isolation effects: the habitat amount hypothesis. J. Biogeogr. 2013;40:1649–1663. [Google Scholar]
- Fahrig L. What the habitat amount hypothesis does and does not predict: a reply to Saura. J. Biogeogr. 2021;48:1530–1535. [Google Scholar]
- Fenoglio M.S., Rossetti M.R., Videla M. Negative effects of urbanization on terrestrial arthropod communities: a meta-analysis. Glob. Ecol. Biogeogr. 2020;29:1412–1429. [Google Scholar]
- Foley J.A. Global consequences of land use. Science. 2005;309:570–574. doi: 10.1126/science.1111772. [DOI] [PubMed] [Google Scholar]
- Gelman A., Hill J. Cambridge University Press; 2007. Data Analysis Using Regression and Multilevel Hierarchical Models. [Google Scholar]
- Grimm N.B., Faeth S.H., Golubiewski N.E., Redman C.L., Wu J., Bai X., Briggs J.M. Global change and the ecology of cities. Science. 2008;319:756–760. doi: 10.1126/science.1150195. [DOI] [PubMed] [Google Scholar]
- Hanski I. Metapopulation dynamics. Nature. 1998;396:41–49. [Google Scholar]
- Higley L.G., Pedigo L.P. Economic injury level concepts and their use in sustaining environmental quality. Agri. Ecosyst. Environ. 1993;46:233–243. [Google Scholar]
- Kfir R., Overholt W.A., Khan Z.R., Polaszek A. Biology and management of economically important Lepidopteran cereal stem borers in Africa. Ann. Rev. Entomol. 2002;47:701–731. doi: 10.1146/annurev.ento.47.091201.145254. [DOI] [PubMed] [Google Scholar]
- Kruschke J.K. Academic Press; 2015. Doing Bayesian Data Analysis: A Tutorial with R, JAGS, and Stan. [Google Scholar]
- Lu Y., Wu K., Jiang Y., Guo Y., Desneux N. Widespread adoption of Bt cotton and insecticide decrease promotes biocontrol services. Nature. 2012;487:362–365. doi: 10.1038/nature11153. [DOI] [PubMed] [Google Scholar]
- Martin E.A., Dainese M., Clough Y., Báldi A., Bommarco R., Gagic V., Garratt M.P.D., Holzschuh A., Kleijn D., Kovács-Hostyánszki A. The interplay of landscape composition and configuration: new pathways to manage functional biodiversity and agroecosystem services across Europe. Ecol. Lett. 2019;22:1083–1094. doi: 10.1111/ele.13265. [DOI] [PubMed] [Google Scholar]
- Matteson P.C. Insect pest management in tropical Asian irrigated rice. Annu. Rev. Entomol. 2000;45:549–574. doi: 10.1146/annurev.ento.45.1.549. [DOI] [PubMed] [Google Scholar]
- Mazzi D., Dorn S. Movement of insect pests in agricultural landscapes. Ann. Appl. Biol. 2012;160:97–113. [Google Scholar]
- Meissle M., Mouron P., Musa T., Bigler F., Pons X., Vasileiadis V.P., Otto S., Antichi D., Kiss J., Pálinkás Z. Pests, pesticide use and alternative options in European maize production: current status and future prospects. J. Appl. Entomol. 2010;134:357–375. [Google Scholar]
- Merckx T., de Miranda M.D., Pereira H.M. Habitat amount, not patch size and isolation, drives species richness of macro-moth communities in countryside landscapes. J. Biogeogr. 2019;46:956–967. [Google Scholar]
- Merckx T., Huertas B., Basset Y., Thomas J.A. In: Key Topics in Conservation Biology 2. Macdonald D.W., Willis K.J., editors. Wiley; 2013. A global perspective on conserving butterflies and moths and their habitats; pp. 237–257. [Google Scholar]
- Merckx T., Kaiser A., van Dyck H. Increased body size along urbanization gradients at both community and intraspecific level in macro-moths. Glob. Change Biol. 2018;24:3837–3848. doi: 10.1111/gcb.14151. [DOI] [PubMed] [Google Scholar]
- Merckx T., Marini L., Feber R.E., Macdonald D.W. Hedgerow trees and extended-width field margins enhance macro-moth diversity: implications for management. J. Appl. Ecol. 2012;49:1396–1404. [Google Scholar]
- Merckx T., Van Dyck H. Urbanization-driven homogenization is more pronounced and happens at wider spatial scales in nocturnal and mobile flying insects. Glob. Ecol. Biogeogr. 2019;28:1440–1455. [Google Scholar]
- National Bureau of Statistics of China . China Statistics Press; 2019. China Statistical Yearbook. [Google Scholar]
- Olivier T., Thébault E., Elias M., Fontaine B., Fontaine C. Urbanization and agricultural intensification destabilize animal communities differently than diversity loss. Nat. Commun. 2020;11:2686. doi: 10.1038/s41467-020-16240-6. [DOI] [PMC free article] [PubMed] [Google Scholar]
- O’Rourke M.E., Petersen M.J. Extending the ‘resource concentration hypothesis’ to the landscape-scale by considering dispersal mortality and fitness costs. Agric. Ecosyst. Environ. 2017;249:1–3. [Google Scholar]
- O’Rourke M.E., Rienzo-Stack K., Power A.G. A multi-scale, landscape approach to predicting insect populations in agroecosystems. Ecol. Appl. 2011;21:1782–1791. doi: 10.1890/10-0241.1. [DOI] [PubMed] [Google Scholar]
- Oerke E.C. Crop losses to pests. J. Agr. Sci. 2006;144:31–43. [Google Scholar]
- Piano E., Souffreau C., Merckx T., Baardsen L.F., Backeljau T., Bonte D., Brans K.I., Cours M., Dahirel M., Debortoli N. Urbanization drives cross-taxon declines in abundance and diversity at multiple spatial scales. Glob. Change Biol. 2020;26:1196–1211. doi: 10.1111/gcb.14934. [DOI] [PubMed] [Google Scholar]
- Ricci B., Franck P., Toubon J.F., Bouvier J.C., Sauphanor B., Lavigne C. The influence of landscape on insect pest dynamics: a case study in southeastern France. Landscape Ecol. 2008;24:337–349. [Google Scholar]
- Tamburini G., Santoiemma G., O'Rourke M.E., Bommarco R., Chaplin-Kramer R., Dainese M., Karp D.S., Kim T.N., Martin E.A., Petersen M. Species traits elucidate crop pest response to landscape composition: a global analysis. Proc. R. Soc. B. 2020;287:20202116. doi: 10.1098/rspb.2020.2116. [DOI] [PMC free article] [PubMed] [Google Scholar]
- Tian G., Jiang J., Yang Z., Zhang Y. The urban growth, size distribution and spatio-temporal dynamic pattern of the Yangtze River Delta megalopolitan region, China. Ecol. Model. 2011;222:865–878. [Google Scholar]
- van Vliet J. Direct and indirect loss of natural area from urban expansion. Nat. Sustain. 2019;2:755–763. [Google Scholar]
- Vehtari A., Gelman A., Gabry J. Practical Bayesian model evaluation using leave-one-out cross-validation and WAIC. Stat. Comput. 2017;27:1413–1432. [Google Scholar]
- Veres A., Petit S., Conord C., Lavigne C. Does landscape composition affect pest abundance and their control by natural enemies? A review. Agric. Ecosyst. Environ. 2013;166:110–117. [Google Scholar]
- Vieira M.V., Almeida-Gomes M., Delciellos A.C., Cerqueira R., Crouzeilles R. Fair tests of the habitat amount hypothesis require appropriate metrics of patch isolation: an example with small mammals in the Brazilian Atlantic Forest. Biol. Conserv. 2018;226:264–270. [Google Scholar]
- Wagner D.L., Fox R., Salcido D.M., Dyer L.A. A window to the world of global insect declines: moth biodiversity trends are complex and heterogeneous. Proc. Natl. Acad. Sci. U S A. 2021;118 doi: 10.1073/pnas.2002549117. e2002549117. [DOI] [PMC free article] [PubMed] [Google Scholar]
- Watling J.I., Arroyo-Rodríguez V., Pfeifer M., Baeten L., Banks-Leite C., Cisneros L.M., Fang R., Hamel-Leigue A.C., Lachat T., Leal I.R. Support for the habitat amount hypothesis from a global synthesis of species density studies. Ecol. Lett. 2020;23:674–681. doi: 10.1111/ele.13471. [DOI] [PubMed] [Google Scholar]
- Zhang W., Lu Y., van der Werf W., Huang J., Wu F., Zhou K., Deng X., Jiang Y., Wu K., Rosegrant M.W. Multidecadal, county-level analysis of the effects of land use, Bt cotton, and weather on cotton pests in China. Proc. Natl. Acad. Sci. U S A. 2018;115:7700–7709. doi: 10.1073/pnas.1721436115. [DOI] [PMC free article] [PubMed] [Google Scholar]
- Zhang D., Yang S.P. Analysis on maternal death among permanent resident population in Wuhan city from 2001 to 2010. Matern. Child Health Care China. 2013;28:605–608. (in Chinese) [Google Scholar]
- Zhao S., Da L., Tang Z., Fang H., Song K., Fang J. Ecological consequences of rapid urban expansion: Shanghai, China. Front. Ecol. Environ. 2006;4:341–346. [Google Scholar]
Associated Data
This section collects any data citations, data availability statements, or supplementary materials included in this article.
Supplementary Materials
Data Availability Statement
All raw data generated in this study have been deposited to Zenodo and are publicly available as of the date of publication. DOIs are listed in the key resources table (https://doi.org/10.5281/zenodo.3906138). Codes are available from the corresponding author upon reasonable request. Any additional information required to reanalyze the data reported in this paper is available from the lead contact upon request.